. 2022 Nov 30:9:865788.
doi: 10.3389/fmolb.2022.865788. eCollection 2022.

Intestinal flora induces depression by mediating the dysregulation of cerebral cortex gene expression and regulating the metabolism of stroke patients

Affiliations

Intestinal flora induces depression by mediating the dysregulation of cerebral cortex gene expression and regulating the metabolism of stroke patients

Xuebin Li et al. Front Mol Biosci. .

Abstract

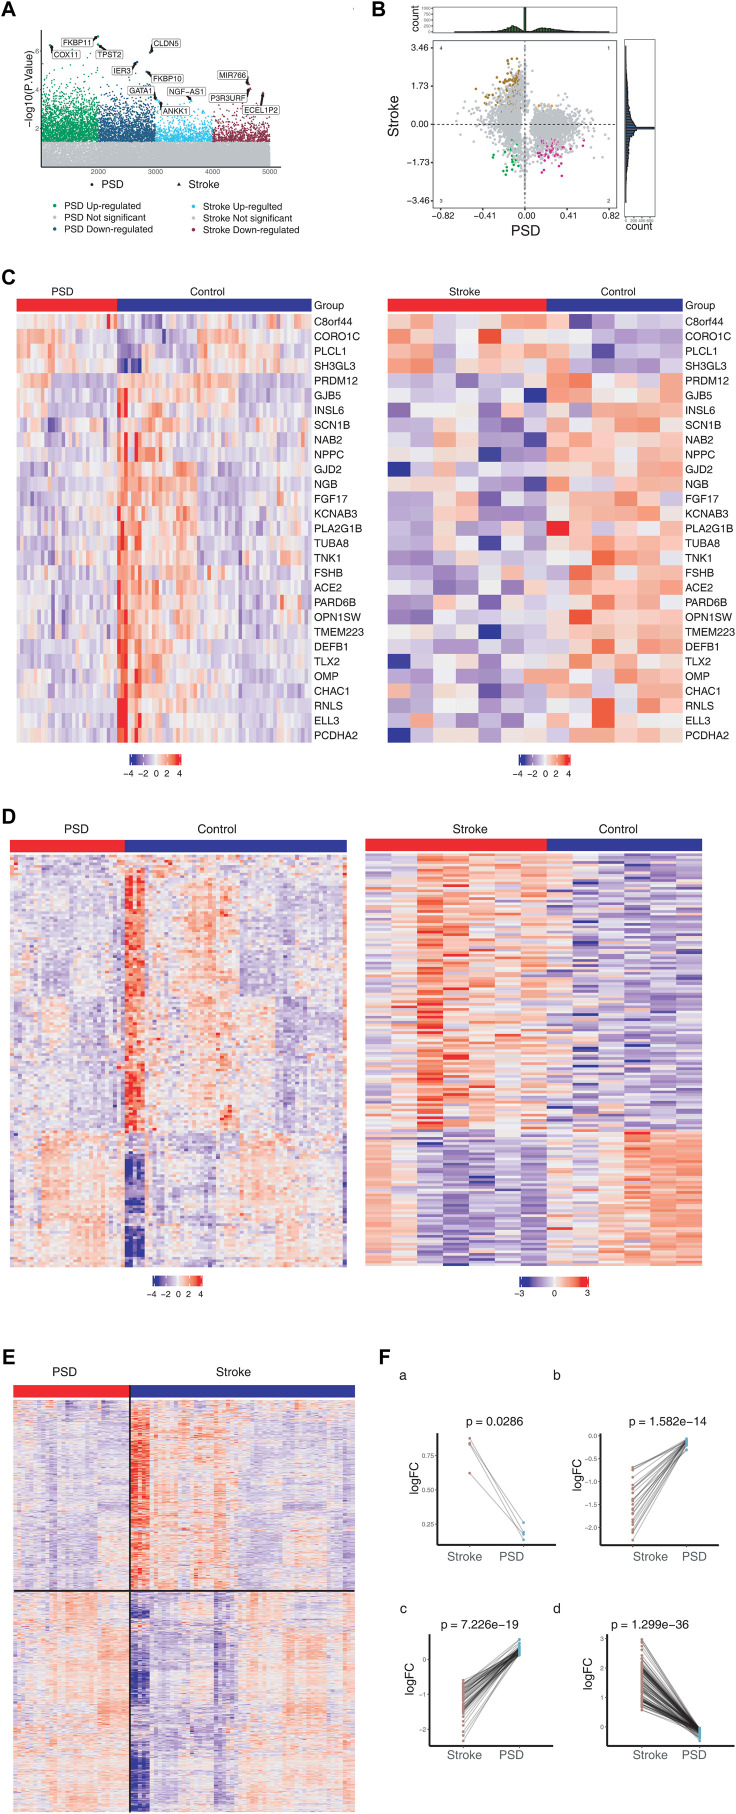
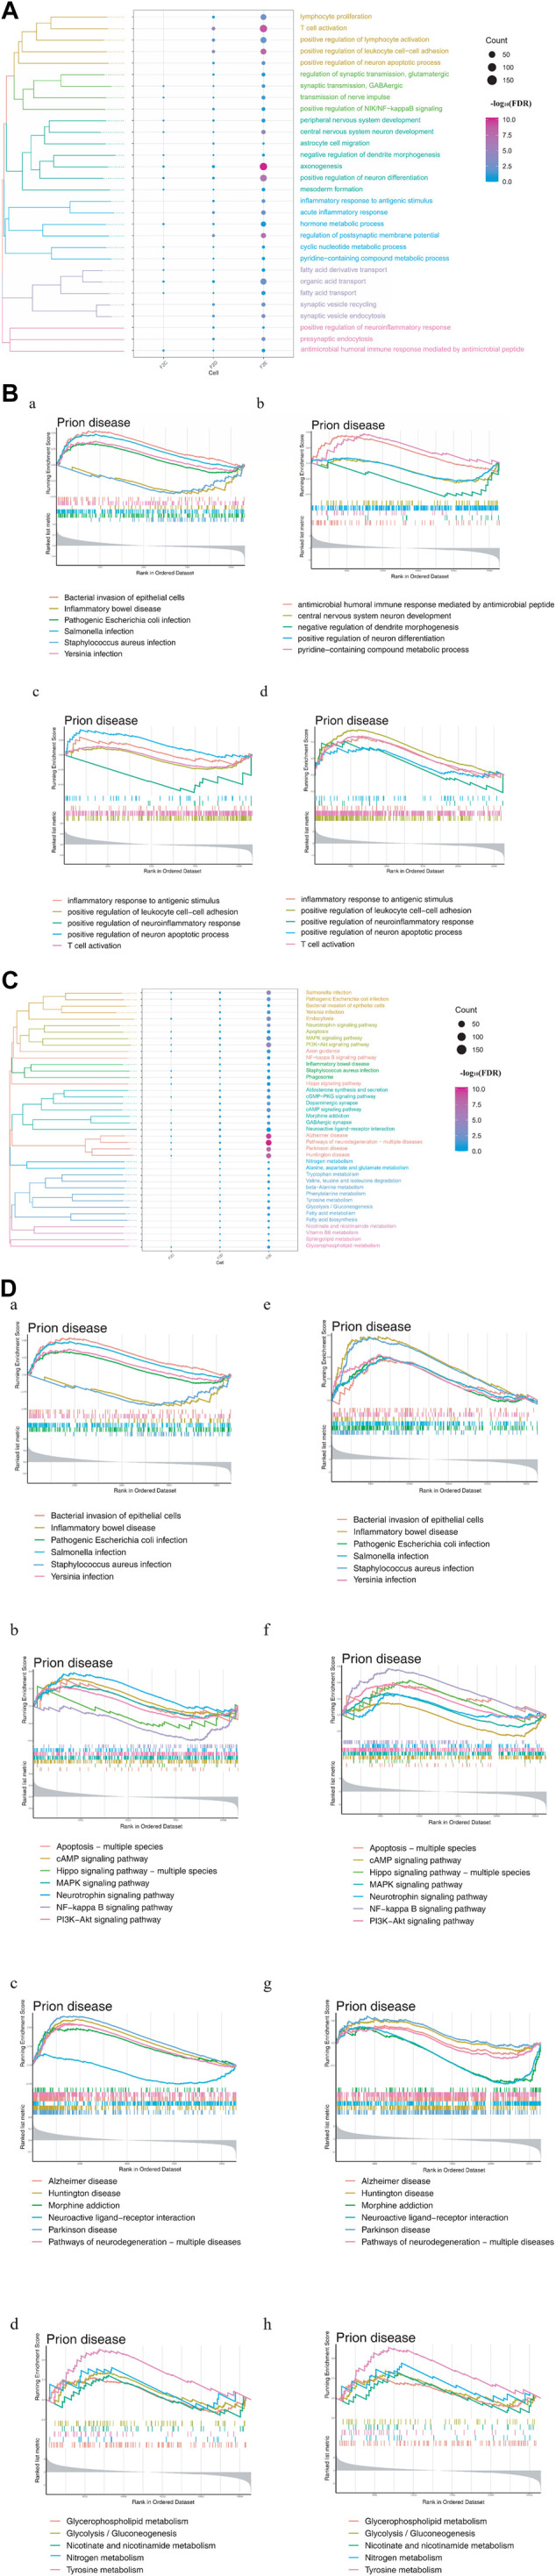
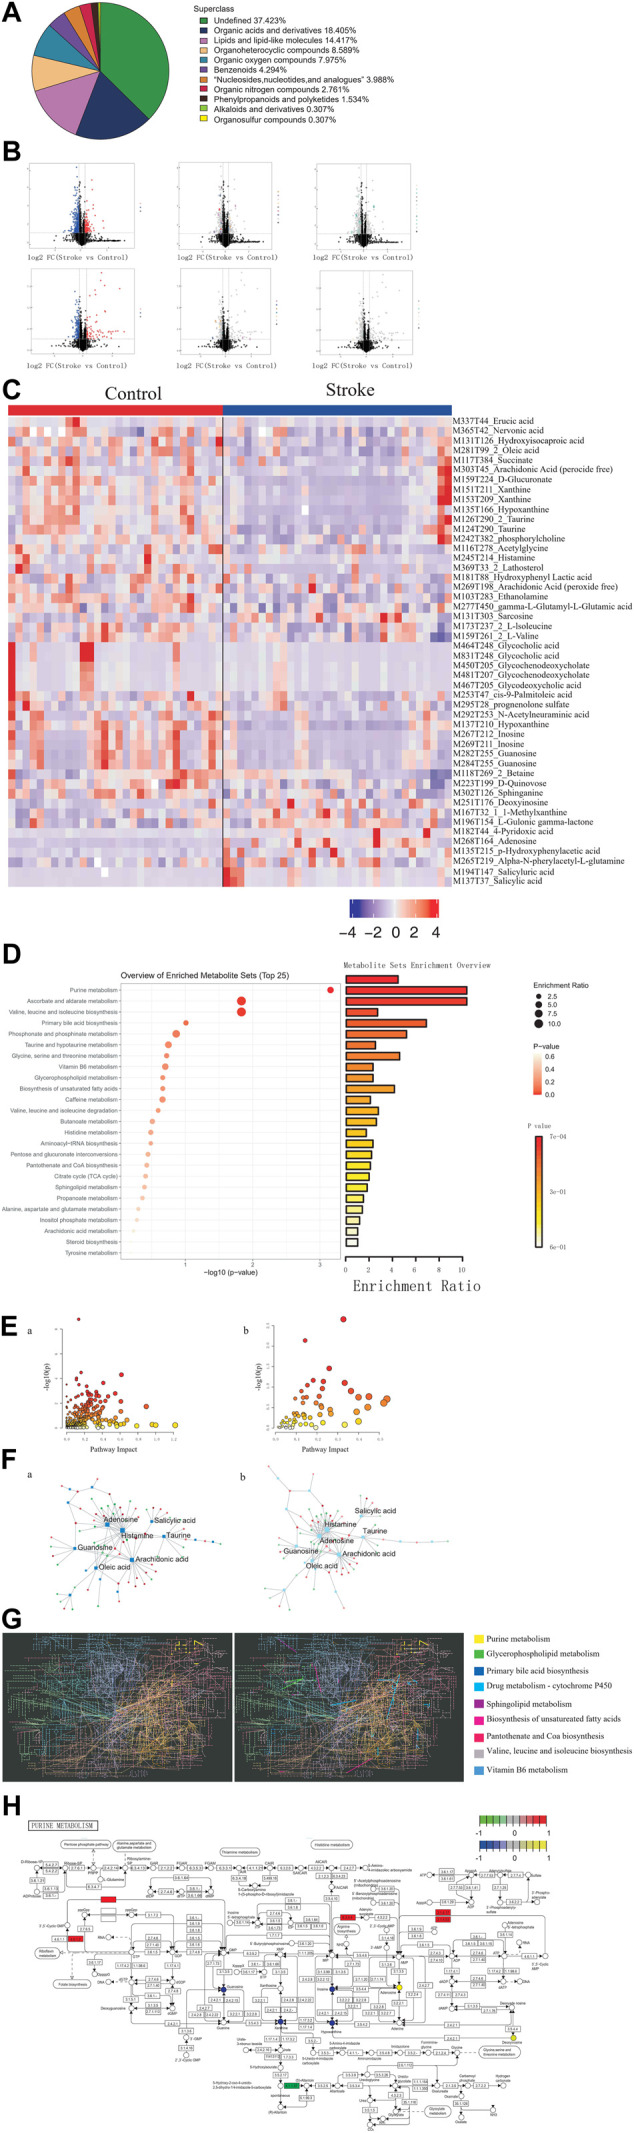
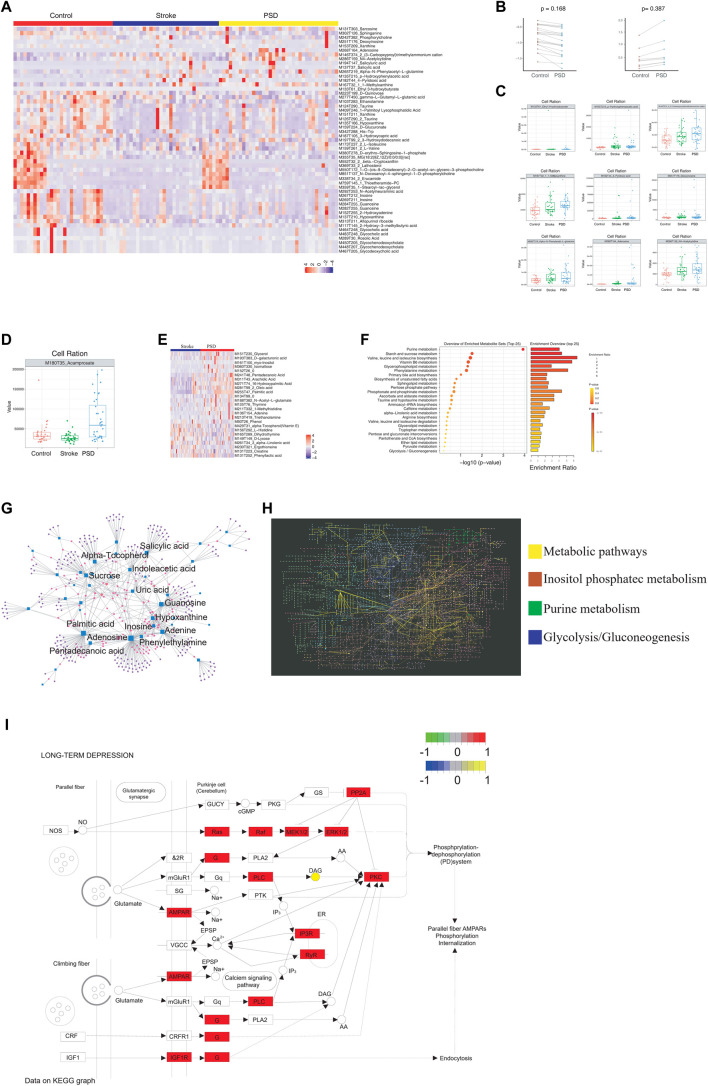
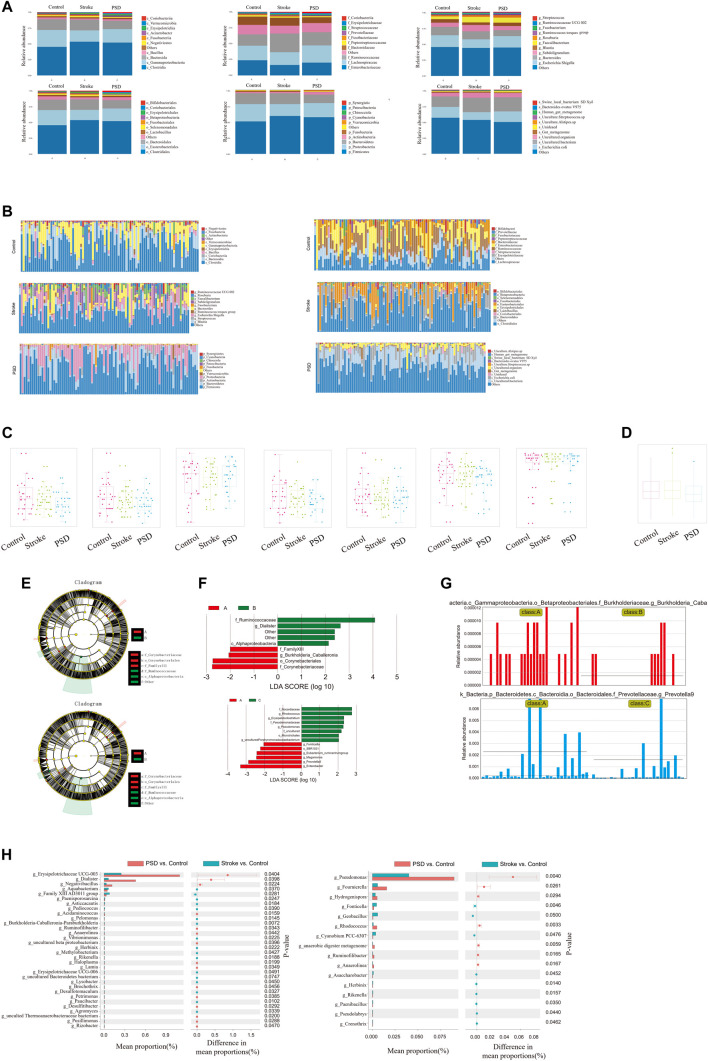
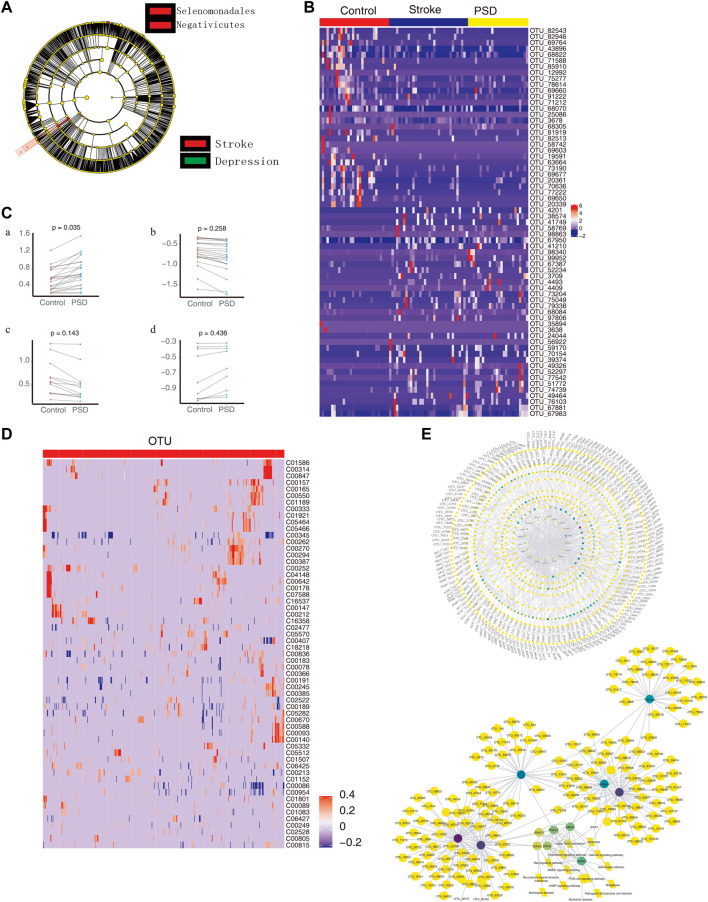
Post-stroke depression (PSD) is a common cerebrovascular complication characterized by complex pathogenesis and poor treatment effects. Here, we tested the influence of differentially expressed genes (DEGs), non-targeted metabolites, and intestinal microbes on the occurrence and development of PSD. We acquired gene expression profiles for stroke patients, depression patients, and healthy controls from the Gene Expression Omnibus database. After screening for DEGs using differential expression analysis, we identified common DEGs in stroke and depression patients that were considered to form the molecular basis of PSD. Functional enrichment analysis of DEGs also revealed that the majority of biological functions were closely related to metabolism, immunity, the nervous system, and microorganisms, and we also collected blood and stool samples from healthy controls, stroke patients, and PSD patients and performed 16S rDNA sequencing and untargeted metabolomics. After evaluating the quality of the sequencing data, we compared the diversity of the metabolites and intestinal flora within and between groups. Metabolic pathway enrichment analysis was used to identify metabolic pathways that were significantly involved in stroke and PSD, and a global metabolic network was constructed to explore the pathogenesis of PSD. Additionally, we constructed a global regulatory network based on 16S rDNA sequencing, non-targeted metabolomics, and transcriptomics to explore the pathogenesis of PSD through correlation analysis. Our results suggest that intestinal flora associates the dysregulation of cerebral cortex gene expression and could potentially promote the occurrence of depression by affecting the metabolism of stroke patients. Our findings may be helpful in identifying new targets for the prevention and treatment of PSD.

Keywords: cerebral cortex; depression; intestinal flora; metabolism; stroke.


Conflict of interest statement

The authors declare that the research was conducted in the absence of any commercial or financial relationships that could be construed as a potential conflict of interest.

Figures

FIGURE 1
FIGURE 1
Molecular characteristics of stroke and PSD patients. (A). Manhattan diagram depicting dysregulated genes in stroke and PSD patients. (B). Quadrant chart presenting the expression pattern of genes in stroke and PSD patients. (C). Heatmap indicating consistent upregulation of gene expression in stroke and PSD patients. (D). Heatmap indicating genes that are dysregulated in opposite directions in stroke and PSD patients. (E). Heatmap revealing the expression of depression-specific genes in PSD patients and stroke. (F). Paired scatterplot depicting the expression of genes in stroke and PSD patients.
FIGURE 2
FIGURE 2
Enrichment analysis of differentially expressed genes (DEGs) in stroke and PSD patients. (A). Biological processes: F2C represents the genes common to stroke and PSD; F2D represents genes that potentially mediate PSD based on excessive changes in expression during stroke recovery; F2E represents depression-specific genes. (B). GSEA. Panels (a,b) use common and specific genes associated with stroke and PSD patients as the preset gene set for GSEA. Panels (c,d) use depression-specific genes as the preset gene set for GSEA. (C). KEGG pathway: F2C represents the genes common to stroke and PSD; F2D represents genes that potentially mediate depression based on excessive changes in expression during stroke recovery; F2E represents depression-specific genes. (D). GSEA-KEGG pathway: the KEGG pathways were divided into four types according to the classification of intestinal flora, signaling pathways, brain disease, and metabolism (from left to right).
FIGURE 3
FIGURE 3
Identification of differential metabolites and dysregulated metabolic pathways in stroke patients. (A). Proportion of the identified metabolites in each chemical classification. (B). Volcano plot depicting differences in metabolites between stroke patients and controls. (C). Heatmap depicting the abundance of differential metabolites in stroke patients and controls. (D). Bubble-bar graph depicting the metabolic pathways associated with different metabolites. (E). KEGG metabolic network diagram. (F). Interaction network of differential metabolites (squares) and differentially expressed genes (circles). (G). KEGG global metabolic network highlighting the pathways possessing significant enrichment scores. (H). Pathway map diagram depicting depression-specific dysregulated genes (in green), genes common to stroke and depression (in red), depression-specific abnormal metabolites (in blue), and abnormal metabolites common to stroke and depression (in yellow).
FIGURE 4
FIGURE 4
Atlas of abnormal blood metabolism in patients with PSD. (A). Heatmap depicting abnormal metabolites common to stroke and PSD patients. (B). Paired scatterplot depicting continuous changes in total abnormal metabolites. (C). Box plot depicting abnormal metabolites that continue to increase during the process from control-stroke-PSD. (D). Box plot depicting abnormal metabolites associated with excessive recovery during the process from control-stroke-PSD. (E). Heatmap depicting differences in metabolites between stroke and post-stroke depression patients. (F). Metabolic pathway enrichment analysis. (G). Network diagram depicting genes (circles) and metabolites (squares). The size of the dot represents the degree value. (H). KEGG global metabolic network depicting differentially expressed genes and differential metabolites between PSD and stroke patients. Significant pathways are highlighted with a specific color. (I). Pathway map of “long-term depression”.
FIGURE 5
FIGURE 5
Ecological landscape of gut microbes in Control, stroke and PSD patients. (A). Histogram of relative abundances of species in each group and classification level. (B). Histogram of relative abundances of species in each grouping and classification level arranged as class, family, genus, order, phylum, and species from left to right and top to bottom. (C). Box plots of differences in α diversity index between groups (from left to right: alpha diversity, ace index, chao1, good_coverage, observed_species, PD_whole_tree, Shannon, and Simpson index). (D). Analysis of differences in β-diversity between groups based on weighted Unifrac distance. (E). Evolutionary clade diagram. (F). LDA core. (G). Relative abundances of biomarkers in each group of samples. (H). Results of STAMP analysis.
FIGURE 6
FIGURE 6
Intestinal microbes contribute to PSD depression with metabolic pathways. (A). Evolutionary clade diagram. Group B indicates stroke patients; group C indicates PSD patients. (B). Heatmap depicting the expression of common dysregulated microbes in healthy controls, stroke, and post-stroke depression patients. (C). Paired scatterplot depicting changes in the abundance of common dysregulated microbes in stroke and post-stroke depression patients. (D). Correlation between dysregulated microorganisms and dysregulated metabolites. (E). Global control network depicting differentially expressed genes (hexagons), metabolites (circles), microorganisms (squares), and pathways (diamonds). Note: Group B consists of stroke patients, and group C consists of PSD patients.

Similar articles

Cited by

References

    1. Alkasir R., Li J., Li X., Jin M., Zhu B. (2017). Human gut microbiota: The links with dementia development. Protein Cell 8 (2), 90–102. 10.1007/s13238-016-0338-6 - DOI - PMC - PubMed
    1. Antonell A., Lladó A., Sánchez-Valle R., Sanfeliu C., Casserras T., Rami L., et al. (2016). Altered blood gene expression of tumor-related genes (PRKCB, BECN1, and CDKN2A) in alzheimer's disease. Mol. Neurobiol. 53 (9), 5902–5911. 10.1007/s12035-015-9483-9 - DOI - PubMed
    1. Augustin K., Khabbush A., Williams S., Eaton S., Orford M., Cross J. H., et al. (2018). Mechanisms of action for the medium-chain triglyceride ketogenic diet in neurological and metabolic disorders. Lancet. Neurol. 17 (1), 84–93. 10.1016/S1474-4422(17)30408-8 - DOI - PubMed
    1. Boursin P., Paternotte S., Dercy B., Sabben C., Maïer B. (2018). Semantics, epidemiology and semiology of stroke. Soins. 63 (828), 24–27. 10.1016/j.soin.2018.06.008 - DOI - PubMed
    1. Byer L., Rutledge C., Wallender E., Osorio J. A., Jacobs R., Theodosopoulos P. V. (2017). Salmonella infection after craniotomy. Cureus 9 (8), e1566. 10.7759/cureus.1566 - DOI - PMC - PubMed

LinkOut - more resources