. 2022 Nov 23:9:986022.
doi: 10.3389/fmolb.2022.986022. eCollection 2022.

2-hydroxyisobutyric acid (2-HIBA) modulates ageing and fat deposition in Caenorhabditis elegans

Affiliations

2-hydroxyisobutyric acid (2-HIBA) modulates ageing and fat deposition in Caenorhabditis elegans

Emily Schifano et al. Front Mol Biosci. .

Abstract

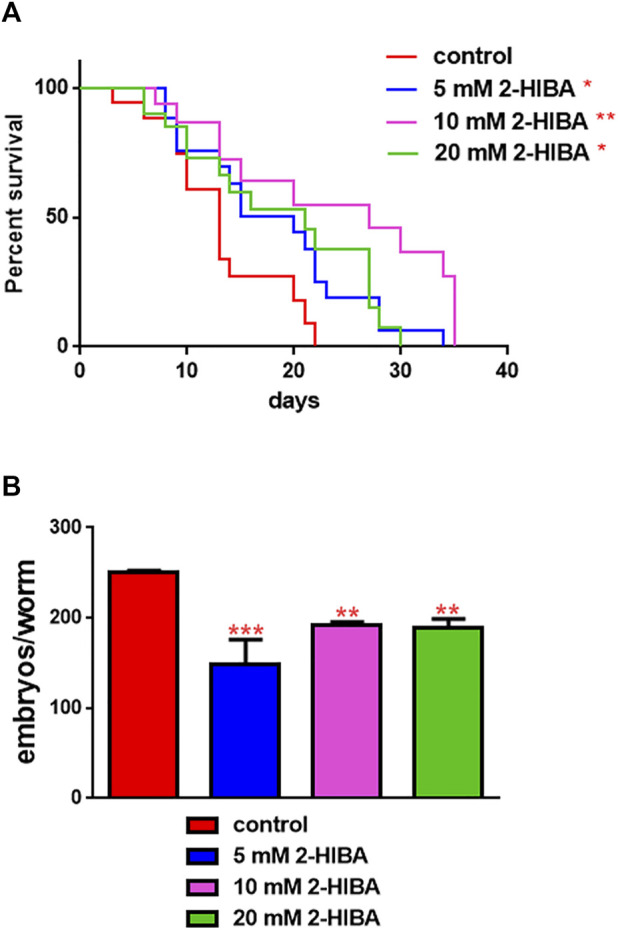
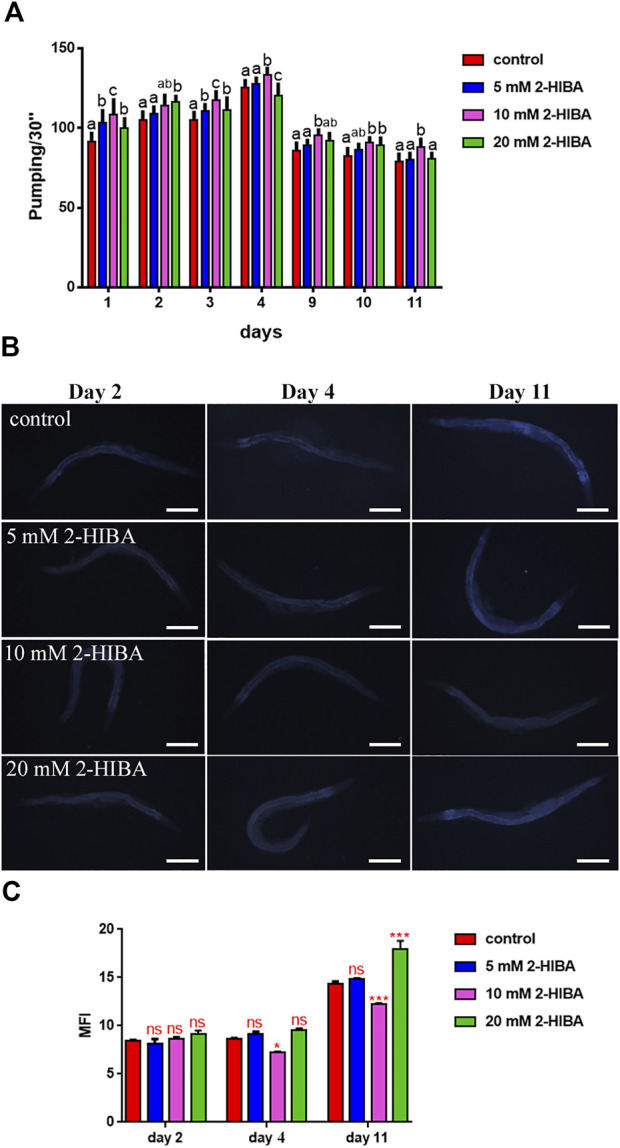
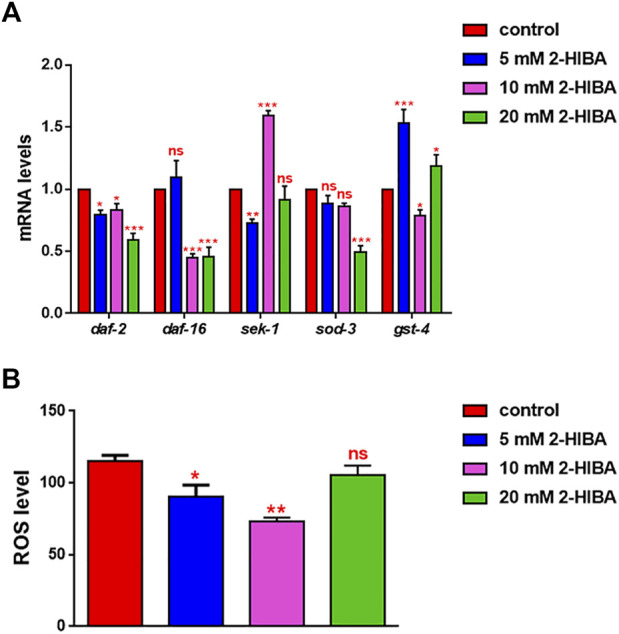
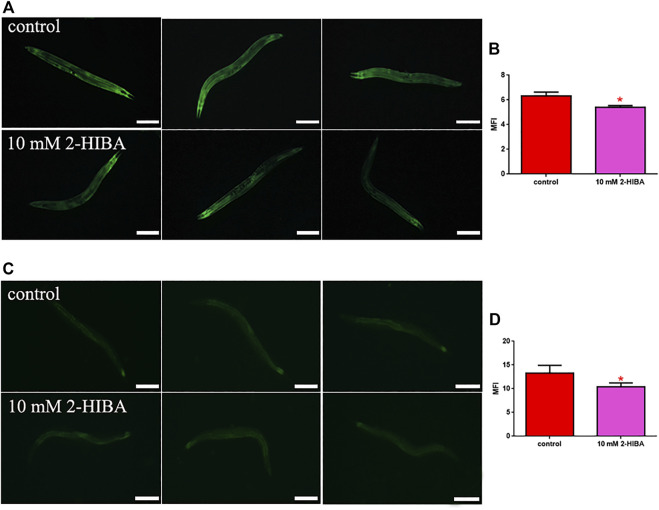
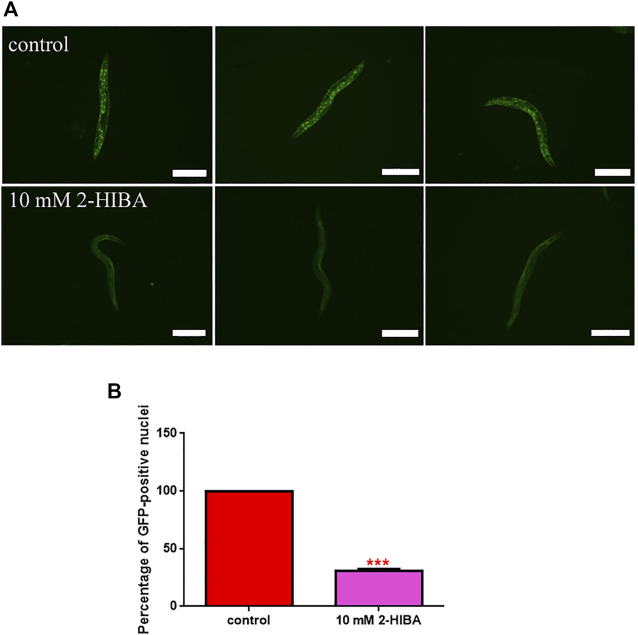
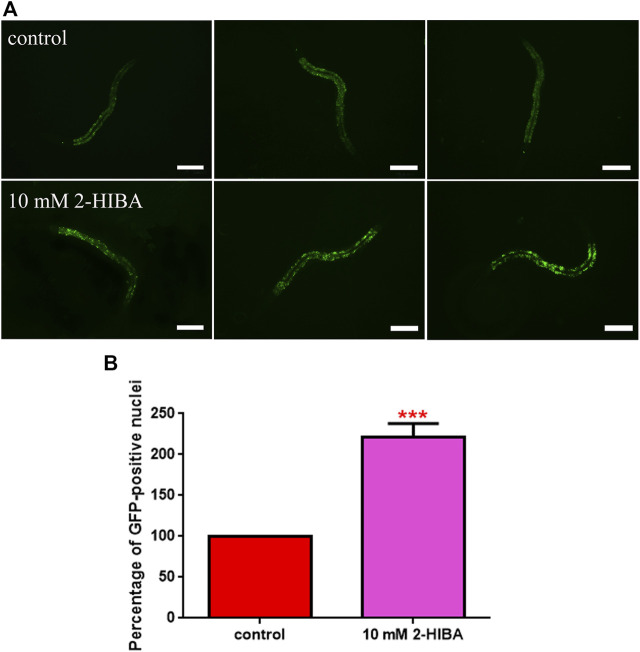
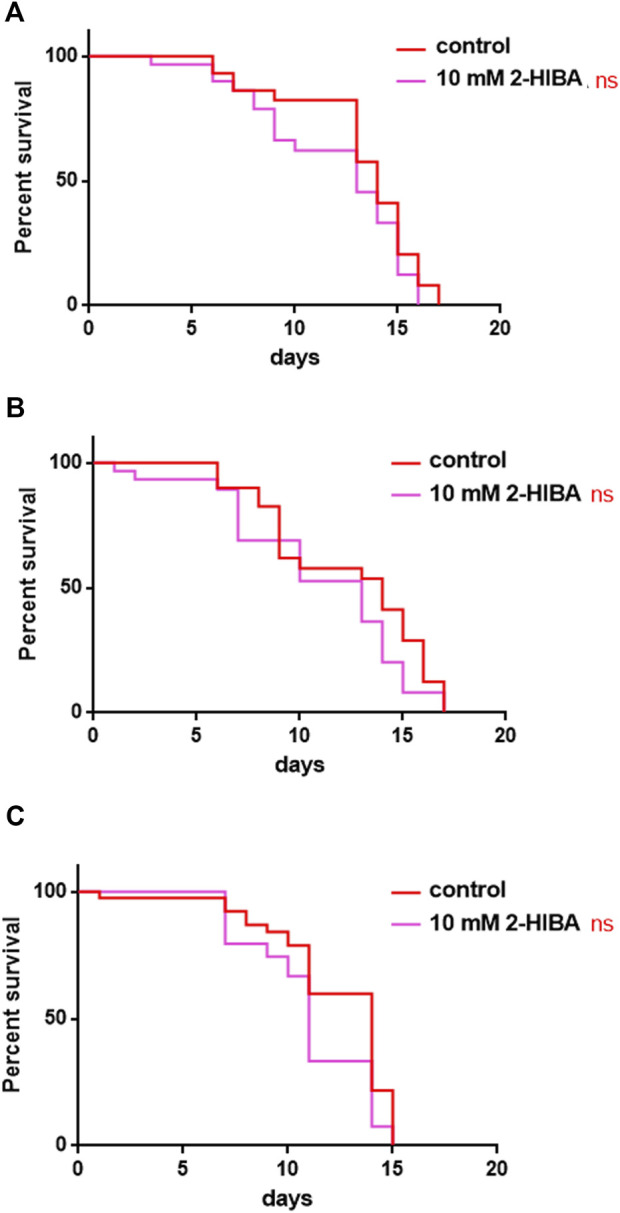
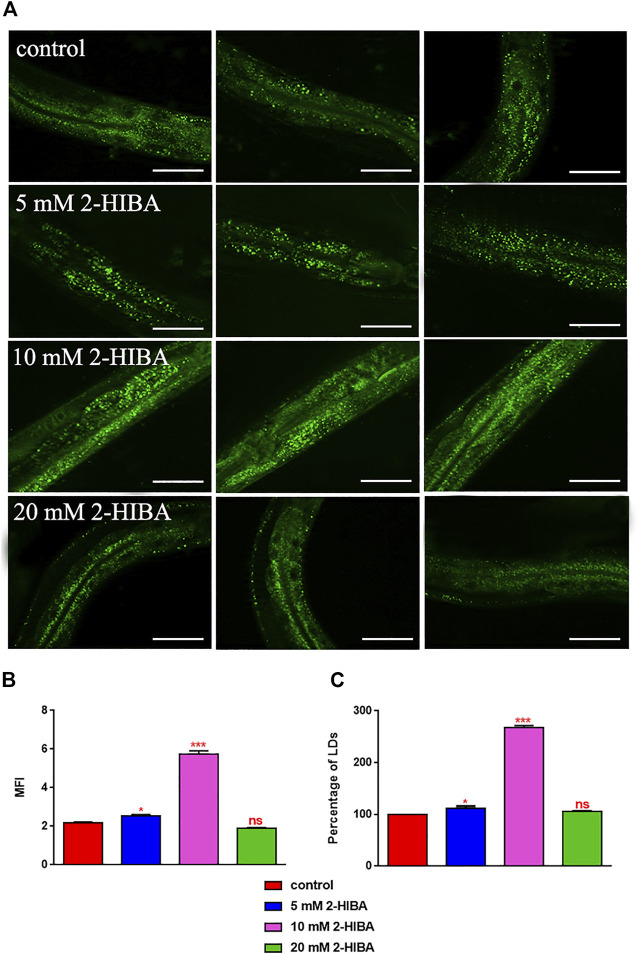
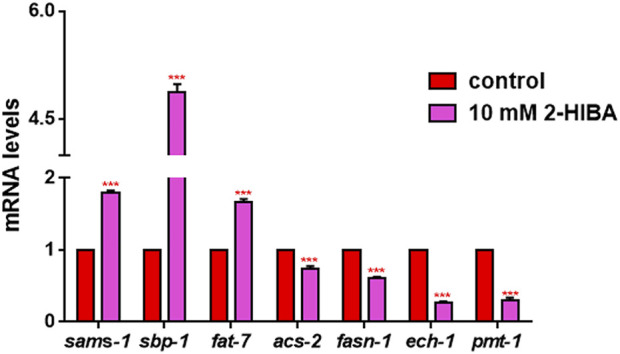
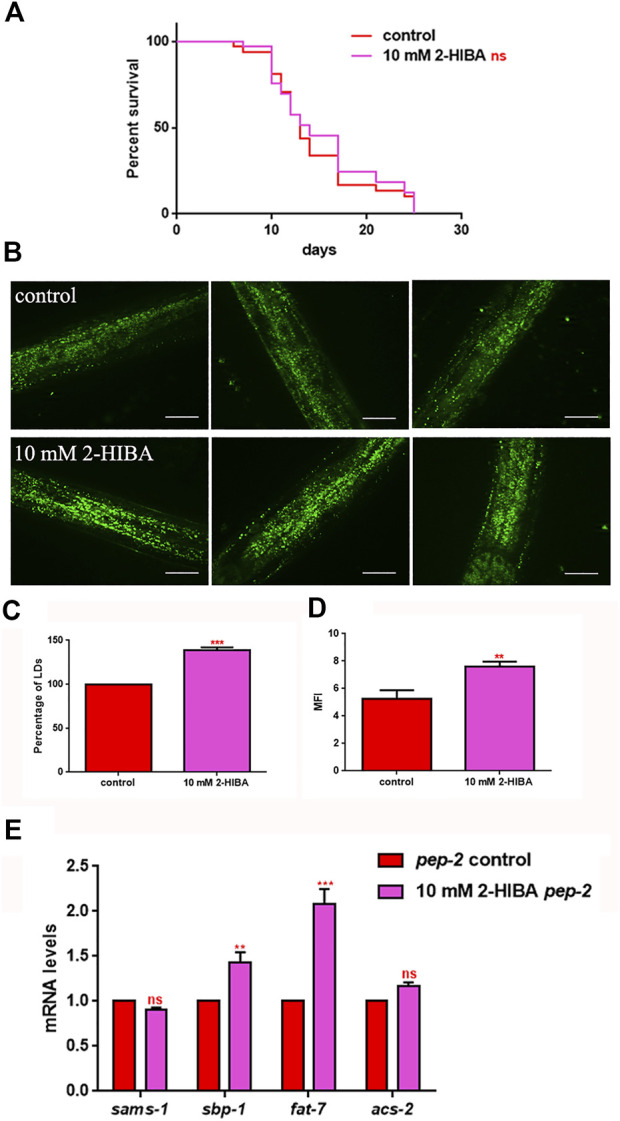
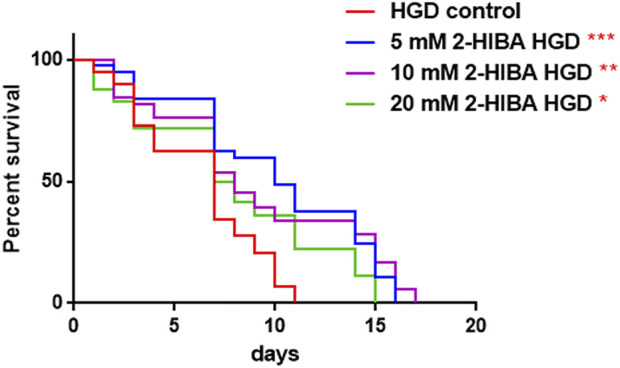
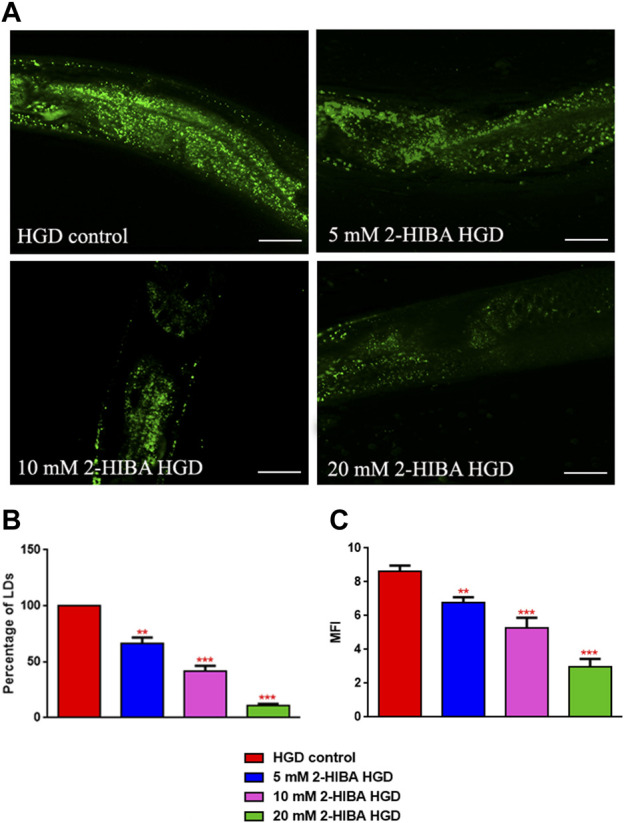
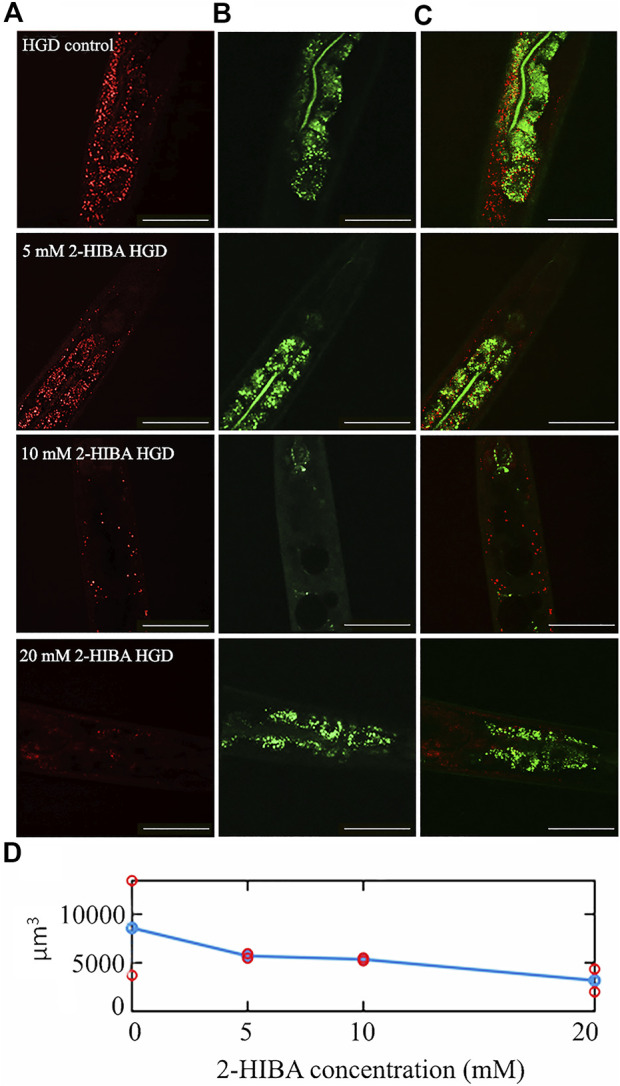
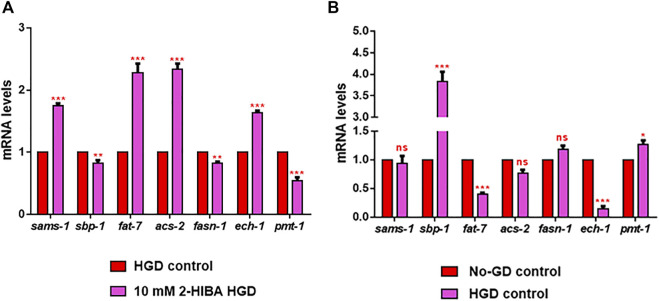
High levels of 2-hydroxyisobutyric acid (2-HIBA) were found in urines of patients with obesity and hepatic steatosis, suggesting a potential involvement of this metabolite in clinical conditions. The gut microbial origin of 2-HIBA was hypothesized, however its actual origin and role in biological processes are still not clear. We investigated how treatment with 2-HIBA affected the physiology of the model organism Caenorhabditis elegans, in both standard and high-glucose diet (HGD) growth conditions, by targeted transcriptomic and metabolomic analyses, Coherent Anti-Stokes Raman Scattering (CARS) and two-photon fluorescence microscopy. In standard conditions, 2-HIBA resulted particularly effective to extend the lifespan, delay ageing processes and stimulate the oxidative stress resistance in wild type nematodes through the activation of insulin/IGF-1 signaling (IIS) and p38 MAPK pathways and, consequently, through a reduction of ROS levels. Moreover, variations of lipid accumulation observed in treated worms correlated with transcriptional levels of fatty acid synthesis genes and with the involvement of peptide transporter PEP-2. In HGD conditions, the effect of 2-HIBA on C. elegans resulted in a reduction of the lipid droplets deposition, accordingly with an increase of acs-2 gene transcription, involved in β-oxidation processes. In addition, the pro-longevity effect appeared to be correlated to higher levels of tryptophan, which may play a role in restoring the decreased viability observed in the HGD untreated nematodes.

Keywords: 2-hydroxyisobutyric acid; CARS; Caenorhabditis elegans; ageing; high-glucose diet; lipid metabolism; metabolomics; oxidative stress.


Conflict of interest statement

The authors declare that the research was conducted in the absence of any commercial or financial relationships that could be construed as a potential conflict of interest.

Figures

FIGURE 1
FIGURE 1
Impact of 2-HIBA on worm viability and fertility. (A) Kaplan–Mèier survival plot of N2 worms fed with heat-killed OP50 and supplemented with 5, 10 or 20 mM 2-HIBA. n = 60 for each data point of single experiments (*p < 0.05, **p < 0.01). Lifespan assay was performed in triplicate and OP50-fed worms were taken as reference. (B) Average embryos production per worm of animals supplemented with different concentrations of 2-HIBA Bars represent the mean of three independent experiments; asterisks indicate the p-values (log-rank test) normalized to the control (**p < 0.01, ***p < 0.001).
FIGURE 2
FIGURE 2
Effect of 2-HIBA on C. elegans ageing. (A) Pumping rate of worms at different stages after 2-HIBA treatment from embryo hatching and measured for 30 s. Pharyngeal contractions were determined from the mean of 10 worms for each bacterial strain. Worms fed heat-killed OP50 without 2-HIBA supplementation were used as controls (control: untreated worms). Different letters indicate statistically significant differences (p < 0.05). (B) Fluorescence microscopy of auto-fluorescent lipofuscin granules in C. elegans supplemented with 10 mM 2-HIBA. (C) Mean Fluorescence Intensity related to lipofuscin accumulation. Ten worms were used for each measurement (**p < 0.01). Scale bar = 100 μm.
FIGURE 3
FIGURE 3
Impact of 2-HIBA on oxidative stress responses. (A) Expression of daf-2, daf-16, sek-1, sod-3 and gst-4 genes in N2 worms treated with 5, 10 or 20 mM 2-HIBA and in untreated nematodes at day 1 of adulthood. Histograms show the expression of genes involved in oxidative stress detected by real-time PCR. (B) Measurement of ROS levels in N2 supplemented with 2-HIBA compared to untreated control. Experiments were performed in triplicate. Data are presented as mean ± SD (*p < 0.05, **p < 0.01 and ***p < 0.001; ns: not significant).
FIGURE 4
FIGURE 4
Fluorescence microscopy of gst-4::GFP and sod-3::GFP transgenic strains. (A) Fluorescence microscopy of gst-4::GFP worm strain after supplementation of 10 mM 2-HIBA and (B) related MFI. (C) Fluorescence microscopy of sod-3::GFP worm strain after supplementation of 10 mM 2-HIBA and (D) related MFI. Scale bar = 100 μm control: untreated worms. Statistical analysis was evaluated by one-way ANOVA with the Bonferroni post-test; asterisks indicate significant differences (*p < 0.05). Bars represent the mean of three independent experiments.
FIGURE 5
FIGURE 5
Fluorescence analysis of daf-16::GFP transgenic strain. (A) Effect of 10 mM 2-HIBA treatment on localization of DAF-16 protein and (B) respective Mean Fluorescence Intensity evaluation. Data were obtained from three independent experiments (60 worms for each condition). Scale bar = 100 μm control: untreated nematodes. Statistical analysis was performed by one-way ANOVA with the Bonferroni post-test; asterisks indicate significant differences (***p < 0.001). Bars represent the mean of three independent experiments.
FIGURE 6
FIGURE 6
Fluorescence analysis of skn-1::GFP transgenic strain. (A) Effect of 10 mM 2-HIBA treatment on localization of SKN-1 transcriptional factor and (B) respective Mean Fluorescence Intensity evaluation. Scale bar = 100 μm. Data were obtained from three independent experiments (60 worms for each condition). control: untreated worms. Statistical analysis was performed by one-way ANOVA with the Bonferroni post-test; asterisks indicate significant differences (***p < 0.001). Bars represent the mean of three independent experiments.
FIGURE 7
FIGURE 7
Effect of 10 mM 2-HIBA on pmk-1, sek-1 and skn-1 mutant animals. (A) Kaplan-Meier survival plot of (A) pmk-1, (B) sek-1, (C) skn-1 mutant worms supplemented with 10 mM 2-HIBA. Lifespans of untreated worms (control) were taken as reference; n = 60 for each data point of single experiments (ns: not significant). The experiment was performed in triplicate.
FIGURE 8
FIGURE 8
Visualization of lipid droplets. (A) BODIPY staining of 1 day adult worms treated or not with 5 mM, 10 mM or 20 mM 2-HIBA (control: untreated worms). Scale bar = 50 μm. (B) Related Mean Fluorescence Intensity and (C) percentage of lipid droplets. Statistical analysis was evaluated by one-way ANOVA with the Bonferroni post-test; asterisks indicate significant differences (*p < 0.05, ***p < 0.001, ns: not significant). Bars represent the mean of three independent experiments.
FIGURE 9
FIGURE 9
Real time-qPCR analysis of lipid metabolism genes in wild-type worms. Expression of genes involved in fat metabolism in 1 day adults treated or not with 10 mM 2-HIBA (control: untreated). Histograms show the expression of genes involved in lipid metabolism detected by real-time PCR. Experiments were performed in triplicate. Data are presented as mean ± SD (***p < 0.001).
FIGURE 10
FIGURE 10
Lifespan analysis and fat accumulation in pep-2 mutants. (A) Kaplan-Meier survival plot of pep-2 mutant worms supplemented with 10 mM 2-HIBA. Lifespans of untreated worms were reported as controls; n = 60 for each data point of single experiments (ns: not significant). The assay was performed in triplicate. (B) BODIPY staining of 1 day adult pep-2 worms treated or not with 10 mM 2-HIBA. Scale bar = 50 μm. (C) Percentage of Lipid Droplets (LDs) and (D) Mean Fluorescence Intensity (MFI) of fat accumulation observed by BODIPY staining. Statistical analysis was evaluated by one-way ANOVA with the Bonferroni post-test; asterisks indicate significant differences (**p < 0.01, ***p < 0.001). Bars represent the mean of three independent experiments. (E) Expression of sams-1, sbp-1, fat-7, and acs-2 genes in 10 mM 2-HIBA-fed 1 day adults. Histograms show the transcript levels of genes involved in lipid metabolism in pep-2 mutants, supplemented with 10 mM 2-HIBA, as compared to untreated control. Experiments were performed in triplicate. Data are presented as mean ± SD (***p < 0.001, ns: not significant).
FIGURE 11
FIGURE 11
Effect of 2-HIBA on HGD wild-type worms (A) Kaplan–Mèier survival plot of HGD worms treated or not with 2-HIBA at different concentrations (control: untreated). n = 60 for each data point of single experiments. Bars represent the mean of three independent experiments. Asterisks indicate the p-values (log-rank test) with respect to the untreated control (*p < 0.05, **p < 0.01, ***p < 0.001).
FIGURE 12
FIGURE 12
Lipid droplets accumulate in HGD worms. (A) BODIPY staining and (B,C) lipid droplets quantification in 1 day adult worms grown in the presence of glucose and fed with E. coli OP50 alone (control) or supplemented with different 2-HIBA concentrations (**p < 0.01, ***p < 0.001). Scale bar = 50 μm.
FIGURE 13
FIGURE 13
CARS microscopy of HGD worms treated with 2-HIBA at different concentrations. (A) CARS signals of lipid droplets and (B) two-photon auto-fluorescence image in early intestine and hypodermal cells in 1 day adult HGD worms treated or not with different concentrations of 2-HIBA, collected in the same region though our two channel system. The combined image is reported in (C). The scale bar = 50 µm. (D) The lipid volume, detected in the CARS 3D stacks of images (two for each concentration), was reported by red circles, while the average was shown with blue circles.
FIGURE 14
FIGURE 14
RT-qPCR analysis of lipid metabolism genes in HGD worms. (A) Expression of sams-1, sbp-1, fat-7, acs-2, fasn-1, ech-1 and pmt-1 genes in 2-HIBA HGD 1-day adults, compared to HGD untreated nematodes. (B) Expression of lipid metabolism genes in untreated populations, grown with (HGD) or without (No-GD) glucose. Experiments were performed in triplicate. Data are presented as mean ± SD (*p < 0.05, **p < 0.01, ***p < 0.001, ns: not significant).

References

    1. Alcántar-Fernández J., González-Maciel A., Reynoso-Robles R., Pérez Andrade M. E., Hernández-Vázquez A. de J., Velázquez-Arellano A., et al. (2019). High-glucose diets induce mitochondrial dysfunction in Caenorhabditis elegans . PLoS ONE 14, e0226652. 10.1371/journal.pone.0226652 - DOI - PMC - PubMed
    1. Alcántar-Fernández J., Navarro R. E., Salazar-Martínez A. M., Pérez-Andrade M. E., Miranda-Ríos J. (2018). Caenorhabditis elegans respond to high-glucose diets through a network of stress-responsive transcription factors. PLoS ONE 13, e0199888. 10.1371/journal.pone.0199888 - DOI - PMC - PubMed
    1. Amin A. M. (2021). “Metabolomics applications in coronary artery disease personalized medicine,” in Advances in clinical Chemistry (Elsevier; ), 233–270. 10.1016/bs.acc.2020.08.003 - DOI - PubMed
    1. Arneth B., Arneth R., Shams M. (2019). Metabolomics of type 1 and type 2 diabetes. Int. J. Mol. Sci. 20, 2467. 10.3390/ijms20102467 - DOI - PMC - PubMed
    1. Baumeister R., Schaffitzel E., Hertweck M. (2006). Endocrine signaling in Caenorhabditis elegans controls stress response and longevity. J. Endocrinol. 190, 191–202. 10.1677/joe.1.06856 - DOI - PubMed