. 2022 Dec 1:10:1023539.
doi: 10.3389/fped.2022.1023539. eCollection 2022.

The criticality Index-mortality: A dynamic machine learning prediction algorithm for mortality prediction in children cared for in an ICU

Affiliations

The criticality Index-mortality: A dynamic machine learning prediction algorithm for mortality prediction in children cared for in an ICU

Anita K Patel et al. Front Pediatr. .

Abstract

Background: The Criticality Index-Mortality uses physiology, therapy, and intensity of care to compute mortality risk for pediatric ICU patients. If the frequency of mortality risk computations were increased to every 3 h with model performance that could improve the assessment of severity of illness, it could be utilized to monitor patients for significant mortality risk change.

Objectives: To assess the performance of a dynamic method of updating mortality risk every 3 h using the Criticality Index-Mortality methodology and identify variables that are significant contributors to mortality risk predictions.

Population: There were 8,399 pediatric ICU admissions with 312 (3.7%) deaths from January 1, 2018 to February 29, 2020. We randomly selected 75% of patients for training, 13% for validation, and 12% for testing.

Model: A neural network was trained to predict hospital survival or death during or following an ICU admission. Variables included age, gender, laboratory tests, vital signs, medications categories, and mechanical ventilation variables. The neural network was calibrated to mortality risk using nonparametric logistic regression.

Results: Discrimination assessed across all time periods found an AUROC of 0.851 (0.841-0.862) and an AUPRC was 0.443 (0.417-0.467). When assessed for performance every 3 h, the AUROCs had a minimum value of 0.778 (0.689-0.867) and a maximum value of 0.885 (0.841,0.862); the AUPRCs had a minimum value 0.148 (0.058-0.328) and a maximum value of 0.499 (0.229-0.769). The calibration plot had an intercept of 0.011, a slope of 0.956, and the R2 was 0.814. Comparison of observed vs. expected proportion of deaths revealed that 95.8% of the 543 risk intervals were not statistically significantly different. Construct validity assessed by death and survivor risk trajectories analyzed by mortality risk quartiles and 7 high and low risk diseases confirmed a priori clinical expectations about the trajectories of death and survivors.

Conclusions: The Criticality Index-Mortality computing mortality risk every 3 h for pediatric ICU patients has model performance that could enhance the clinical assessment of severity of illness. The overall Criticality Index-Mortality framework was effectively applied to develop an institutionally specific, and clinically relevant model for dynamic risk assessment of pediatric ICU patients.

Keywords: criticality index; dynamic outcome prediction; machine learning; mortality prediction; prediction algorithm.


Conflict of interest statement

The authors declare that the research was conducted in the absence of any commercial or financial relationships that could be construed as a potential conflict of interest.

Figures
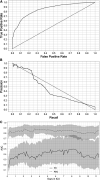
Figure 1
Figure 1
Area under the receiver operating characteristic (AUROC) curves (A), area under the precision recall (AUPRC) curves (B), and AUROC and AUPRC computed every 3 h. Outcomes were survival and death. (A) The AUROC for all time periods through 11.4 days. (B) The AUPRC for all time periods through 11.4 days. (C) AUROC and AUPRC calculated every 3 h through 11.4 days. The shaded regions are pointwise 95% confidence intervals. We applied boost strap techniques to the test set with 5,000 stratified bootstrap replicates to compute the confidence intervals.
Figure 2
Figure 2
Calibration plot for the criticality Index-mortality (CI-M) model. The dashed line is the line of identity and the solid line is the regression line. A statistical test for differences of proportion was computed for each dot in the calibration plot. Each dot is associated with two proportions in a risk interval: 1) observed proportion of ICU mortality (observed count of deaths/total sample), and 2) expected proportion of ICU mortality (predicted count of deaths/total sample). The expected proportion is computed using the risk predictions from the model to predict the count of deaths, the observed proportion is an empirical count of the risk of mortality among the cases in each risk interval. The Santner and Snell test were computed to assess the significance of the different proportions. The dot is grey if the test results in a p-value < 0.05.
Figure 3
Figure 3
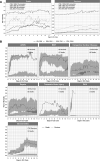
Trajectories for deaths and survivors by risk quartiles (A), and trajectories for deaths and survivors by diagnostic groups (B). (A) Death and survivor risk trajectories. Risk was computed with the Criticality Index-Mortality (CI-M). Median risk for each quartile for survivors and deaths used CI-M predictions. Patients were stratified using the first risk prediction at 3 h. The shaded areas are 95% confidence intervals (CIs). The trajectories were constructed from the total sample with 314 deaths and 8,087 survivors. (B) Death and survivor risk trajectories for different conditions. Risk was computed with the CI-M predictions and displayed for deaths and survivors. The numbers of survivors and deaths are shown in each panel. ARDS = Acute Respiratory Distress Syndrome (ARDS), BMT = Bone Marrow Transplants, DKA = Diabetic Ketoacidosis (DKA).
Figure 4
Figure 4
Variable importance for the Criticality Index-Mortality (CI-M) model. Percentages of the most frequently important covariates determined by the LIME methodology. MV = mechanical ventilation, d/c = discontinued, max = maximum, avg = average, min = minimum, prop = proportion, resp = respiratory, chol = cholinergic, stim = stimulants.

References

    1. Pollack MM, Patel KM, Ruttimann UE. PRISM III: an updated pediatric risk of mortality score. Crit Care Med. (1996) 24:743–52. 10.1097/00003246-199605000-00004 - DOI - PubMed
    1. Straney L, Clements A, Parslow RC, Pearson G, Shann F, Alexander J, et al. Paediatric index of mortality 3: an updated model for predicting mortality in pediatric intensive care*. Pediatr Crit Care Med. (2013) 14:673–81. 10.1097/PCC.0B013E31829760CF - DOI - PubMed
    1. Sauthier M, Landry-Hould F, Leteurtre S, Kawaguchi A, Emeriaud G, Jouvet P. Comparison of the automated pediatric logistic organ dysfunction-2 versus manual pediatric logistic organ dysfunction-2 score for critically ill children. Pediatr Crit Care Med. (2020) 21:E160–9. 10.1097/PCC.0000000000002235 - DOI - PubMed
    1. Vincent JL, Opal SM, Marshall JC. Ten reasons why we should NOT use severity scores as entry criteria for clinical trials or in our treatment decisions. Crit Care Med. (2010) 38:283–7. 10.1097/CCM.0B013E3181B785A2 - DOI - PubMed
    1. Booth FV, Short M, Shorr AF, Arkins N, Bates B, Qualy RL, et al. Application of a population-based severity scoring system to individual patients results in frequent misclassification. Crit Care. (2005) 9:R522. 10.1186/CC3790 - DOI - PMC - PubMed

LinkOut - more resources