. 2023 Jan 11;51(1):117-143.
doi: 10.1093/nar/gkac1159.

HP1 proteins regulate nucleolar structure and function by secluding pericentromeric constitutive heterochromatin

Affiliations

HP1 proteins regulate nucleolar structure and function by secluding pericentromeric constitutive heterochromatin

Daniel Ballmer et al. Nucleic Acids Res. .

Abstract

Nucleoli are nuclear compartments regulating ribosome biogenesis and cell growth. In embryonic stem cells (ESCs), nucleoli containing transcriptionally active ribosomal genes are spatially separated from pericentromeric satellite repeat sequences packaged in largely repressed constitutive heterochromatin (PCH). To date, mechanisms underlying such nuclear partitioning and the physiological relevance thereof are unknown. Here we show that repressive chromatin at PCH ensures structural integrity and function of nucleoli during cell cycle progression. Loss of heterochromatin proteins HP1α and HP1β causes deformation of PCH, with reduced H3K9 trimethylation (H3K9me3) and HP1γ levels, absence of H4K20me3 and upregulated major satellites expression. Spatially, derepressed PCH aberrantly associates with nucleoli accumulating severe morphological defects during S/G2 cell cycle progression. Hp1α/β deficiency reduces cell proliferation, ribosomal RNA biosynthesis and mobility of Nucleophosmin, a major nucleolar component. Nucleolar integrity and function require HP1α/β proteins to be recruited to H3K9me3-marked PCH and their ability to dimerize. Correspondingly, ESCs deficient for both Suv39h1/2 H3K9 HMTs display similar nucleolar defects. In contrast, Suv4-20h1/2 mutant ESCs lacking H4K20me3 at PCH do not. Suv39h1/2 and Hp1α/β deficiency-induced nucleolar defects are reminiscent of those defining human ribosomopathy disorders. Our results reveal a novel role for SUV39H/HP1-marked repressive constitutive heterochromatin in regulating integrity, function and physiology of nucleoli.


Figures

Figure 1.
Figure 1.
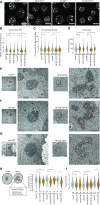
Morphological alterations to nuclei and nucleoli in Hp1α/β deficient ESCs. (A) Representative DAPI staining of nuclei from control, Hp1β-KO and Hp1α/β-DKO ESCs. Scale bars = 10 μm. (B–D) Violin plots showing the area of chromocenters (B), number of chromocenters (C) and the area of nuclei (D) based on the DAPI staining of cells for the indicated genotypes. (E) Representative transmission electron micrographs showing nuclear and nucleolar morphology of a control (Hp1βF/F) and constitutive Hp1β-KO ESC clone number 2. Scale bars = 2 μm. Nucleoli have been highlighted in higher magnification panels. (F) Representative transmission electron micrographs showing nuclear and nucleolar morphology of a control (Hp1αF/F; Hp1βF/F) and constitutive Hp1α/β-DKO ESC clone number 1. Scale bars = 2 μm. Nucleoli have been highlighted in higher magnification panels. (G) Representative transmission electron micrographs showing nuclear and nucleolar morphology of a control and a conditional Hp1α/β-cDKO ESC (Hp1αF/F; Hp1βF/F; Cre-ERT2 ESCs after 4 days of mock EtOH or 4-OHT treatment, respectively). Scale bars = 2 μm. Nucleoli have been highlighted in higher magnification panels. (H) Left panel: Schematic representation depicting measurement of nucleolus solidity, which is computed as the ratio of the area of a nucleolus to the area of its convex hull. Right panel: violin plots showing the quantification of nucleolar solidity for the indicated genotypes. (I) Violin plots showing the quantification of nucleoli number per nucleus for the indicated genotypes. Sample sizes are indicated below each violin. * P < 0.05, ** P ≤ 0.01, *** P ≤ 0.001 (Mann–Whitney U).
Figure 2.
Figure 2.
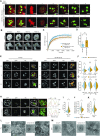
Cell cycle dynamics and structural organization of nucleoli in control and Hp1α/β deficient ESCs. (A) Representative live imaging of GFP-NPM1 and H2B-mCherry transfected control (Hp1αF/F; Hp1βF/F) and Hp1α/β-DKO ESCs. Maximum projection of multiple confocal z-stacks is shown. Time is presented relative to the frame when the metaphase plate is observed. Scale bars = 5 μm. (B) Representative fluorescence microscopy images at indicated timepoints during FRAP of GFP-NPM1 within a region of interest in a control (HP1αF/F; HP1βF/F) and Hp1α/β-DKO ESC nucleolus. Scale bars = 5 μm. (C) Normalized and averaged FRAP curves, corrected for photobleaching, for GFP-NPM1 within control and Hp1α/β-DKO ESC nucleoli. The exponential fits used to calculate t1/2 are shown in black. (D) Bar plots representing the GFP-NPM1 immobile fraction extracted from FRAP curves shown in (C). (E) Representative IF staining against NPM1 and FBL in G1, S and G2 of control (Hp1αF/F; Hp1βF/F) and Hp1α/β-DKO ESCs. DNA was stained with DAPI. Central slices of confocal z-stacks are shown. Scale bars = 5 μm. (F) Violin plots showing the quantification of nucleolar volume in G1, S and G2 of control (Hp1αF/F; Hp1βF/F) and Hp1α/β-DKO ESCs from (E). (G) Violin plots showing the quantification of nucleolar solidity in G1, S and G2 of control (Hp1αF/F; Hp1βF/F) and Hp1α/β-DKO ESCs from (E). (H) Left panels: Representative IF staining against UBF and FBL. Scale bars = 5 μm. Right panels: Line scans depict co-localization of UBF1 (red) and FBL (green) signals. DNA was stained with DAPI. (I) Violin plot showing the quantification of UBF1 foci inside the 3D segmented nucleolus of control (Hp1αF/F; Hp1βF/F) and Hp1α/β-DKO ESCs from (H). (J) Violin plot showing the distance of UBF1 foci from the segmented nucleolus periphery of control (Hp1αF/F; Hp1βF/F) and Hp1α/β-DKO ESCs from (H). (K) Violin plots showing the fluorescence intensity ratio of FBL to UBF1 at the segmented UBF1 foci inside the 3D segmented nucleolus of control (Hp1αF/F; Hp1βF/F) and Hp1α/β-DKO ESCs from (H). (L) Representative anti-FBL (FBL) immuno-TEM micrographs in a control (Hp1αF/F; Hp1βF/F) and an Hp1α/β-DKO ESC. Dark puncta in the zoomed in panels represent the immune-reactive sites. (M) Representative anti-UBF1 immuno-TEM micrographs highlighting FC organization and localization in a control (Hp1αF/F; Hp1βF/F) and an Hp1α/β-DKO ESC. Dark puncta in the zoomed in panels represent the immune-reactive sites. Scale bars = 2 μm. Sample sizes are indicated below each violin. * P < 0.05, ** P ≤ 0.01, *** P ≤ 0.001 (Mann–Whitney U test).
Figure 3.
Figure 3.
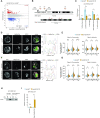
Aberrant associations between nucleoli and pericentromeric heterochromatin in Hp1α/β deficient ESCs. (A) Representative nucleoli live imaging of GFP-NPM1 and H2B-mCherry transfected control (Hp1αF/F; Hp1βF/F) and Hp1α/β-DKO ESCs. Single central slices of confocal z-stacks are shown. Time is presented relative to the frame when the metaphase plate is observed. Arrow heads indicate chromatin (H2B-mCherry bright puncta) associations with nucleolus (GFP-NPM1 positive regions). Scale bars = 5 μm. (B, C) Violin plots showing the quantification of intra-nucleolar DAPI (B) and chromocenter-nucleolus intersection (C) in G1, S and G2 of control (Hp1αF/F; Hp1βF/F) and Hp1α/β-DKO ESCs from (Figure 2E and Supplementary Figure S4A). (D) Left panels: Representative IF staining against NPM1 and H3K9me3 of control (Hp1αF/F; Hp1βF/F) and Hp1α/β-DKO ESCs in S phase. DNA was stained with DAPI. Central slices of confocal z-stacks are shown. Scale bars = 5 μm. Right panels: Line scans indicate (co)localization between DAPI (blue), NPM1 (red) and H3K9me3 (green) signals. (E) Violin plots showing the quantification of intra-nucleolar H3K9me3 in G1, S and G2 of control (Hp1αF/F; Hp1βF/F) and Hp1α/β-DKO ESCs (from D). (F) Representative anti-H3K9me3 Immuno-TEM micrographs highlighting aberrant chromocenter-nucleolus associations in a control (Hp1αF/F; Hp1βF/F) and an Hp1α/β-DKO ESC. Nucleoli edges have been highlighted in the zoomed in panels. Dark puncta represent the H3K9me3 immune-reactive sites and arrow indicates H3K9me3-positive material invading the nucleolus. Scale bars = 2 μm. (G) Violin plots showing the quantification of chromocenter-nucleolus contacts (left panel) and the intra-nucleolar H3K9me3 particles in control (Hp1αF/F; Hp1βF/F) and Hp1α/β-DKO ESCs (from F). Sample sizes are indicated below each violin. * P < 0.05, ** P ≤ 0.01, *** P ≤ 0.001 (Mann–Whitney U-test).
Figure 4.
Figure 4.
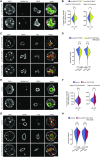
1,6-Hexanediol treatment phenocopies the nucleolar defects seen upon Hp1α/β deficiency. (A) Left panels: Representative IF staining against NPM1 and FBL of control JM8 ESCs treated with PBS, 0.5% or 2% 1,6-hexanediol (in PBS) for 2.5 min prior to fixation. Central slices of confocal z-stacks are shown. Right panels: Line scans indicate (co)localization between DAPI (blue), NPM1 (red) and FBL (green) signals. All scale bars = 5 μm. (B) Violin plots showing the quantification of DAPI (left), NPM1(middle) and FBL (right) signal intensities inside nucleoli (upper), at PCH (middle) or in the nucleoplasm (lower) (normalized to total nuclear signal intensities, respectively) in control JM8 ESCs treated with PBS or 1,6-hexanediol as described in (A). (C) Violin plots showing the quantification of nucleolar solidity in G1, S and G2 of control (Hp1αF/F; Hp1βF/F) ESCs treated with PBS or 2% 1,6-hexanediol for 5 min prior to fixation. Based on IF staining against NPM1 and FBL. (D) Violin plots showing the z-score normalized intensities of HP1β at PCH in control (Hp1αF/F; Hp1βF/F) and Hp1α/β-DKO ESCs treated with PBS or 2% 1,6-hexanediol for 5 min prior to fixation. (E) Violin plots showing the quantification of nucleolar solidity in G1, S and G2 of Hp1α/β-DKO ESCs treated with PBS or 2% 1,6-hexanediol for 5 min prior to fixation. Based on IF staining against NPM1 and FBL. (F, G) Left panels: Representative IF staining against NPM1 and H3K9me3 (F) or H3K4me3 (G) of control (Hp1αF/F; Hp1βF/F) and Hp1α/β-DKO ESCs treated with PBS or 2% 1,6-hexanediol for 5 min prior to fixation. DNA was stained with DAPI. Central slices of confocal z-stacks are shown. Scale bars = 5 μm. Middle panels: Line scans indicate (co)localization between DAPI (blue), NPM1 (red) and H3K9me3 (F) or H3K4me3 (G) (green) signals. Right panel: Violin plots showing the quantification of intra-nucleolar H3K9me3 (F) or H3K4me3 (G) in control (Hp1αF/F; Hp1βF/F) and Hp1α/β-DKO ESCs upon treatment with PBS or 2% 1,6-hexanediol for 5 min prior to fixation. Sample sizes are indicated below each violin. * P < 0.05, ** P ≤ 0.01, *** P ≤ 0.001 (Mann–Whitney U-test).
Figure 5.
Figure 5.
Major satellite transcripts accumulate in aberrant nucleoli in Hp1α/β deficient ESCs. (A) MA plot (B) representing differential gene expression analysis of Hp1α/β-DKO versus control ESCs. Numerical data is available in Supplementary Table S1. (B) Schematic representation of a mouse rDNA repeat (upper) and major satellite repeats (lower) with highlighted positions of the primers used for ChIP-qPCR. (C) Bar plot representing H3K9me3 ChIP-qPCR analysis of the fold enrichment (mean and standard deviation, n = 3) of designated rDNA loci depicted in the Figure 6D along with major satellite DNA as a positive control and beta-actin promoter as a negative control, isolated from a-H3K9me3 ChIP relative to an IgG ChIP control. * P < 0.05, ** P ≤ 0.01, *** P ≤ 0.001 (two-sided, unpaired t-test). (D) Representative RNA-FISH detecting reverse major satellite repeat transcripts coupled to IF staining against NPM1 in control (Hp1αF/F; Hp1βF/F) and Hp1α/β-DKO ESCs. DNA was stained with DAPI. Central slices of confocal z-stacks are shown. Scale bars = 5 μm. Line scans indicate (co)localization between DAPI (blue), major satellite repeat RNA (red) and NPM1 (green) signals. (E) Violin plots showing the absolute levels of fluorescence intensity of reverse major satellite repeat RNA-FISH signal at chromocenters (left) and nucleolus (right) in control (Hp1αF/F; Hp1βF/F) and Hp1α/β-DKO ESCs (from D). (F) Representative RNA-FISH detecting forward major satellite repeat transcripts coupled to IF staining against NPM1 in control (Hp1αF/F; Hp1βF/F) and Hp1α/β-DKO ESCs. DNA was stained with DAPI. Central slices of confocal z-stacks are shown. Scale bars = 5 μm. Line scans indicate (co)localization between DAPI (blue), major satellite repeat RNA (red) and NPM1 (green) signals. (G) Violin plots showing the absolute levels of fluorescence intensity of forward major satellite repeat RNA-FISH signal at chromocenters (left) and nucleolus (right) in control (Hp1αF/F; Hp1βF/F) and Hp1α/β-DKO ESCs (from F). Sample sizes for (E) and (G) are indicated below each violin. * P < 0.05, ** P ≤ 0.01, *** P ≤ 0.001 (Mann–Whitney U-test). (H) Immunoblots for GFP-NPM1 input and immunoprecipitated fractions from transiently transfected control (Hp1αF/F; Hp1βF/F) and Hp1α/β-DKO ESCs. (I) Bars plots representing RT-qPCR analysis of the fold enrichment (mean and standard deviation, n = 3 (three RNA extractions from two independent transfections for each biological sample)) of 18S rRNA and major satellite RNA isolated by anti-GFP-NPM1 RIP relative the control RIP after normalization to the respective input. GFP-NPM1 or control GFP were transfected into control (Hp1αF/F; Hp1βF/F) and Hp1α/β-DKO ESCs. * P < 0.05, ** P ≤ 0.01, *** P ≤ 0.001 (two-sided, unpaired t-test).
Figure 6.
Figure 6.
Restoring nucleolar defects in Hp1α/β deficient ESCs. (A) Schematic representation of truncated or point mutated HP1α and HP1β constructs. All constructs carry an N-terminal 3xMyc-tag. Synopsis of the features of the constructs in terms of predicted dimerization, PxVxL interaction, PCH localization, and rescue of nucleolar defects. (B) Left panels: Representative IF staining against HP1β and Myc for detection of subnuclear localization of HP1β constructs shown in (A) transfected into Hp1α/β-DKO ESCs. Central slices of confocal z-stacks are shown. Scale bars, 5 μm. Right panels: Line scans indicate (co)localization between chromocenters (DAPI- bright, blue) and HP1β construct (anti-HP1β in red; anti-Myc in green). Note that different anti-HP1β antibodies were used for detection of truncated constructs (see Materials & Methods). (C, D) Violin plots showing the quantification of nucleolar solidity (C) and intra-nucleolar DAPI (D) in control (Hp1αF/F; Hp1βF/F) and Hp1α/β-DKO ESCs (in S phase) upon transient transfection with full-length HP1αWT or HP1βWT. Based on IF staining against NPM1 and FBL. (E) Violin plots showing the quantification of z-score normalized intensities of indicated HP1β point mutants transfected into Hp1α/β-DKO ESCs from (B) at PCH. (F) Violin plots showing the quantification of nucleolar solidity (upper panel) and intra-nucleolar DAPI (lower panel) in Hp1α/β-DKO ESCs (in S phase) upon transient transfection with indicated truncated or point mutated HP1β constructs. Based on IF staining against NPM1, FBL and DAPI. Sample sizes are indicated below each violin. * P < 0.05, ** P ≤ 0.01, *** P ≤ 0.001 (Mann–Whitney U-test).
Figure 7.
Figure 7.
Nucleoli morphology in control, Suv39h1/2 double null and Suv4-20h1/2 double null ESCs. (A) Representative RNA-FISH detecting forward major satellite repeat transcripts coupled to IF staining against NPM1 in control and Suv39h1/2 dn ESCs in S phase. DNA was stained with DAPI. Central slices of confocal z-stacks are shown. Scale bars = 5 μm. (B) Violin plots showing the absolute levels of fluorescence intensity of forward major satellite repeat RNA-FISH signal at chromocenters (left) and nucleolus (right) in control and Suv39h1/2 dn ESCs (from A). (C) Representative IF staining against NPM1 and FBL in S phase of control and two Suv39h1/2 dn ESCs. DNA was stained with DAPI. Central slices of confocal z-stacks are shown. Scale bars = 5 μm. (D) Violin plots showing the quantification of nucleolar solidity in S phase of control and two Suv39h1/2 dn ESCs from (C). (E) Representative RNA-FISH detecting forward major satellite repeat transcripts coupled to IF staining against NPM1 in control and Suv4-20h1/2 dn ESCs in S phase. DNA was stained with DAPI. Central slices of confocal z-stacks are shown. Scale bars = 5 μm. (F) Violin plots showing the the absolute levels of fluorescence intensity of forward major satellite repeat RNA-FISH signal at chromocenters (left) and nucleolus (right) in control and Suv4-20h1/2 dn ESCs (from E). (G) Representative IF staining against NPM1 and FBL in S phase of control and two Suv4-20h1/2 dn ESCs. DNA was stained with DAPI. Central slices of confocal z-stacks are shown. Scale bars = 5 μm. (H) Violin plots showing the quantification of nucleolar solidity in S phase of control and two Suv4-20h1/2 dn ESCs from (G). Sample sizes for B, D, F, G are indicated below each violin. * P < 0.05, ** P ≤ 0.01, *** P ≤ 0.001 (Mann–Whitney U-test).
Figure 8.
Figure 8.
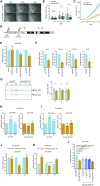
Cellular proliferation and rRNA expression are reduced in Hp1α/β deficient ESCs. (A) Brightfield microscopy images of Hp1αF/F; Hp1βF/F; Cre-ERT2 ESCs colonies upon treatment with 1μM 4-OHT or EtOH for the indicated time periods. Scale bars = 100 μm. (B) Bar plots showing the quantification of Hp1α/β-cDKO ESC colony sizes (relative to Day 2). (C) Cell counts of Hp1αF/F; Hp1βF/F; Cre-ERT2 ESCs upon treatment with 1 μM 4-OHT or EtOH for the indicated time periods. Data are presented as the mean ± SEM (n = 3). (D) Schematic representation of a mouse rDNA repeat with highlighted positions of the primers used for RT-qPCR. (E) Bar plots showing the quantification of RT-qPCR for 28S rRNA in Hp1β-KO, Hp1α/β-DKO (at passage 15) and Hp1α/β-cDKO (after 4 days of 4-OHT treatment) compared to their corresponding controls (n = 3). Data were normalized to b-actin mRNA. (F) Bar plots showing the quantification of RT-qPCR for 5′ ETS, ITS2 and IGS rRNA in Hp1α/β-cDKO ESCs (after 4 days of 4-OHT treatment) compared to control (mock treated with EtOH) (n = 3). Data were normalized to b-actin mRNA. (G) Bar plots (right) showing the ratio from the quantification of band intensities for 18S and 28S rRNA in G1, S and G2 of control and Hp1α/β-DKO ESCs obtained by automated RNA electrophoresis (left) with Agilent 2100 Bioanalyzer (n = 3). Data were normalized to total RNA area. (H) Quantification of RT-qPCR for 28S rRNA in G1, S and G2 of control and Hp1α/β-cDKO ESCs (Hp1αF/F; Hp1βF/F; Cre-ERT2 ESCs after 4 days of mock EtOH or 4-OHT treatment, respectively) (n = 3). Data were normalized to b-actin mRNA and were compared to G1 for each genotype. (I) Quantification of RT-qPCR for 28S rRNA in G1, S and G2 of control (Hp1αF/F; Hp1βF/F) and Hp1α/β-DKO ESCs (n = 3). Data were normalized to b-actin mRNA and were compared to G1 for each genotype. (J) Quantification of RT-qPCR for 28S rRNA in G1, S and G2 of control and Hp1α/β-cDKO ESCs (Hp1αF/F; Hp1βF/F; Cre-ERT2 ESCs after 4 days of mock EtOH or 4-OHT treatment, respectively) (n = 3). Data were normalized to b-actin mRNA and were compared to control 28S levels at the corresponding cell cycle phase. (K) Quantification of RT-qPCR for 28S rRNA in G1, S and G2 of control (Hp1αF/F; Hp1βF/F) and constitutive Hp1α/β-DKO ESCs (passage > 20) (n = 3). Data were normalized to b-actin mRNA and were compared to control 28S levels at the corresponding cell cycle phase. (L) Quantification of RT-qPCR for 28S rRNA in Hp1α/β-DKO ESCs (at passage 15) transfected with indicated HP1β point mutants (n = 3). Data were normalized to b-actin mRNA. * P < 0.05, ** P ≤ 0.01, *** P ≤ 0.001 (two-sided, unpaired t-test).

References

    1. Azkanaz M., López A.R., de Boer B., Huiting W., Angrand P.O., Vellenga E., Kampinga H.H., Bergink S., Martens J.H.A., Schuringa J.J.et al.. Protein quality control in the nucleolus safeguards recovery of epigenetic regulators after heat shock. Elife. 2019; 8:e45205. - PMC - PubMed
    1. Boulon S., Westman B.J., Hutten S., Boisvert F.M., Lamond A.I.. The Nucleolus under Stress. Mol. Cell. 2010; 40:216–227. - PMC - PubMed
    1. Frottin F., Schueder F., Tiwary S., Gupta R., Körner R., Schlichthaerle T., Cox J., Jungmann R., Hartl F.U., Hipp M.S.. The nucleolus functions as a phase-separated protein quality control compartment. Science. 2019; 365:342–347. - PubMed
    1. James A., Wang Y., Raje H., Rosby R., DiMario P.. Nucleolar stress with and without p53. Nucleus. 2014; 5:402–426. - PMC - PubMed
    1. Pfister A.S. Emerging role of the nucleolar stress response in autophagy. Front. Cell. Neurosci. 2019; 13:156. - PMC - PubMed

Publication types