. 2023 Feb;601(3):567-606.
doi: 10.1113/JP283700. Epub 2023 Jan 10.

Adaptive exhaustion during prolonged intermittent hypoxia causes dysregulated skeletal muscle protein homeostasis

Affiliations

Adaptive exhaustion during prolonged intermittent hypoxia causes dysregulated skeletal muscle protein homeostasis

Amy H Attaway et al. J Physiol. 2023 Feb.

Abstract

Nocturnal hypoxaemia, which is common in chronic obstructive pulmonary disease (COPD) patients, is associated with skeletal muscle loss or sarcopenia, which contributes to adverse clinical outcomes. In COPD, we have defined this as prolonged intermittent hypoxia (PIH) because the duration of hypoxia in skeletal muscle occurs through the duration of sleep followed by normoxia during the day, in contrast to recurrent brief hypoxic episodes during obstructive sleep apnoea (OSA). Adaptive cellular responses to PIH are not known. Responses to PIH induced by three cycles of 8 h hypoxia followed by 16 h normoxia were compared to those during chronic hypoxia (CH) or normoxia for 72 h in murine C2C12 and human inducible pluripotent stem cell-derived differentiated myotubes. RNA sequencing followed by downstream analyses were complemented by experimental validation of responses that included both unique and shared perturbations in ribosomal and mitochondrial function during PIH and CH. A sarcopenic phenotype characterized by decreased myotube diameter and protein synthesis, and increased phosphorylation of eIF2α (Ser51) by eIF2α kinase, and of GCN-2 (general controlled non-derepressed-2), occurred during both PIH and CH. Mitochondrial oxidative dysfunction, disrupted supercomplex assembly, lower activity of Complexes I, III, IV and V, and reduced intermediary metabolite concentrations occurred during PIH and CH. Decreased mitochondrial fission occurred during CH. Physiological relevance was established in skeletal muscle of mice with COPD that had increased phosphorylation of eIF2α, lower protein synthesis and mitochondrial oxidative dysfunction. Molecular and metabolic responses with PIH suggest an adaptive exhaustion with failure to restore homeostasis during normoxia. KEY POINTS: Sarcopenia or skeletal muscle loss is one of the most frequent complications that contributes to mortality and morbidity in patients with chronic obstructive pulmonary disease (COPD). Unlike chronic hypoxia, prolonged intermittent hypoxia is a frequent, underappreciated and clinically relevant model of hypoxia in patients with COPD. We developed a novel, in vitro myotube model of prolonged intermittent hypoxia with molecular and metabolic perturbations, mitochondrial oxidative dysfunction, and consequent sarcopenic phenotype. In vivo studies in skeletal muscle from a mouse model of COPD shared responses with our myotube model, establishing the pathophysiological relevance of our studies. These data lay the foundation for translational studies in human COPD to target prolonged, nocturnal hypoxaemia to prevent sarcopenia in these patients.

Keywords: RNA sequencing; intermediary metabolites; mitochondrial oxidation; prolonged intermittent hypoxia; unbiased data.


Conflict of interest statement

Competing interests. All authors disclose that they have no competing interests in accordance with journal policy.

No other conflicts of interest

Figures

Figure 1.
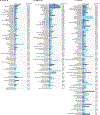
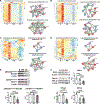
Figure 1.. Global transcriptomics analyses and differentially expressed genes during hypoxia.
All studies performed in differentiated murine C2C12 myotubes during normoxia (N), prolonged intermittent hypoxia (PIH with 3 cycles of 8h hypoxia/16h normoxia) or chronic hypoxia (CH) over 72 h. A. Heat map of differentially expressed genes (DEGs) from RNAseq in myotubes treated with PIH, CH, or N. Significance for DEGs was set at p<0.001. B. Venn diagrams showing unique and shared DEGs during PIH vs. CH, PIH vs. N, and CH vs. N; downregulated/upregulated DEGs in PIH and CH (vs. N); significance for DEGs was set at p<0.0001. C. Significantly enriched canonical pathways (-log[p value]≥1.3) in RNAseq from myotubes during PIH vs. N, CH vs. N, and PIH vs. CH. Number of genes in the pathway and the -log[p-value] are shown in parentheses to the right of each pathway. D. Heat map comparing enriched pathways in PIH and CH (vs. N). E. Representative immunoblots and densitometry of hypoxia-inducible factors (HIF1α and HIF2α) in response to PIH and CH, β-galactosidase activity with N, PIH or CH (100 mM of ceramide [Cer] as a positive control); representative immunoblots and densitometry of phosphorylated p53. Models used for the HIF1α and HIF2α expression in these immunoblots were reversed (16h normoxia/8h hypoxia) to demonstrate the level of HIF1α and HIF2α at the end of a hypoxic cycle. Full uncropped blots are provided in Supplementary Figure 2. F. Heat maps and STRING network analyses of HIF1α and HIF2α targets demonstrate associations with HIF signaling pathways and all genes on RNAseq analysis regardless of significance. All RNAseq and immunoblots were performed in 3 biological replicates per group. Exact p values are stated in the figure and in the Statistical Summary Table.
Figure 2.
Figure 2.. Pathway enrichment in RNA sequencing in myotubes during hypoxia.
RNA sequencing performed in differentiated murine C2C12 myotubes during normoxia (N), prolonged intermittent hypoxia (PIH with 3 cycles of 8h hypoxia/16h normoxia) or chronic hypoxia (CH) over 72 h. Stacked bar chart of canonical pathways enriched in differentially expressed genes (DEGs) in RNA sequencing. A. PIH vs. N; B. PIH vs. CH, and C. CH vs. N. Number of genes in the pathway and the -log[p-value] are shown in parentheses to the right of each pathway. Significance for DEGs was set at p<0.0001.
Figure 3.
Figure 3.. Feature selected heatmaps of RNA sequencing during hypoxia.
RNA sequencing was performed in differentiated murine C2C12 myotubes during normoxia (N), prolonged intermittent hypoxia (PIH with 3 cycles of 8h hypoxia/16h normoxia) or chronic hypoxia (CH) over 72 h. Feature selected heatmaps of differentially expressed genes (DEGs) were generated for: A. Hedgehog signaling, B. Myogenesis genes, C. Notch genes, D. Transforming growth factor (TGF) β genes, E. WNT β-Catenin genes, F. Phosphoinositide-3-kinase (PI3K)-Akt-mTOR signaling, and G. Protein secretion genes. Significance for DEGs was set at p<0.001.
Figure 4.
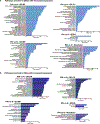
Figure 4.. Analyses of RNA sequencing in myotubes during hypoxia using multiple functional enrichment databases.
RNA sequencing was performed in differentiated murine C2C12 myotubes during normoxia (N), prolonged intermittent hypoxia (PIH with 3 cycles of 8h hypoxia/16h normoxia) or chronic hypoxia (CH) over 72 h. Manhattan plots were generated using g:Profiler integrating multiple pathway analyses including GO:MF (molecular function), GO (gene ontology):BP (biological process), GO:CC (cellular component), Kyoto Encyclopedia of Genes and Genomes (KEGG), REACTOME (database focused on biologic processes, intermediary metabolism, signal transduction of cell cycle), TF (putative transcription factor binding sites), miRNA (micro RNA targets), CORUM (comprehensive resource of mammalian protein complexes), HP (Human disease Phenotype), and WP (Wiki Pathways). Functional enrichment in differentially expressed genes (DEGs) with decreased or increased expression during: A, B. PIH vs. N; C,D. CH vs N; E,F. PIH vs CH. Significance for DEGs was set at p<0.001.
Figure 5.
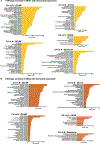
Figure 5.. Enriched processes in RNA sequencing from myotubes during prolonged intermittent hypoxia.
RNA sequencing performed in differentiated murine C2C12 myotubes during normoxia (N) and prolonged intermittent hypoxia (PIH with 3 cycles of 8h hypoxia/16h normoxia). Pathways enriched in: A, B. Differentially expressed genes (DEGs) with decreased or increased expression in PIH vs. N using GO (gene ontology):BP (biological process), GO:CC (cellular component), GO:MF (molecular function), Kyoto Encyclopedia of Genes and Genomes (KEGG) and REACTOME (database focused on biologic processes, intermediary metabolism, signal transduction of cell cycle). All experiments were done in n=3 biological replicates. Significance for DEGs was set at p<0.05 (Student’s t-test with Benjamini-Hotchberg correction).
Figure 6.
Figure 6.. Enriched processes in RNA sequencing from myotubes during chronic hypoxia.
RNA sequencing performed in differentiated murine C2C12 myotubes during normoxia (N) and chronic hypoxia (CH) over 72 h. Pathways enriched in: A, B. Differentially expressed genes (DEGs) with decreased or increased expression in CH vs. N using GO (gene ontology):BP (biological process), GO:CC (cellular component), GO:MF (molecular function), Kyoto Encyclopedia of Genes and Genomes (KEGG) and REACTOME (database focused on biologic processes, intermediary metabolism, signal transduction of cell cycle). All experiments were done in n=3 biological replicates. Significance for DEGs was set at p<0.05 (Student’s t-test with Benjamini-Hotchberg correction).
Figure 7.
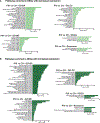
Figure 7.. Enriched processes in RNA sequencing from myotubes during hypoxia.
RNA sequencing performed in differentiated murine C2C12 myotubes during prolonged intermittent hypoxia (PIH with 3 cycles of 8h hypoxia/16h normoxia) and chronic hypoxia (CH) over 72 h. Pathways enriched in: A, B. Differentially expressed genes (DEGs) with decreased or increased expression in PIH vs. CH using GO (gene ontology):BP (biological process), GO:CC (cellular component), GO:MF (molecular function), Kyoto Encyclopedia of Genes and Genomes (KEGG) and REACTOME (database focused on biologic processes, intermediary metabolism, signal transduction of cell cycle). All experiments were done in n=3 biological replicates. Significance for DEGs was set at p<0.05 (Student’s t-test with Benjamini-Hotchberg correction).
Figure 8.
Figure 8.. Sarcopenic phenotype in murine myotubes during hypoxia.
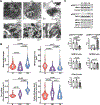
All studies performed in differentiated murine C2C12 myotubes during normoxia (N), prolonged intermittent hypoxia (PIH with 3 cycles of 8h hypoxia/16h normoxia unless specified) or chronic hypoxia (CH) over 72 h. A. Feature extracted heat map and STRING network analyses of differentially expressed genes (DEGs) in the mTORC1 pathway on RNA sequencing from myotubes. Significance for DEGs was set at p<0.001. n=3 biological replicates in each group. B. Representative photomicrographs of differentiated myotubes during N, two models of PIH (3 cycles of hypoxia/normoxia 4h/20h or 8h/16h) or CH for 72 h. Scale bar is 100 μm. Myotube diameter of differentiated murine C2C12 myotubes exposed to N, 2 models of PIH (3 cycles of hypoxia/normoxia 4h/20h or 8h/16h) or CH for 72 h. All data mean±SD from 80 myotubes in 4 fields for each biologic replicate (n=3). C. Percent cell viability as determined by resazurin assay and trypan blue assay are presented for N, 2 models of PIH (3 cycles of hypoxia/normoxia 4h/20h or 8h/16h) or CH for 72 h. All data are mean±SD of percentage of N (control). n=6 per group. D. Representative immunoblots and densitometry of phosphorylation of eIF2αSer51, mTORC1Ser2448, P70S6 KinaseThr389 with N, PIH or CH. Cells were harvested at the end of a normoxic cycle. n=3 biological replicates in each group. Full uncropped blots are provided in Supplementary Figure 2. E. PP2A activity in myotubes with N, PIH (8h/16h) and CH. n=6 biologic replicates for each group. Exact p values are stated in the figure and in the Statistical Summary Table.
Figure 9.
Figure 9.. Prolonged intermittent hypoxia results in a sarcopenic phenotype in human inducible pluripotent stem cell derived skeletal myotubes.
All studies performed in differentiated murine C2C12 myotubes during normoxia (N), prolonged intermittent hypoxia (PIH with 3 cycles of 8h hypoxia/16h normoxia unless specified) or chronic hypoxia (CH) over 72 h. A. Representative photomicrographs and diameter of differentiated myotubes. Scale bar is 100 μm. All data are mean±SD of percentage of N (control) from at least 80 myotubes in 4 fields from each biological replicate (n=3). B. Representative immunoblots and densitometry of phospho-eIF2αSer51, phospho-mTORC1Ser2448, phospho-P70S6KThr389, phospho-RiboS6Ser240/244. All immunoblots were performed in 3 biological replicates per group. Full uncropped blots are provided in Supplementary Figure 2. Exact p values are stated in the figure and in the Statistical Summary Table.
Figure 10.
Figure 10.. Cellular stress response during hypoxia in myotubes.
All studies performed in differentiated murine C2C12 myotubes during normoxia (N), prolonged intermittent hypoxia (PIH with 3 cycles of 8h hypoxia/16h normoxia) or chronic hypoxia (CH) over 72 h unless specified. A. Representative immunoblots of puromycin incorporation. B. Feature extracted heat map and STRING network analyses of differentially expressed genes (DEGs) in the unfolded protein response (UPR) pathway on RNA sequencing in myotubes. Significance for DEGs set at p<0.001. n=3 biological replicates in each group. C. Representative immunoblots for PERK for mobility shift in response to N, PIH, CH. Thapsigargin (TG) treatment was used as a positive control. TG3 = Thapsigargin (10mM) for 3 h, TG6 = Thapsigargin (10mM) for 6 h. Ponceau stain of membrane as loading control. D. Representative immunoblots and densitometry of phosphorylation of GCN2Thr899. E. Representative immunoblots and densitometry of phosphorylated eIF2αSer51 from murine myotubes transfected with shRandom (shRan) or shGCN2−/− during N, PIH or CH. F. Representative immunoblots and densitometry from GCN2−/− and wild type mouse embryonic fibroblasts (MEFs). Full uncropped blots are provided in Supplementary Figure 2. All immunoblots were performed in 3 biological replicates per group. Exact p values are stated in the figure and in the Statistical Summary Table.
Figure 11.
Figure 11.. Prolonged intermittent hypoxia causes perturbations in ribosomal biosynthesis as determined by transcriptomic analysis.
All studies performed in differentiated murine C2C12 myotubes during normoxia (N), prolonged intermittent hypoxia (PIH with 3 cycles of 8h hypoxia/16h normoxia) or chronic hypoxia (CH) over 72 h unless specified. Feature extracted heat map and STRING network analyses of differentially expressed genes (DEGs) in the cytosolic and mitochondrial ribosome genes on RNA sequencing in myotubes. Significance for DEGs set at p<0.001. n=3 biological replicates in each group. A. Small ribosomal cytosolic genes, B. Large ribosomal cytosolic genes, C. Small ribosomal mitochondrial genes, D. Large ribosomal mitochondrial genes. E. Representative immunoblots and densitometry of phosphorylated ribosomal S6 protein (RiboS6)Ser240/244 and 4E-BP1Thr37/45 in murine myotubes during N, PIH, and CH. F. Representative immunoblots and densitometry of ribosomal proteins RPL5, RPL23, and RPL32. Full uncropped blots are provided in Supplementary Figure 2. All immunoblots were performed in 3 biological replicates per group. Exact p values are stated in the figure and in the Statistical Summary Table.
Figure 12.
Figure 12.. Mitochondrial and intermediary metabolite regulatory genes.
Feature extracted heat maps and overlay of oxidative phosphorylation pathway with differentially expressed genes (DEGs) from RNA sequencing in differentiated murine C2C12 myotubes treated with PIH (8h/16h), CH, or normoxia (N) for 72 h. A. Mitochondrial genes (MitoCarta3.0). B. Glycolysis genes. C. Oxidative phosphorylation (OxPhos) genes. D-F. Overlay maps of oxidative phosphorylation pathway. Significance for DEGs set at p<0.001.
Figure 13.
Figure 13.. Mitochondrial oxygen consumption in intact and permeabilized myotubes.
All studies performed in differentiated murine C2C12 myotubes during normoxia (N), prolonged intermittent hypoxia (PIH with 3 cycles of 8h hypoxia/16h normoxia) or chronic hypoxia (CH) over 72 h unless specified. A. Representative tracings of mitochondrial oxygen consumption (“oxygraphs”) in intact myotubes during normoxia and prolonged intermittent hypoxia. B. Representative tracings of mitochondrial oxygen consumption in digitonin permeabilized myotubes in response to substrates, inhibitors and uncoupler. O oligomycin; U uncoupler or FCCP carbonyl cyanide p-(trifluoromethoxy) phenylhydrazone (FCCP); R rotenone; Aa antimycin A; M malate; P pyruvate; Digi digitonin; D ADP; G glutamate; S succinate, TMPD N,N,N′,N′-tetramethyl-p-phenylenediamine; Asc ascorbate; Az azide. C. High sensitivity respirofluorometry-based mitochondrial oxidative responses to inhibitors of components of the ETC in intact myotubes during normoxia and PIH (n=6 per group). D. Mitochondrial oxidative responses to substrates, uncoupler and inhibitors in permeabilized myotubes (n=6 per group). E. Measures of fatty acid oxidation and oxygen consumption were quantified in response to palmitoyl-carnitine. A reduced analogue of co-enzyme Q (duroquinol or DHQ), which is a complex III substrate, was added to assess complex III activity. M malate; P pyruvate; D ADP, S succinate, G glutamate, Rot rotenone, RR reserve respiratory capacity; Max R maximum respiration (n=6 per group). F. Representative immunoblots and densitometry of citrate synthase (CS) and voltage dependent anion channel (VDAC) protein expression. Full uncropped blots are provided in Supplementary Figure 2. All immunoblots were performed in 3 biological replicates per group. *p values represent ANOVA. Exact p values are stated in the figure and in the Statistical Summary Table.
Figure 14.
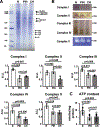
Figure 14.. Electron transport chain supercomplex assembly and component activity during hypoxia.
All studies performed in differentiated murine C2C12 myotubes during normoxia (N), prolonged intermittent hypoxia (PIH with 3 cycles of 8h hypoxia/16h normoxia) or chronic hypoxia (CH) over 72 h. A. Blue native gel electrophoresis of isolated mitochondrial proteins for electron transport chain (ETC) supercomplexes. B. Representative gel images and densitometry of in gel activity for complexes I, II, III, IV, and V. All experiments in n=3 per group. Full uncropped blots are provided in Supplementary Figure 2. C. ATP content in myotubes during normoxia, PIH, and CH. n=9 per group. Exact p values are stated in the figure and in the Statistical Summary Table.
Figure 15.
Figure 15.. Mitochondrial free radicals and oxidative modifications in myotubes.
All studies performed in differentiated murine C2C12 myotubes during normoxia (N), prolonged intermittent hypoxia (PIH with 3 cycles of 8h hypoxia/16h normoxia) or chronic hypoxia (CH) over 72 h. A,B. Feature extracted heat maps and STRING network analyses of differentially expressed genes (DEGs) from RNA sequencing in myotubes for free radical (reactive oxygen species; ROS) and antioxidant genes. Significance for DEGs was set at p<0.001. n=3 biological replicates in each group. C. Representative flow cytometry images and percentage fluorescence intensity using the fluorescent probe MitoSOX to quantify mitochondrial free radicals. (n = 3/experimental group). D. Fluorescent intensity of 2’−7’dichlorofluorescein (DCF) as a measure of total cellular free radicals generated (n=9 per group). E. 8-hydroxyguanosine levels (n=3 per group). F. Representative immunoblots and densitometry of cellular carbonylated proteins. G. Concentrations of thiobarbituric acid reactive substances (TBARS) (n=6 per group). All immunoblots were performed in 3 biological replicates per group. Full uncropped blots are provided in Supplementary Figure 2. Exact p values are stated in the figure and in the Statistical Summary Table.
Figure 16.
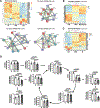
Figure 16.. Changes in intermediary metabolites during hypoxia.
All studies performed in differentiated murine C2C12 myotubes during normoxia (N), prolonged intermittent hypoxia (PIH with 3 cycles of 8h hypoxia/16h normoxia) or chronic hypoxia (CH) over 72 h. A. Feature extracted heat map and STRING network analyses of differentially expressed genes (DEGs) in the tricarboxylic acid (TCA) cycle on RNA sequencing in myotubes. B. Unsupervised heatmaps of all DEGs on RNA sequencing in myotubes. Significance for DEGs set at p<0.001. C. Unsupervised feature extracted heatmap of DEGs in the TCA cycle from RNA sequencing in myotubes. Significance for DEGs set at p<0.001. D. Cellular concentrations of TCA cycle intermediates and amino acids in myotubes during normoxia, PIH and CH (measured at 72 h; n=6 biological replicates per group). RNA sequencing done in 3 biological replicates for each group. DEGs for heat map set at p<0.001. *p values represent ANOVA. Exact p values are stated in the figure and in the Statistical Summary Table.
Figure 17.
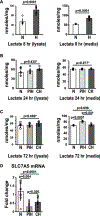
Figure 17.. Lactate concentrations and amino acid exchanger expression in myotubes.
Studies performed in differentiated murine C2C12 myotubes during normoxia (N), prolonged intermittent hypoxia (PIH with cycles of 8h hypoxia/16h normoxia) or chronic hypoxia (CH). A. Lactate concentrations in the myotube lysate and culture medium comparing normoxia and 8 hours of hypoxia (n=6 biological replicates per group). B. Lactate concentrations in the myotube lysate and culture medium during normoxia (N), PIH and CH for 24 hours (1 cycle; n=6 per group). C. Lactate concentrations in the myotube lysate and culture medium comparing normoxia (N), PIH and CH for 72 hours (3 cycles; n=6 per group). All data mean±SD from 6 biological replicates. D. Relative expression (fold change) of SLC7A5 mRNA by real-time PCR (n=9 biological replicates per group). *p values represent ANOVA. Exact p values are stated in the figure and in the Statistical Summary Table.
Figure 18.
Figure 18.. Altered mitochondrial network and morphology during hypoxia.
Studies performed in differentiated murine C2C12 myotubes during normoxia (N), prolonged intermittent hypoxia (PIH with 3 cycles of 8h hypoxia/16h normoxia) or chronic hypoxia (CH) over 72 h A. Representative immunofluorescence photomicrographs of myotubes stained with MitoTracker orange®. Scale bar 10 μm. N shows intermediate morphology, PIH shows fragmented morphology, and CH shows fused morphology. B. Mitochondrial morphology was scored within each cell (n=40) per group as either fused, tubular, fragmented, or an intermediate state. All data mean±SD from at least 3 biological replicates.
Figure 19.
Figure 19.. Perturbed myotube mitochondrial ultrastructure during hypoxia.
All studies performed in differentiated murine C2C12 myotubes during normoxia (N), prolonged intermittent hypoxia (PIH with 3 cycles of 8h hypoxia/16h normoxia) or chronic hypoxia (CH) over 72 h. A. Representative electron microscopy images. B. Mitochondrial length (μm; n=80 per group), mitochondrial area (μm2, n=80 per group), the number of cristae per mitochondrial area (cristae per μm2, n=20 per group), and cristae thickness per mitochondrial area (nm/μm2, n=20 per group) were quantified using ImageJ software. C. Representative immunoblots and densitometry for phosphorylated DRP1Ser616, phosphorylated DRP1Ser637, total Mfn1, Mfn2, and Opa1. Densitometry shows mean±SD from 3 biological replicates per group. Full uncropped blots are provided in Supplementary Figure 2. *p values represent ANOVA. Exact p values are stated in the figure and in the Statistical Summary Table.
Figure 20.
Figure 20.. Murine model of emphysema with a sarcopenic phenotype reproduces molecular and metabolic perturbations of hypoxia.
All studies performed in 10-week old female C57/Bl6J mice with weekly pulmonary instillation of phosphate buffered saline (PBS) or porcine elastase (to generate emphysema/chronic obstructive pulmonary disease) for 3 weeks and euthanized at 16wk age. A. Representative photomicrographs of hematoxylin-eosin stained lung sections. Mean linear intercept quantified as described in the Methods (n=20 per group). Mouse oximetry measured every minute for 5 minutes and averaged for each mouse (n=6 per mouse). M1 = paired PBS and Elastase mouse (Group 1), M2 = paired PBS and Elastase mouse (Group 2), M3 = paired PBS and Elastase mouse (Group 3). B. Representative immunoblots and densitometry of puromycin incorporation in gastrocnemius skeletal muscle. C. Representative immunoblots and densitometry of phosphorylated eIF2αSer51, phosphorylated P70S6 kinaseThr389, Hif1α and Hif2α in gastrocnemius muscle. All immunoblots were performed in 6 mice per group. For the Hif1α immunoblot, there are two positive controls: CH = chronic hypoxia C2C12 cellular lysate, and Cob = Cobalt treated C2C12 myotube lysate as positive control for HIF expression. D. Mitochondrial respiration in permeabilized gastrocnemius muscle. M malate; P pyruvate; D ADP, S succinate, G glutamate, Rot rotenone, RR reserve respiratory capacity; Max R maximum respiration. Mean ± SD from 6 mice per group. Full uncropped blots are provided in Supplementary Figure 2. Exact p values are stated in the figure and in the Statistical Summary Table.
Figure 21.
Figure 21.. Quality control measures for RNA-Seq data.
All studies performed in differentiated murine C2C12 myotubes during normoxia (N), prolonged intermittent hypoxia (PIH with 3 cycles of 8h hypoxia/16h normoxia) or chronic hypoxia (CH) over 72 h. A. Correlation plots between PIH vs Normoxia, PIH vs CH, and Normoxia vs CH. B. Dispersion estimates comparing PIH vs Normoxia, CH vs Normoxia, PIH vs CH. Dispersion estimates plot the expected dispersion value of the gene based on the mean expression level and the maximum likelihood estimation (MLE) of the dispersion. C. MA plots comparing M (log ratio) and A (mean average) between PIH vs Normoxia, CH vs Normoxia, and PIH vs CH. D. Volcano plots (-log[p-value] vs. log2 fold change) of genes from RNA sequencing for PIH vs. N, CH vs N, and PIH vs CH. E. Principal component analysis (PCA) plots comparing biologic replicates of PIH vs N, PIH vs CH, and CH versus N.

Comment in

References

    1. Abramov AY, Scorziello A & Duchen MR. (2007). Three Distinct Mechanisms Generate Oxygen Free Radicals in Neurons and Contribute to Cell Death during Anoxia and Reoxygenation. The Journal of Neuroscience 27, 1129–1138. - PMC - PubMed
    1. Akinbiyi EO, Abramowitz LK, Bauer BL, Stoll MSK, Hoppel CL, Hsiao CP, Hanover JA & Mears JA. (2021). Blocked O-GlcNAc cycling alters mitochondrial morphology, function, and mass. Sci Rep 11, 22106. - PMC - PubMed
    1. Arighi CN, Drabkin H, Christie KR, Ross KE & Natale DA. (2017). Tutorial on Protein Ontology Resources. Methods Mol Biol 1558, 57–78. - PMC - PubMed
    1. Bakare AB, Daniel J, Stabach J, Rojas A, Bell A, Henry B & Iyer S. (2021). Quantifying Mitochondrial Dynamics in Patient Fibroblasts with Multiple Developmental Defects and Mitochondrial Disorders. International Journal of Molecular Sciences 22, 6263. - PMC - PubMed
    1. Barnes PJ. (2016). Sex Differences in Chronic Obstructive Pulmonary Disease Mechanisms. Am J Respir Crit Care Med 193, 813–814. - PubMed

Publication types