. 2022 Dec 19;80(1):12.
doi: 10.1007/s00018-022-04638-y.

AP1/Fra1 confers resistance to MAPK cascade inhibition in pancreatic cancer

Affiliations

AP1/Fra1 confers resistance to MAPK cascade inhibition in pancreatic cancer

Christian Schneeweis et al. Cell Mol Life Sci. .

Abstract

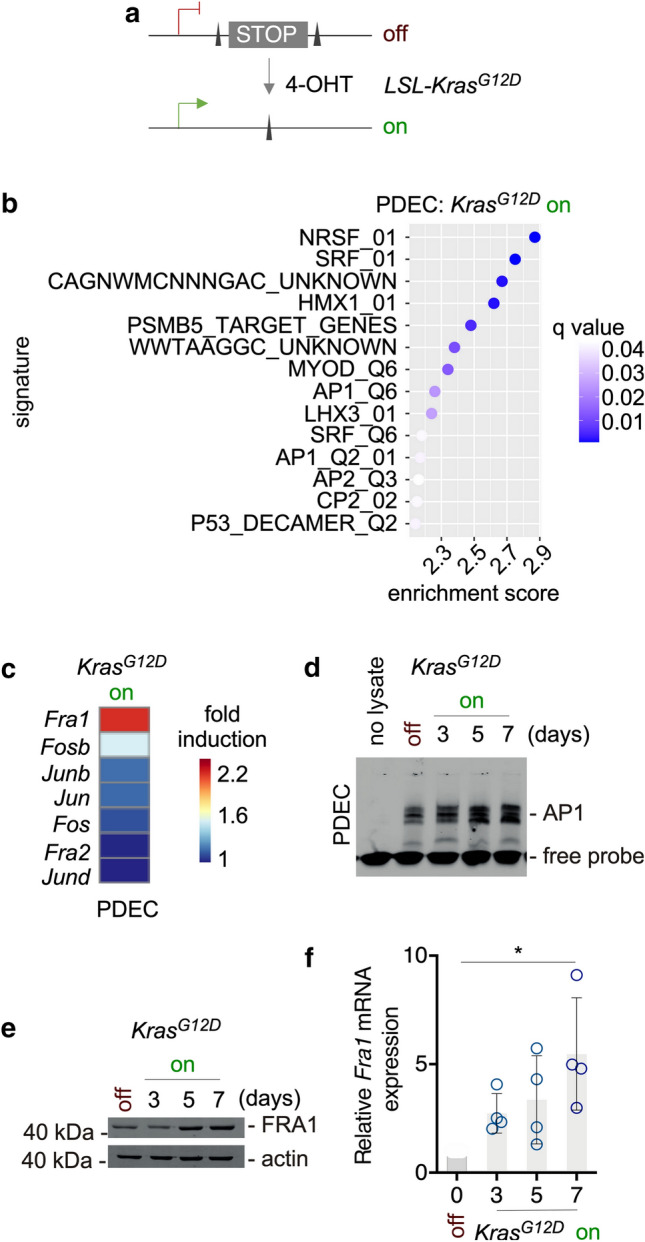
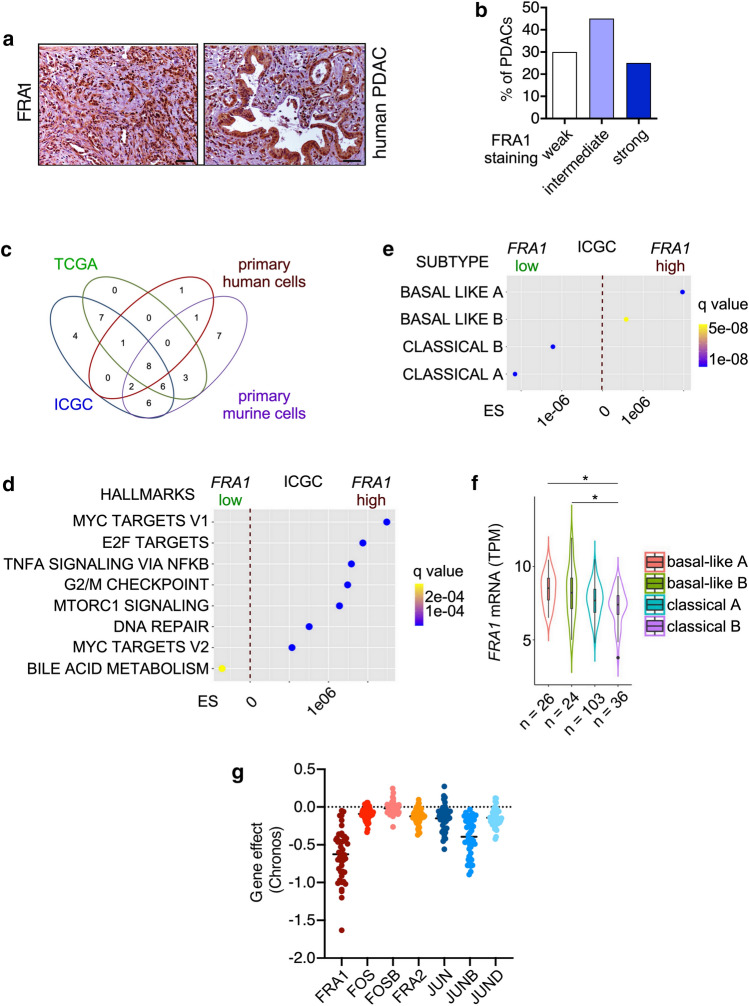
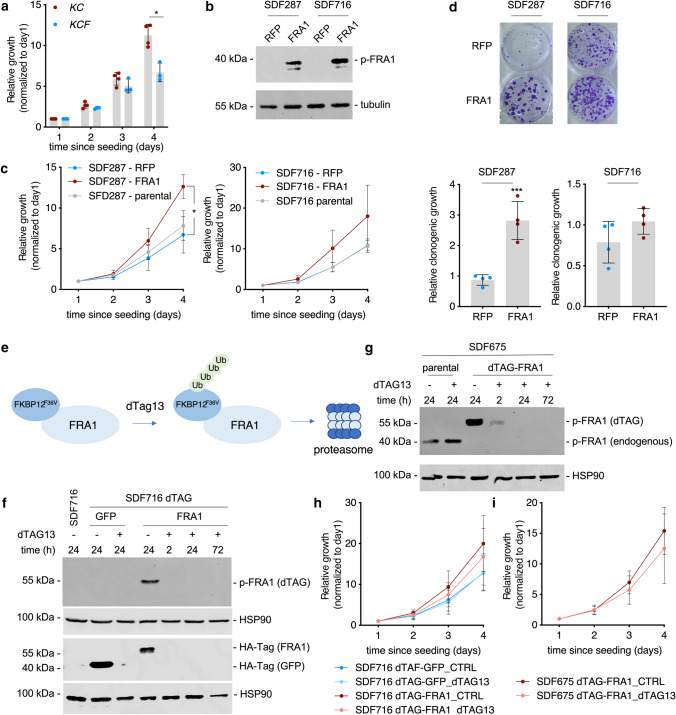
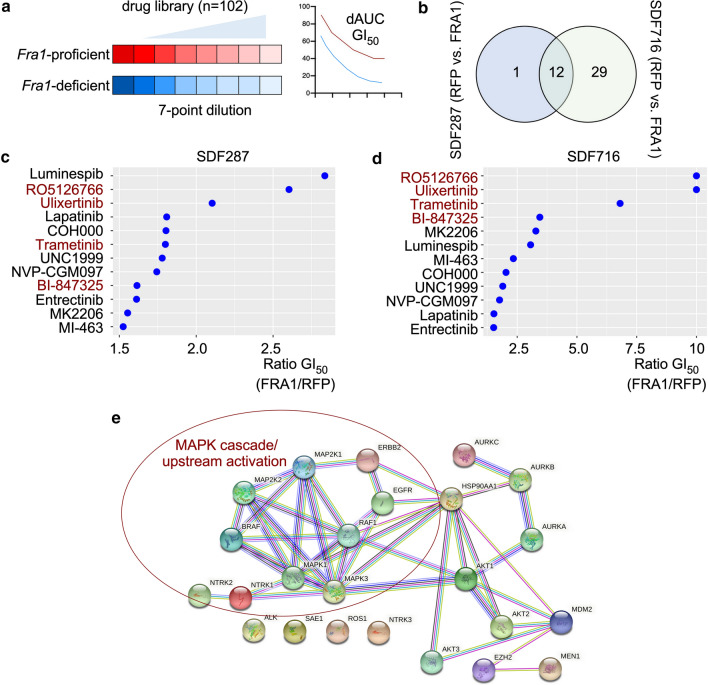
Targeting KRAS downstream signaling remains an important therapeutic approach in pancreatic cancer. We used primary pancreatic ductal epithelial cells and mouse models allowing the conditional expression of oncogenic KrasG12D, to investigate KRAS signaling integrators. We observed that the AP1 family member FRA1 is tightly linked to the KRAS signal and expressed in pre-malignant lesions and the basal-like subtype of pancreatic cancer. However, genetic-loss-of-function experiments revealed that FRA1 is dispensable for KrasG12D-induced pancreatic cancer development in mice. Using FRA1 gain- and loss-of-function models in an unbiased drug screen, we observed that FRA1 is a modulator of the responsiveness of pancreatic cancer to inhibitors of the RAF-MEK-ERK cascade. Mechanistically, context-dependent FRA1-associated adaptive rewiring of oncogenic ERK signaling was observed and correlated with sensitivity to inhibitors of canonical KRAS signaling. Furthermore, pharmacological-induced degradation of FRA1 synergizes with MEK inhibitors. Our studies establish FRA1 as a part of the molecular machinery controlling sensitivity to MAPK cascade inhibition allowing the development of mechanism-based therapies.

Keywords: AP1; ERK; FRA1; KRAS; MEK; Pancreatic cancer.


Conflict of interest statement

There are no conflicts of interest.

Figures

Fig. 1
Fig. 1
AP-1 transcription factors are linked to oncogenic KRAS in murine primary pancreatic epithelial cells (PDEC). a Genetic strategy to activate oncogenic KrasG12D expression in PDECs isolated from R26CreERT2;LSL-KrasG12D/+ mice. Treatment with 4-OHT induces Cre-mediated recombination of the STOP cassette to activate the expression of oncogenic KrasG12D. b Transcription factor gene sets upregulated upon activation of oncogenic KrasG12D. PDECs from R26CreERT2;LSL-KrasG12D/+ mice were treated with 4-OHT (200 nM) for three days or were left as vehicle treated controls. Microarrays were generated and analyzed with a GSEA and transcription factor signature of the C3 MSigDB collection (version c3.tft.v7.5.1) and the GSEA application (version 4.2.3). Shown is the normalized enrichment score and the q value is color coded. All signatures with a q < 0.05 were depicted. Data can be accessed via EMBL-EBI ArrayExpress Accession number: E-MTAB-2592. c Upregulation of AP1 family members mRNA upon activation of KrasG12D. Heatmap of AP-1 transcription factor family factors. Shown is the fold induction of the respective JUN and FOS family members upon activation of KrasG12D. Data derived from Microarrays used in (B). d Increased AP1 DNA binding over time upon activation of KrasG12D. PDECs from R26CreERT2;LSL-KrasG12D/+ mice were treated with 4-OHT (200 nM) over time as indicated or were left as vehicle-treated controls. Non-radioactive electrophoretic mobility shift assay with a double-stranded oligonucleotide containing an AP1 consensus binding site is shown. e FRA1 protein expression is upregulated upon KrasG12D activation. Western blot of FRA1 expression in PDECs from R26CreERT2;LSL-KrasG12D/+ mice treated with 4-OHT (200 nM) over time or left as vehicle treated controls. β-actin: loading control. n = 4. f Relative Fra1 mRNA expression in 4-OHT (200 nM)-treated PDECs was determined by qPCR using cyclophilin A mRNA expression as reference (n = 4). One-way ANOVA p < 0.05
Fig. 2
Fig. 2
FRA1 is connected to the basal-like subtype of PDAC. a Immunohistochemistry of FRA1 in two human PDACs with strong FRA1 expression (scale bar 50 µm). b 20 human PDACs were scored for FRA1 expression. Depicted is the fraction of PDACs (%) with weak, moderate, and strong FRA1 expression. c Venn diagram showing the overlap of HALLMARK signatures enriched or depleted in PDACs with high FRA1 mRNA expression (> 75th percentile). mRNA expression datasets of PDAC from the TCGA and ICGC databases as well as primary murine and primary human PDAC cells were analyzed. d, e Displayed are the common HALLMARK gene signatures consistently enriched or depleted in PDACs with high FRA1 mRNA expression corresponding to C and exemplified for the ICGC dataset. e Gene signatures corresponding to genes defining classical-A, classical-B, basal-like A, and basal-like B were used for a GSEA. Enrichment scores and q-values for the ICGC dataset are displayed. f FRA1 mRNA expression analysis in PDAC patients divided into classical A, classical B, basal-like A, and basal-like B subtypes. *adjusted p-value < 0.05. g CRISPR/Cas-drop out screen data were accessed via the DepMap portal. Shown are the gene scores for the core AP1 family and the PDAC context (n = 46)
Fig. 3
Fig. 3
Fra1-deficient PDAC cells display impaired growth. a Impaired growth in Fra1-deficient PDAC cell lines. Relative growth of four Ptf1aCre/+;LSL-KrasG12D/+ (KC) and three Ptf1aCre/+;LSL-KrasG12D/+;Fra1lox/lox (KCF) PDAC cell lines was determined in MTT assays. 1,000 cells per well of a 96-well plate were seeded out in triplicates. The OD values of each cell line were determined on day 1, 2, 3 and 4 after seeding and are displayed as relative values normalized to day 1. Each dot represents the mean value of one cell line from n = 3 biological experiments for all cell lines except for the KC cell line PPT-8024 (n = 2). The p-value of an unpaired Student`s t-test at day 4 is indicated. b Constitutive reconstitution of FRA1 expression in KCF PDAC cells. Western blot with anti-phospho-FRA1 (Ser265) antibody of the KCF cell lines SDF287 and SDF716 transduced either with pLenti-RFP or pLenti-FRA1 vector. Tubulin served as loading control. One representative Western blot out of two independent experiments is shown. c Cell growth of two Ptf1aCre/+;LSL-KrasG12D/+;Fra1lox/lox (KCF) PDAC cell lines SDF287 (left panel) and SDF716 (right panel) upon reconstitution of FRA1 (pLenti-FRA1) compared to RFP-reporter (pLenti-RFP) transduced or parental cell line was determined in MTT assays. 1,000 cells per well of a 96-well plate were seeded out in triplicates. The OD values of each cell line were determined on day 1, 2, 3 and 4 after seeding and are displayed as relative values normalized to day 1 (mean ± SD from at least three independent experiments). *P-value from ANOVA ≤ 0.05. d Clonogenic growth of the two Ptf1aCre/+;LSL-KrasG12D/+;Fra1lox/lox (KCF) PDAC cell lines SDF287 and SDF716 upon reconstitution of FRA1 (pLenti-FRA1) compared to RFP-reporter (pLenti-RFP) transduced cell lines was determined in clonogenic assays. 2000 cells/well were seeded in 6-well plates in technical triplicates. Upper panel: One representative clonogenic assay out of four independent experiments is shown. Lower panel: Quantification of the clonogenic assays. Crystal violet stainings were solubilized with 1% SDS and OD values measured. Displayed are the mean ± SD from the relative OD values (normalized to pLenti-RFP, arbitrarily set to 1) from four independent experiments (seeded out in technical triplicates). Each dot represents the mean value of the three technical replicates from one experiment. ***P-value of an unpaired t-test ≤ 0.001. e Schematic description of the dTAG-FRA1 System. Treatment with the dTAG13 degrader allows for selective degradation of mutant FKBP12F36V-FRA1 fusion. f Selective degradation of dTAG-FRA1 and dTAG-GFP fusion proteins. Western blot with anti-phospho-FRA1 (Ser265) and anti-HA-Tag antibodies of the KCF PDAC cell line SDF716 transduced either with a FKBP12F36V-FRA1 (dTAG-FRA1) or a fluorescent control FKBP12F36V-GFP (dTAG-GFP) construct. Cells were seeded and treated on the following day with 0.5 µM dTAG13 for the indicated time points to induce selective degradation of the dTAG-GFP or dTAG-Fra1 fusion proteins. The dTAG-constructs contain an HA-Tag allowing for immunodetection with an anti-HA-Tag antibody. The Fra1-deficient SDF716 parental wild-type (wt) cell line served as a control. HSP90 was used as a loading control. g Selective degradation of dTAG-FRA1 fusion protein. Western blot with anti-phospho-FRA1 (Ser265) antibody of the Pdx1-Flp;FSF-KrasG12D/+, p53frt/+; Fra1lox/lox cell line SDF675 transduced with an inducible Cre recombinase (pInducer-iCre) and a FKBP12F36V-FRA1 (dTAG-FRA1) construct. After treatment for 8 days with 100 ng/mL Doxycycline to induce the Cre-Recombinase and subsequent recombination of the endogenous floxed Fra1 alleles, cells were seeded and treated on the following day with 0.5 µM dTAG13 for the indicated time points to induce selective degradation of the dTAG-FRA1 fusion protein. The parental wild-type (wt) cell line served as a control for the expression of endogenous FRA1. HSP90 was used as a loading control. h Relative growth of the Ptf1aCre/+;LSL-KrasG12D/+;Fra1lox/lox (KCF) PDAC cell line SDF716 transduced either with dTAG-FRA1 or dTAG-GFP vectors. For each condition, 1000 cells were seeded per well and treated on the following day with 1 µM dTAG13 to induce degradation of the dTAG fusion protein. Relative growth was determined by MTT assays. The absorbance values of each cell line were determined on day 1, 2, 3 and 4 after seeding and are displayed as relative values normalized to day 1 (mean ± SD from three independent experiments). i Relative growth of the Pdx1-Flp;FSF-KrasG12D/+, p53frt/+; Fra1lox/lox PDAC cell line SDF675 transduced with dTAG-FRA1 and pInducer-iCre vectors. Cells were treated for 8 days with doxycycline to induce complete recombination of the endogenous floxed Fra1 allele. For each condition, 1,000 cells were seeded per well in triplicates and treated on the following day with 1 µM dTAG13 to induce degradation of the dTAG-FRA1 fusion protein. Relative growth was determined by MTT assays. The OD values of each cell line were determined on days 1, 2, 3, and 4 after seeding and are displayed as relative values normalized to day 1. Data are presented as mean ± SD from three independent experiments
Fig. 4
Fig. 4
Unbiased drug screen identifies MAPK inhibitors as druggable vulnerabilities of Fra1-deficient PDAC cells. a Schematic description of the drug screen setup. Isogenic Fra1-proficient and Fra1-deficient cell lines were screened with a drug library consisting of 102 compounds in 7-point serial dilutions. Cell viability after 72 h of treatment was assessed by CellTiter-Glo and GI50 and AUC values were calculated. b Venn analysis identifies drugs to which both Fra1-deficient cell lines were more sensitive to. A GI50 ratio (FRA1/RFP) > 1.5 was used as the threshold for differential sensitivity. c, d Ratio of GI50 (Fra1/RFP) values from the drug screen for the 12 common hits identified in (B). Hits are depicted in (C) for SDF287 and in (D) SDF716 cells. Four out of the twelve drugs are RAF-MEK-ERK cascade inhibitors and are marked in red. Ratios were arbitrarily restricted to a max. of 10. e STRING pathway analysis was performed using the targets of the drug screening experiment and the STRING web platform using multi protein modus, full STRING network, and highest confidence interaction score (0.9) as setting. Marked is the canonical KRAS-RAF-MEK-ERK nodus
Fig. 5
Fig. 5
Loss of Fra1 triggers increased MAPK signaling and sensitivity to MAPK inhibitors. (ac) Fra1-deficient cells are sensitive to MAPK inhibitors. Fra1-deficient and -proficient cells were treated in technical triplicates with 7-point serial dilutions of the dual RAF/MEK inhibitor RO5126766 (A), the ERK inhibitor ulixertinib (B) or the MEK inhibitor trametinib (C). Upper panel: Cell line SDF287, transduced with RFP or FRA1 expression vectors. Lower Panel: Cell line SDF716 transduced with RFP or FRA1 expression vectors. Viability was determined by MTT assay after 72 h of drug treatment and is displayed as relative viability normalized to DMSO treated controls. Values represent the mean of three independent experiments ± SD. GI50 values were calculated by non-linear regression and are indicated in the respective figures. d Clonogenic growth of Fra1-deficient (RFP) and Fra1-proficient (FRA1) cell lines upon treatment with the MEK inhibitor trametinib in the two cell lines SDF287 (upper panel) and SDF716 (lower panel). Cells (1000/well) were seeded out in 24-well plates, treated on the following day with the indicated doses of trametinib in technical duplicates and stained with crystal violet after 7 days of treatment. One representative image from three independent experiments is shown. e Quantification of the clonogenic assays shown in (D). Crystal violet stainings were solubilized in 1% SDS and absorbance was measured in a microplate reader. Absorbance values were normalized to DMSO treated controls and are displayed as relative clonogenic growth. Each dot represents the mean value (from the technical duplicates) of one independent experiments. Data are presented as mean ± SD from three independent experiments. Left panel: SDF287. Right panel: SDF716. P-value of a 2way ANOVA with multiple comparisons. ***P ≤ 0.001. ****P ≤ 0.0001. f Perturbation of FRA1 sensitizes to MAPK inhibition. The Fra1-deficient KCF cell line SDF716 was reconstituted with the dTAG-FRA1 construct (or dTAG-GFP as control). SDF716 dTAG-FRA1 and SDF716 dTAG-GFP cells were seeded out in 96-well plates (1,000/well) in growth medium containing either 1 µM dTAG13 to induce degradation of the dTAG-fusion protein or DMSO as control. On the following day, the cells were treated in technical triplicates with 7-point serial dilutions of the dual RAF/MEK inhibitor RO5126766 (left panel), the ERK inhibitor ulixertinib (middle), or the MEK inhibitor trametinib (right panel). Viability was determined by MTT assay after 72 h of drug treatment and is displayed as relative viability normalized to vehicle-treated controls. Values represent the mean of three independent experiments ± SD. GI50 values were calculated by nonlinear regression and are indicated in the respective figures. g ERK1/2 gene signatures are enriched in Fra1-deficient cells. RNA-seq with subsequent geneset enrichment analysis was performed in Fra1-deficient (SDF287 RFP and SDF716 RFP) and Fra1-reconstituted cells (SDF287 FRA1 and SDF716 FRA1). Left panel: Shown are the top ten gene signatures from the Gene Ontology Biological Process (GOBP) database that are depleted in the two FRA1-reconstituted cell lines compared with Fra1-deficient controls. Normalized enrichment scores and q-values are shown. Right panel: Enrichment plot for the ERK1/2 cascade-related gene signatures “ERK1 and ERK2 cascade” (upper) and “positive regulation of ERK1 and ERK2 cascade” (lower). h Western blots for phospho-ERK and phospho-AKT upon treatment with trametinib after 24 h (left panel) and 72 h (right panel) in Fra1-deficient and -proficient cells. i Quantification of ERK phosphorylation in Fra1-proficient and -deficient cell lines. Depicted is the ratio of phospho-ERK to total ERK from the Western blots in H). Left panel: SDF287 cell line (24 and 72 h trametinib treatment); right panel: SDF716 cell line (24 and 72 h treatment). Each dot represents one independent experiment

References

    1. Waters AM, Der CJ. KRAS: the critical driver and therapeutic target for pancreatic cancer. Csh Perspect Med. 2018;8:a031435. doi: 10.1101/cshperspect.a031435. - DOI - PMC - PubMed
    1. Hessmann E, Schneider G, Meeting 1st Virtual Göttingen-Munich-Marburg Pancreatic Cancer New insights into pancreatic cancer: notes from a virtual meeting. Gastroenterology. 2021;161:785–791. doi: 10.1053/j.gastro.2021.04.082. - DOI - PubMed
    1. Schneeweis C, Wirth M, Saur D, et al. Oncogenic KRAS and the EGFR loop in pancreatic carcinogenesis—a connection to licensing nodes. Small Gtpases. 2017;9:457–464. doi: 10.1080/21541248.2016.1262935. - DOI - PMC - PubMed
    1. Chan-Seng-Yue M, Kim JC, Wilson GW, et al. Transcription phenotypes of pancreatic cancer are driven by genomic events during tumor evolution. Nat Genet. 2020;52:231–240. doi: 10.1038/s41588-019-0566-9. - DOI - PubMed
    1. Nguyen B, Fong C, Luthra A, et al. Genomic characterization of metastatic patterns from prospective clinical sequencing of 25,000 patients. Cell. 2022;185:563–575.e11. doi: 10.1016/j.cell.2022.01.003. - DOI - PMC - PubMed

MeSH terms

Substances