. 2023 Feb;12(1):303-317.
doi: 10.1007/s40120-022-00427-8. Epub 2022 Dec 19.

Serum Neurofilament Light Trajectories and Their Relation to Subclinical Radiological Disease Activity in Relapsing Multiple Sclerosis Patients in the APLIOS Trial

Affiliations

Serum Neurofilament Light Trajectories and Their Relation to Subclinical Radiological Disease Activity in Relapsing Multiple Sclerosis Patients in the APLIOS Trial

Amit Bar-Or et al. Neurol Ther. 2023 Feb.

Abstract

Introduction: Several studies have described prognostic value of serum neurofilament light chain (sNfL) at the group level in relapsing multiple sclerosis (RMS) patients. Here, we aimed to explore the temporal association between sNfL and development of subclinical disease activity as assessed by magnetic resonance imaging (MRI) at the group level and evaluate the potential of sNfL as a biomarker for capturing subclinical disease activity in individual RMS patients.

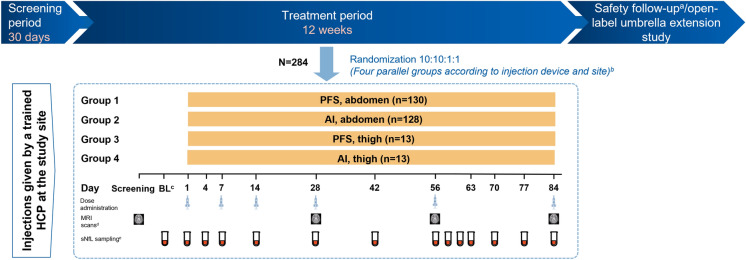
Methods: In the 12-week APLIOS study, patients (N = 284) received subcutaneous ofatumumab 20 mg. Frequent sNfL sampling (14 time points over 12 weeks) and monthly MRI scans enabled key analyses including assessment of the group-level temporal relationship of sNfL levels with on-study subclinical development of gadolinium-enhancing (Gd +)T1 lesions. Prognostic value of baseline sNfL ("high" vs. "low") level for subsequent on-study clinical relapse or Gd + T1 activity was assessed. Individual patient-level development of on-study Gd + T1 lesions was compared across three predictors: baseline Gd + T1 lesion number, baseline sNfL ("high" vs. "low"), and time-matched sNfL.

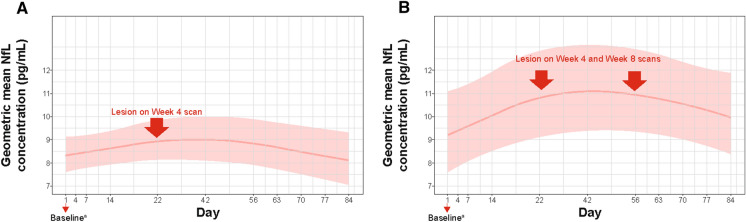
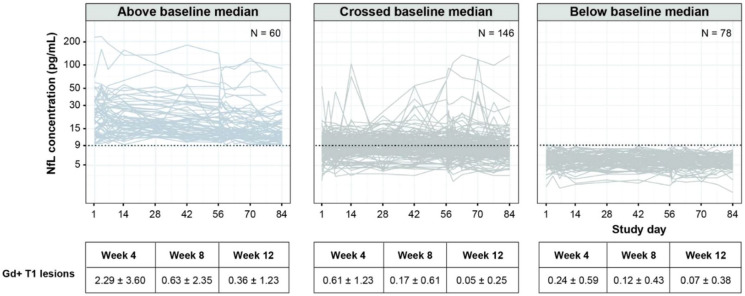
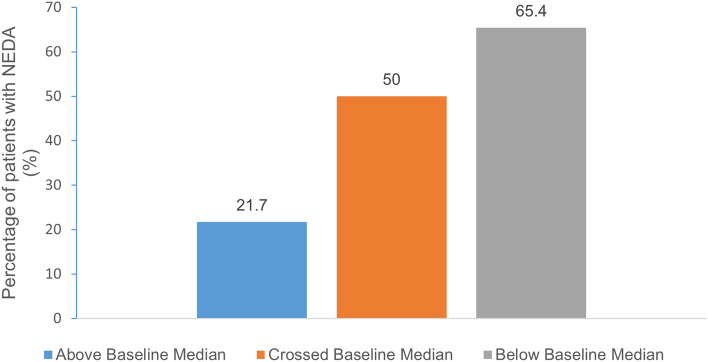
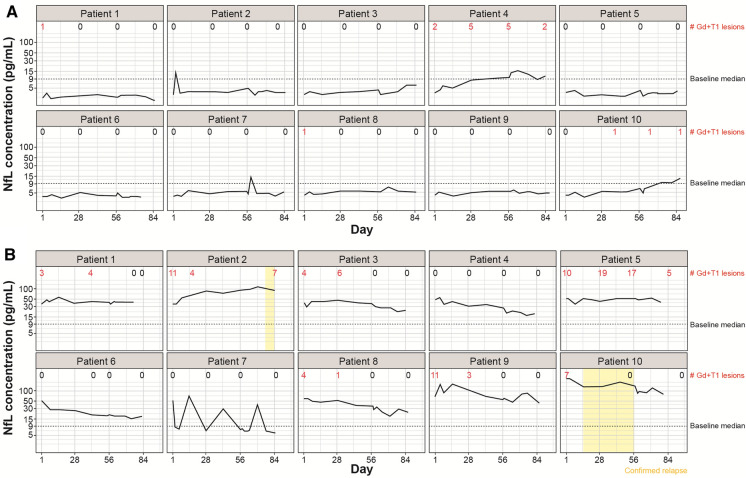
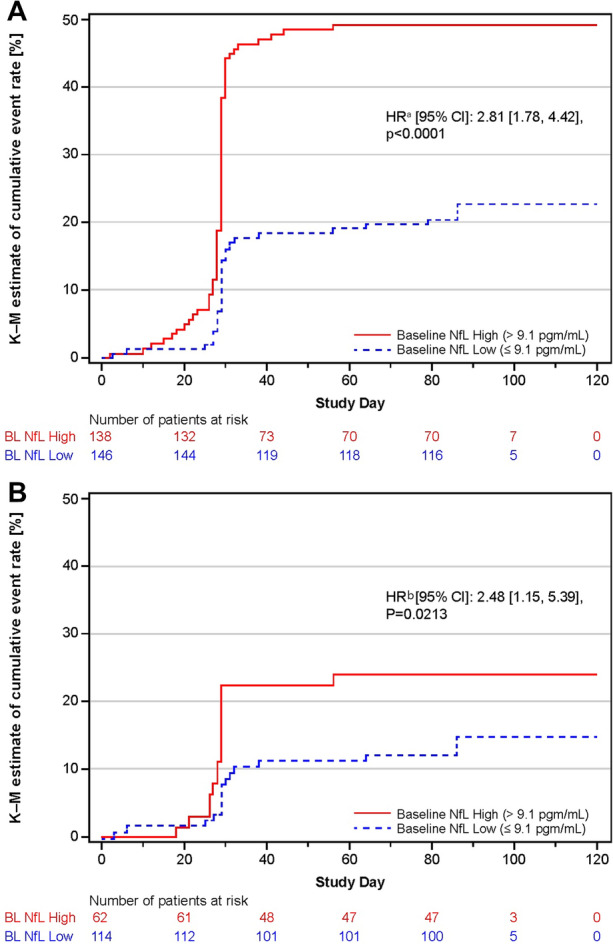
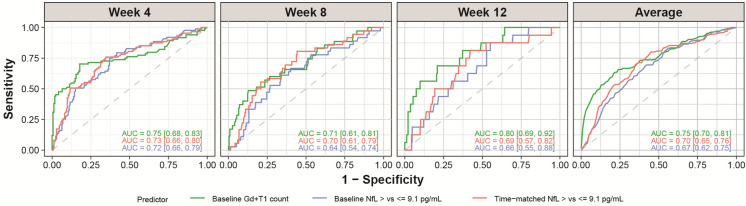
Results: In patients developing Gd + T1 lesions at week 4 (absent at baseline), sNfL levels increased during the month preceding the week-4 MRI scan and then gradually decreased back to baseline. High versus low baseline sNfL conferred increased risk of subsequent on-study clinical relapse or Gd + T1 activity (HR, 2.81; p < 0.0001) in the overall population and, notably, also in the patients without baseline Gd + T1 lesions (HR, 2.48; p = 0.0213). Individual patient trajectories revealed a marked difference in Gd + T1 lesions between patients with the ten highest vs. lowest baseline sNfL levels (119 vs. 19 lesions). Prognostic value of baseline or time-matched sNfL for on-study Gd + T1 lesions was comparable to that of the number of baseline MRI Gd + T1 lesions.

Conclusions: sNfL measurement may have utility in capturing and monitoring subclinical disease activity in RMS patients. sNfL assessments could complement regular MRI scans and may provide an alternative when MRI assessment is not feasible.

Clinicaltrials: GOV: NCT03560739.

Classification of evidence: This study provides class I evidence that serum neurofilament light may be used as a biomarker for monitoring subclinical disease activity in relapsing multiple sclerosis patients, as shown by its elevation in the weeks preceding the development of new gadolinium-enhancing T1 lesion activity.

Keywords: Biomarker; Ofatumumab; Relapsing multiple sclerosis; Serum neurofilament light chain; Subclinical disease activity.


Figures

Fig. 1
Fig. 1
APLIOS study design with sNfL sampling time points. aNine months or until the B cells returned to their baseline value or to LLN; brandomization was stratified by body weight (< 60 kg, 60–90 kg, and > 90 kg); cday 7 to day -1; din case of relapse, if an MRI for efficacy was to be scheduled within 14 days of the initiation of steroid treatment, the MRI was performed before steroid treatment was initiated. No MRI for efficacy was performed while a patient was on steroid therapy for relapse and within 14 days upon termination of steroid therap. eOn non-injection visits the PK (Plasma) and neurofilament samples were drawn at any time during the visit. AI autoinjector; BL baseline; HCP healthcare professional; LLN lower limit normal; MRI magnetic resonance imaging; PFS prefilled syringe; PK pharmacokinetics; sNfL serum neurofilament light chain
Fig. 2
Fig. 2
Temporal association of sNfL levels and Gd + T1 lesions in patients free of Gd + T1 lesions at baseline: A patients (N = 13) Who only had Gd + T1 lesions on the week 4 scan and B patients (N = 7) who had Gd + T1 lesions on both week 4 and week 8 scans. Additive mixed model with a nonparametric smoother of time adjusted for age and log of baseline sNfL. aPatients were free of Gd + T1 lesions at baseline. Gd +  gadolinium enhancing; sNfL serum neurofilament light chain
Fig. 3
Fig. 3
sNfL over time versus disease activity and individual trajectories. Dotted line: baseline median (9.1 pg/ml). sNfL, serum neurofilament light chain. Day 1 represents baseline. The group ‘above baseline median’ includes patients whose serial sNfL values were all > baseline median; the group ‘below baseline median’ includes patients whose serial sNfL values were all ≤ baseline median; the group ‘crossed baseline median’ includes the rest of the patients
Fig. 4
Fig. 4
Proportion of patients with NEDA by longitudinal sNfL subgroup
Fig. 5
Fig. 5
Individual patient trajectories: A Patients with the ten lowest baseline sNfL levels and B patients with the ten highest baseline sNfL levels. Dotted line: baseline median (9.1 pg/ml). The number of Gd + T1 lesions annotated refers to those visible on brain MRI scans. Additional lesions may have occurred outside the field of view, e.g., in the spinal cord. Gd +  gadolinium-enhancing; sNfL serum neurofilament light chain
Fig. 6
Fig. 6
Baseline sNfL level predicts risk of on-study disease activity: A All patients and B patients free of Gd + T1 lesions at baseline. The stepped lines show Kaplan-Meier estimates of the cumulative proportion of patients with either confirmed clinical relapses or Gd + T1 lesions by time (days). In the figure, the steep increase in the estimated proportion of patients with on-study confirmed clinical relapses or Gd + T1 lesions at day 28 was observed because day 28 is the day of the first-post baseline MRI scan, uncovering the proportion of patients with radiological disease activity. aThe Cox regression model included the baseline sNfL category as factor, age, baseline number of Gd + T1 lesions, baseline volume of T2 lesions, baseline EDSS, and number of clinical relapses in previous year as continuous covariates. bThe Cox regression model included baseline sNfL category as factor and age, baseline volume of T2 lesions, baseline EDSS and number of clinical relapses in the previous year as continuous covariates. Gd + gadolinium enhancing, HR hazard ratio, sNfL serum neurofilament light chain
Fig. 7
Fig. 7
ROC curves and AUC for the identification of on-study Gd + T1 lesionsa; 9.1 pg/ml is the median baseline sNfL concentration for all patients in the safety set whose baseline sNfL levels are available. aPrediction of whether a patient would have a Gd + T1 lesion on the scan of the specified week using logistic regressions based on the following linear predictors: Model “baseline Gd + T1” (green) used the number of Gd + T1 on the baseline scan as the predictor, model “baseline sNfL” (blue) used the baseline sNfL measure (> 9.1 pg/ml vs. ≤ 9.1 pg/ml) as predictor, and model “time-matched sNfL” (red) used time-matched sNfL (if not available, the last sNfL value before the scan day) (> 9.1 pg/ml vs. ≤ 9.1 pg/ml) as the predictor of whether there would be lesions on the respective scan. All models were adjusted for age. AUCs from week 4, week 8, and week 12 scans were calculated from tenfold cross-validation, and average AUC is the average across the three scans. For each scan and each model, 10,000 bootstrap resampling on the predicted probabilities and the true labels is performed, and a residual bootstrap interval is obtained from the bootstrapped AUCs. AUC area under the curve; Gd +  gadolinium-enhancing; MRI magnetic resonance imaging; ROC AUC area under the receiver-operating characteristics curve; sNfL serum neurofilament light chain

References

    1. Joy JE, Johnston RB Jr, editors. Committee on multiple sclerosis: current status and strategies for the future, board on neuroscience and behavioral health. Washington: National Academies Press (US); 2001. - PubMed
    1. Kuhle J, Kropshofer H, Haering DA, et al. Blood neurofilament light chain as a biomarker of MS disease activity and treatment response. Neurology. 2019;92(10):e1007–e1015. doi: 10.1212/WNL.0000000000007032. - DOI - PMC - PubMed
    1. Berger T, Stuve O. Neurofilament light chain: an important step toward a disease biomarker in multiple sclerosis. Neurology. 2019;92:1–2. doi: 10.1212/WNL.0000000000007022. - DOI - PubMed
    1. Disanto G, Barro C, Benkert P, et al. Serum Neurofilament light: a biomarker of neuronal damage in multiple sclerosis. Ann Neurol. 2017;81:857–870. doi: 10.1002/ana.24954. - DOI - PMC - PubMed
    1. Haering DA, Kropshofer H, Kappos L, et al. Long-term prognostic value of longitudinal measurements of blood neurofilament levels. Neurol Neuroimmunol Neuroinflamm. 2020;7:e856. doi: 10.1212/NXI.0000000000000856. - DOI - PMC - PubMed

Associated data