. 2022 Oct 1;12(4):e2022164.
doi: 10.5826/dpc.1204a164. eCollection 2022 Nov.

UV Irradiation of Nevi: Impact on Performance of Electrical Impedance Spectroscopy and a Convolution Neural Network

Affiliations

UV Irradiation of Nevi: Impact on Performance of Electrical Impedance Spectroscopy and a Convolution Neural Network

Julia Katharina Winkler et al. Dermatol Pract Concept. .

Abstract

Introduction: UV irradiation of nevi induces transient melanocytic activation with dermoscopic and histological changes.

Objectives: We investigated whether UV irradiation of nevi may influence electrical impedance spectroscopy (EIS) or convolution neural networks (CNN).

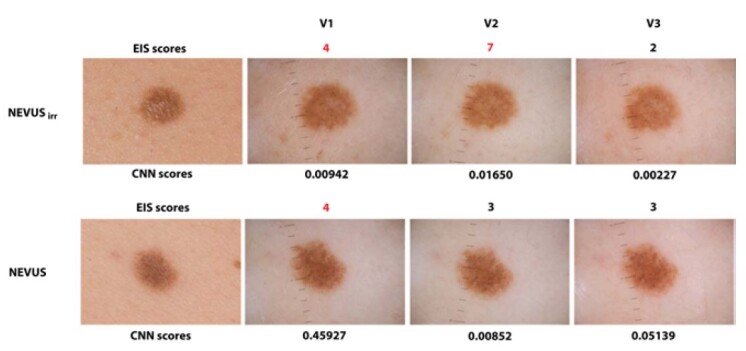
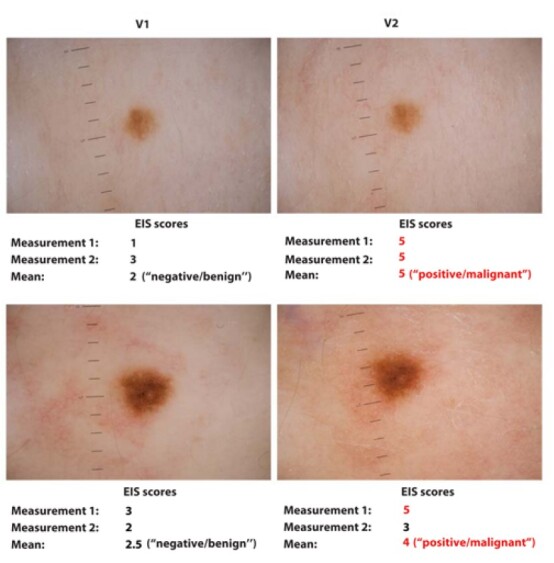
Methods: Prospective, controlled trial in 50 patients undergoing phototherapy (selective UV phototherapy (SUP), UVA1, SUP/UVA1, or PUVA). EIS (Nevisense, SciBase AB) and CNN scores (Moleanalyzer-Pro, FotoFinder Systems) of nevi were assessed before (V1) and after UV irradiation (V2). One nevus (nevusirr) was exposed to UV light, another UV-shielded (nevusnon-irr).

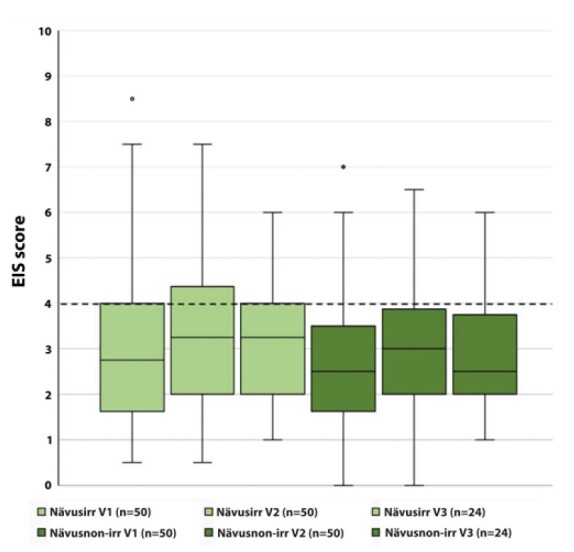
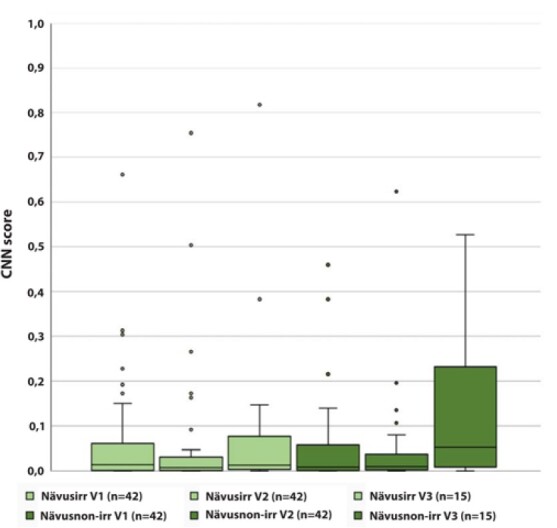
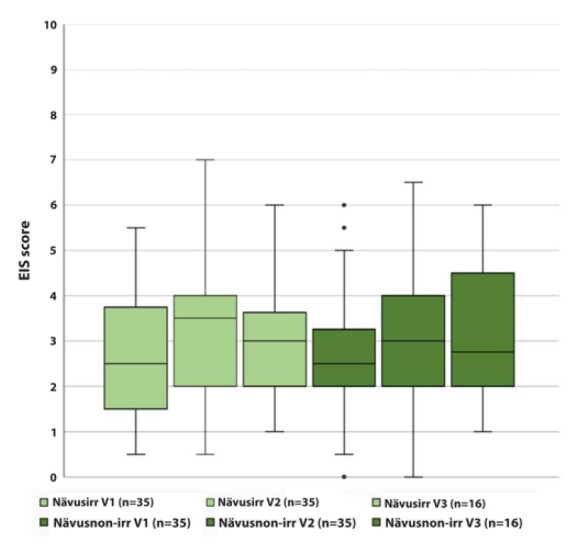
Results: There were no significant differences in EIS scores of nevusirr before (2.99 [2.51-3.47]) and after irradiation (3.32 [2.86-3.78]; P = 0.163), which was on average 13.28 (range 4-47) days later. Similarly, UV-shielded nevusnon-irr did not show significant changes of EIS scores (V1: 2.65 [2.19-3.11]), V2: 2.92 [2.50-3.34]; P = 0.094). Subgroup analysis by irradiation revealed a significant increase of EIS scores of nevusirr (V1: 2.69 [2.21-3.16], V2: 3.23 [2.72-3.73]; P = 0.044) and nevusnon-irr (V1: 2.57 [2.07-3.07], V2: 3.03 [2.48-3.57]; P = 0.033) for patients receiving SUP. In contrast, CNN scores of nevusirr (P = 0.995) and nevusnon-irr (P = 0.352) showed no significant differences before and after phototherapy.

Conclusions: For the tested EIS system increased EIS scores were found in nevi exposed to SUP. In contrast, CNN results were more robust against UV exposure.

Keywords: UV irradiation; convolution neural network; dermoscopy; electrical impedance spectroscopy.


Conflict of interest statement

Competing Interests: None.

Figures

Figure 1
Figure 1
Nevus1 and nevus2 of a participating patient at all 3 study visits (V1–3) are depicted. From V1 to V2 nevusirr was irradiated with SUP during 10 appointments (cumulative dosage UVA 14.54 J/cm2, UVB 0.29 J/cm2), whereas nevusnon-irr was UV-shielded. Corresponding electrical impedance spectroscopy (EIS) scores (0–10, top row) and convolution neural networks malignancy scores (0-1, bottom row) are depicted, scores marked in red illustrate a change in the diagnostic class, ie scores increased above the threshold for a malignant classification.
Figure 2
Figure 2
Boxplots show electrical impedance spectroscopy (EIS) scores of irradiated nevusirr and UV-shielded nevusnon-irr at all 3 study visits (V1-before UV irradiation; V2-after UV irradiation; V3-not earlier than 4 weeks following the last irradiation). The upper and lower bounds of boxes represent the 25th and 75th percentiles while the median is given by the line intersecting both boxes. Whiskers present the full range of malignancy scores. The a priori cut-off for a malignant classification is indicated by dotted lines (EIS score ≥ 4).
Figure 3
Figure 3
Figure shows dermoscopic images of two neviirr from V1 and V2 with corresponding electrical impedance spectroscopy (EIS) scores. For both lesions and timepoints measurements were repeated and mean values used to define a negative/benign or positive/malignant result. For both lesions mean EIS scores increased from V1 to V2 and lesions were assessed negative/benign at V1 versus positive/malignant at V2.
Figure 4
Figure 4
Boxplots show convolution neural networks (CNN) scores of irradiated nevusirr and UV-shielded nevusnon-irr at all 3 study visits (V1-before UV irradiation; V2-after UV irradiation; V3-not earlier than 4 weeks following the last irradiation). The upper and lower bounds of boxes represent the 25th and 75th percentiles while the median is given by the line intersecting both boxes. Whiskers present the full range of malignancy scores. The a priori cut-off for a malignant classification is indicated by dotted lines (CNN score > 0.5).
Figure 5
Figure 5
Boxplots show electrical impedance spectroscopy (EIS) scores of nevisirr and nevisnon-irr at all 3 study visits (V1–3) for the subgroup of patients receiving SUP. The upper and lower bounds of boxes represent the 25th and 75th percentiles while the median is given by the line intersecting both boxes. The a priori cut-off for a diagnosis of malignancy is indicated by a dotted line (EIS score ≥ 4).

Similar articles

References

    1. Arnold M, Holterhues C, Hollestein LM, et al. Trends in incidence and predictions of cutaneous melanoma across Europe up to 2015. J Eur Acad Dermatol Venereol. 2014;28(9):1170–8117. doi: 10.1111/jdv.12236. - DOI - PubMed
    1. Fink C, Haenssle HA. Non-invasive tools for the diagnosis of cutaneous melanoma. Skin Res Technol. 2017;23(3):261–271. doi: 10.1111/srt.12350. - DOI - PubMed
    1. Mohr P, Birgersson U, Berking C, et al. Electrical impedance spectroscopy as a potential adjunct diagnostic tool for cutaneous melanoma. Skin Res Technol. 2013;19(2):75–83. doi: 10.1111/srt.12008. - DOI - PubMed
    1. Ceder H, Hylén AS, Larkö AW, Paoli J. Evaluation of electrical impedance spectroscopy as an adjunct to dermoscopy in short-term monitoring of atypical melanocytic lesions. Dermatol Pract Concept. 2016;6(4):1–6. doi: 10.5826/dpc.0604a01. - DOI - PMC - PubMed
    1. Rocha L, Menzies SW, Lo S, Avramidis, et al. Analysis of an electrical impedance spectroscopy system in short-term digital dermoscopy imaging of melanocytic lesions. Br J Dermatol. 2017;177(5):1432–1438. doi: 10.1111/bjd.15595. - DOI - PubMed

LinkOut - more resources