. 2022 Dec 19;17(12):e0278646.
doi: 10.1371/journal.pone.0278646. eCollection 2022.

Uneven terrain treadmill walking in younger and older adults

Affiliations

Uneven terrain treadmill walking in younger and older adults

Ryan J Downey et al. PLoS One. .

Abstract

We developed a method for altering terrain unevenness on a treadmill to study gait kinematics. Terrain consisted of rigid polyurethane disks (12.7 cm diameter, 1.3-3.8 cm tall) which attached to the treadmill belt using hook-and-loop fasteners. Here, we tested four terrain unevenness conditions: Flat, Low, Medium, and High. The main objective was to test the hypothesis that increasing the unevenness of the terrain would result in greater gait kinematic variability. Seventeen younger adults (age 20-40 years), 25 higher-functioning older adults (age 65+ years), and 29 lower-functioning older adults (age 65+ years, Short Physical Performance Battery score < 10) participated. We customized the treadmill speed to each participant's walking ability, keeping the speed constant across all four terrain conditions. Participants completed two 3-minute walking trials per condition. Using an inertial measurement unit placed over the sacrum and pressure sensors in the shoes, we calculated the stride-to-stride variability in step duration and sacral excursion (coefficient of variation; standard deviation expressed as percentage of the mean). Participants also self-reported their perceived stability for each condition. Terrain was a significant predictor of step duration variability, which roughly doubled from Flat to High terrain for all participant groups: younger adults (Flat 4.0%, High 8.2%), higher-functioning older adults (Flat 5.0%, High 8.9%), lower-functioning older adults (Flat 7.0%, High 14.1%). Similarly, all groups exhibited significant increases in sacral excursion variability for the Medium and High uneven terrain conditions, compared to Flat. Participants were also significantly more likely to report feeling less stable walking over all three uneven terrain conditions compared to Flat. These findings support the hypothesis that altering terrain unevenness on a treadmill will increase gait kinematic variability and reduce perceived stability in younger and older adults.


Conflict of interest statement

The authors have declared that no competing interests exist.

Figures

Fig 1
Fig 1. Uneven terrain treadmill.
(A) We recorded participants’ step timing along with the spatial movement of their sacrum as they walked over an uneven terrain treadmill. (B) We tested four terrain conditions by varying the height of the obstacles.
Fig 2
Fig 2. Violin plot showing the distribution of the self-selected overground (OG) walking speeds and the fixed treadmill (TM) speed for each participant group.
Statistical tests were not performed, but overground walking speed tended to decrease with terrain unevenness for all groups. Lower-functioning older adults tended to walk slower than higher-functioning older adults. Younger adults tended to walk faster than higher-functioning older adults. The shaded regions represent the distribution of the data (across participants) by estimating the probability density function; each shaded region has equal area. The bottom of the box is the 25% percentile. The top of the box is the 75% percentile. The horizontal line in the middle of the box is the median. Whiskers extend from the bottom of the box to the smallest observation within 1.5 times the interquartile range. Whiskers similarly extend from the top of the box to the largest observation within 1.5 times the interquartile range. Individual data points lying outside the whiskers are plotted as large circles centered on the violin. All individual data points are plotted on the left half of each violin as small circles.
Fig 3
Fig 3. Inertial measurement unit (IMU) processing pipeline.
(A) The IMU data, initially expressed in its local frame, was temporarily converted to a global frame, and ultimately analyzed in a treadmill fixed frame. (B) We calculated the movement of the sacrum in a global frame using the raw accelerations along with precalculated orientation information which was readily available on export (Motion Studio). (C) We used the average orientation of the IMU to find the forward walking direction. (D) We calculated the peak-to-peak excursion of the sacrum stride-by-side, in both the anteroposterior (AP) and mediolateral (ML) directions. Finally, we quantified the variability of the movement using the coefficient of variation.
Fig 4
Fig 4. Flowchart for determining a participant’s perceived stability.
We asked participants to rate their perceived stability by answering a series of yes or no questions. We instructed them to only consider the official 3-minute portion of the trial when the treadmill speed was held constant. We asked them to ignore the transient moments before and after (i.e., when the treadmill is accelerating to the target speed or decelerating to a stop).
Fig 5
Fig 5. Violin plot showing the distribution of the step duration variability for each terrain condition and participant group.
All groups showed significantly increased step duration variability for the Medium and High terrain conditions compared to Flat. Compared to higher-functioning older adults over Flat terrain, lower-functioning older adults walked with higher step duration variability and younger adults walked with less variability. The effect of the High terrain condition (relative to Flat) was stronger for lower-functioning older adults compared to higher-functioning older adults. The shaded regions represent the distribution of the data (across participants) by estimating the probability density function; each shaded region has equal area. The bottom of the box is the 25% percentile. The top of the box is the 75% percentile. The horizontal line in the middle of the box is the median. Whiskers extend from the bottom of the box to the smallest observation within 1.5 times the interquartile range. Whiskers similarly extend from the top of the box to the largest observation within 1.5 times the interquartile range. Individual data points lying outside the whiskers are plotted as large circles centered on the violin. All individual data points are plotted on the left half of each violin as small circles. Raw data values are plotted for readability. Statistics were performed on data that were corrected for walking speed. Removing the effect of walking speed, which differed across participants, improved the statistical estimate of Group effects.
Fig 6
Fig 6. Violin plot showing the distribution of the sacral excursion variability in the anteroposterior direction for each terrain and participant group.
All groups showed a significant effect of increased sacral variability in the anteroposterior direction for the Medium and High terrain conditions compared to Flat. Compared to the higher-functioning older adults over Flat terrain, lower-functioning older adults walked with significantly more anteroposterior sacral excursion variability and younger adults walked with significantly less variability. The shaded regions represent the distribution of the data (across participants) by estimating the probability density function; each shaded region has equal area. The bottom of the box is the 25% percentile. The top of the box is the 75% percentile. The horizontal line in the middle of the box is the median. Whiskers extend from the bottom of the box to the smallest observation within 1.5 times the interquartile range. Whiskers similarly extend from the top of the box to the largest observation within 1.5 times the interquartile range. Individual data points lying outside the whiskers are plotted as large circles centered on the violin. All individual data points are plotted on the left half of each violin as small circles. Raw data values are plotted for readability. Statistics were performed on data that were corrected for walking speed. Removing the effect of walking speed, which differed across participants, improved the statistical estimate of Group effects.
Fig 7
Fig 7. Violin plot showing the distribution of sacral excursion variability in the mediolateral direction for each terrain and participant group.
All groups showed a significant effect of increased sacral variability in the mediolateral direction for the Medium and High terrain conditions compared to Flat. Compared to higher-functioning older adults, lower-functioning older adults walked with significantly greater mediolateral sacral excursion variability over Flat terrain (after accounting for differences in walking speed). Meanwhile, younger adults walked with similar mediolateral variability as higher-functioning older adults over Flat terrain (after accounting for differences in walking speed). The shaded regions represent the distribution of the data (across participants) by estimating the probability density function; each shaded region has equal area. The bottom of the box is the 25% percentile. The top of the box is the 75% percentile. The horizontal line in the middle of the box is the median. Whiskers extend from the bottom of the box to the smallest observation within 1.5 times the interquartile range. Whiskers similarly extend from the top of the box to the largest observation within 1.5 times the interquartile range. Individual data points lying outside the whiskers are plotted as large circles centered on the violin. All individual data points are plotted on the left half of each violin as small circles. Raw data values are plotted for readability. Statistics were performed on data that were corrected for walking speed. Removing the effect of walking speed, which differed across participants, improved the statistical estimate of Group effects.
Fig 8
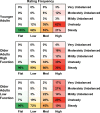
Fig 8. Perceived stability rating frequency.
These values represent the percentage of walking trials that were rated a particular stability level as a function of the participant group and terrain. Within each group-terrain combination (i.e., within each column), colors are normalized from 0% (white) to the maximal value (solid green, yellow, orange, or red, depending on the terrain condition). This was done to emphasize the relative distribution of stability ratings and how they changed as a function of the terrain. Compared to Flat terrain, all uneven terrain conditions were significantly more likely to be perceived as less stable by all groups. Lower-functioning older adults were more likely to report feeling less stable than higher-functioning older adults over flat terrain. There was no significant difference between younger adults and higher-functioning older adults over flat terrain.
Fig 9
Fig 9. Violin plot showing the distribution of the step duration for each terrain condition and participant group.
Terrain did not significantly affect step duration, although there was a trend for shorter step durations with High terrain compared to Flat. Compared to higher-functioning older adults on Flat terrain, lower-functioning older adults had significantly longer step durations and younger adults had significantly shorter step durations. The shaded regions represent the distribution of the data (across participants) by estimating the probability density function; each shaded region has equal area. The bottom of the box is the 25% percentile. The top of the box is the 75% percentile. The horizontal line in the middle of the box is the median. Whiskers extend from the bottom of the box to the smallest observation within 1.5 times the interquartile range. Whiskers similarly extend from the top of the box to the largest observation within 1.5 times the interquartile range. Individual data points lying outside the whiskers are plotted as large circles centered on the violin. All individual data points are plotted on the left half of each violin as small circles. Raw data values are plotted for readability. Statistics were performed on data that were corrected for walking speed. Removing the effect of walking speed, which differed across participants, improved the statistical estimate of Group effects.

References

    1. Thompson LD V. Age-related muscle dysfunction. Exp Gerontol. 2009;44: 106–111. doi: 10.1016/j.exger.2008.05.003 - DOI - PMC - PubMed
    1. Paraskevoudi N, Balcı F, Vatakis A. “Walking” through the sensory, cognitive, and temporal degradations of healthy aging. Ann N Y Acad Sci. 2018;1426: 72–92. doi: 10.1111/nyas.13734 - DOI - PubMed
    1. Boyer KA, Johnson RT, Banks JJ, Jewell C, Hafer JF. Systematic review and meta-analysis of gait mechanics in young and older adults. Exp Gerontol. 2017;95: 63–70. doi: 10.1016/j.exger.2017.05.005 - DOI - PubMed
    1. Aboutorabi A, Arazpour M, Bahramizadeh M, Hutchins SW, Fadayevatan R. The effect of aging on gait parameters in able-bodied older subjects: a literature review. Aging Clin Exp Res. 2016;28: 393–405. doi: 10.1007/s40520-015-0420-6 - DOI - PubMed
    1. Bruijn SM, Meijer OG, Beek PJ, van Dieën JH. Assessing the stability of human locomotion: A review of current measures. J R Soc Interface. 2013;10: 20120999. doi: 10.1098/rsif.2012.0999 - DOI - PMC - PubMed

Publication types

LinkOut - more resources