. 2022 Dec 19;18(12):e1010735.
doi: 10.1371/journal.ppat.1010735. eCollection 2022 Dec.

Comprehensive characterization of toxins during progression of inhalation anthrax in a non-human primate model

Affiliations

Comprehensive characterization of toxins during progression of inhalation anthrax in a non-human primate model

Anne E Boyer et al. PLoS Pathog. .

Abstract

Inhalation anthrax has three clinical stages: early-prodromal, intermediate-progressive, and late-fulminant. We report the comprehensive characterization of anthrax toxins, including total protective antigen (PA), total lethal factor (LF), total edema factor (EF), and their toxin complexes, lethal toxin and edema toxin in plasma, during the course of inhalation anthrax in 23 cynomolgus macaques. The toxin kinetics were predominantly triphasic with an early rise (phase-1), a plateau/decline (phase-2), and a final rapid rise (phase-3). Eleven animals had shorter survival times, mean±standard deviation of 58.7±7.6 hours (fast progression), 11 animals had longer survival times, 113±34.4 hours (slow progression), and one animal survived. Median (lower-upper quartile) LF levels at the end-of-phase-1 were significantly higher in animals with fast progression [138 (54.9-326) ng/mL], than in those with slow progression [23.8 (15.6-26.3) ng/mL] (p = 0.0002), and the survivor (11.1 ng/mL). The differences were also observed for other toxins and bacteremia. Animals with slow progression had an extended phase-2 plateau, with low variability of LF levels across all time points and animals. Characterization of phase-2 toxin levels defined upper thresholds; critical levels for exiting phase-2 and entering the critical phase-3, 342 ng/mL (PA), 35.8 ng/mL (LF), and 1.10 ng/mL (EF). The thresholds were exceeded earlier in animals with fast progression (38.5±7.4 hours) and later in animals with slow progression (78.7±15.2 hours). Once the threshold was passed, toxin levels rose rapidly in both groups to the terminal stage. The time from threshold to terminal was rapid and similar; 20.8±7.4 hours for fast and 19.9±7.5 hours for slow progression. The three toxemic phases were aligned with the three clinical stages of anthrax for fast and slow progression which showed that anthrax progression is toxin- rather than time-dependent. This first comprehensive evaluation of anthrax toxins provides new insights into disease progression.


Conflict of interest statement

The authors have declared that no competing interests exist.

Figures

Fig 1
Fig 1. First detection of anthrax biomarkers.
First detection of biomarkers relative to symptom onset in 23 cynomolgus macaques with inhalation anthrax. Pre-symptom onset period (gray bar) and post-symptom onset period (blue bar) out to 144 hours, for total lethal factor (LF), total edema factor (EF), total protective antigen (PA), and confirmed bacteremia. Detection limits for LF (0.0027 ng/mL), EF (0.00002 ng/mL), PA (1.87 ng/mL) and confirmed bacteremia (≥100 cfu/mL). Non-confirmed results of ‘+’ excluded here but included in Table 2.
Fig 2
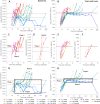
Fig 2. Kinetics of bacteremia and lethal factor in 23 cynomolgus macaques.
Bacteremia (Bact) in (cfu/mL) (A) and total lethal factor (LF) in (ng/mL) (B) over the course of infection. 11 animals had higher early bacteremia/toxemia and shorter survival (fast progression) (red/orange/purple lines), and 11 animals had lower early toxemia and longer survival (slow progression) (aqua/green lines), and one survivor with low early toxemia (blue line, square symbols). Triphasic kinetics: initial rise (phase-1), plateau/decline (phase-2), and final rise to terminal (phase-3). Bacteremia and LF in 7 animals with fast triphasic kinetics (C) and (E) and 4 animals with monophasic kinetics, a single rapid rise, (D) and (F), respectively. Bacteremia and LF in 11 animals with slow progression and survivor, (G) and (H), respectively. Final time points for 22) C59618 that died at 8.4 days (8.4D) and the survivor, 23) C58174, at the end-of-study (EOS, 14-days) are not to scale. For bacteremia (bact), non-quantifiable results of low positive were assigned a value of 6 and negative at 3 cfu/mL. Bacteremia and LF below the limit of detection (x-symbol). Boxes represent the broad range of bacteremia in phase-2 (G) and narrow range of LF levels during phase-2 (H).
Fig 3
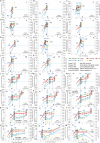
Fig 3. Anthrax toxins and bacteremia during inhalation anthrax in individual cynomolgus macaques.
Total PA, PA83, LF, EF, LTx and ETx (ng/mL) and bacteremia (cfu/mL) in 11 animals with fast progression (A-K), 11 with slow progression (L-V), and the survivor (W). Phase-1 (P1), phase-2 (P2) and phase-3 (P3) are indicated when present. Blue vertical dashed lines indicate the point separating the phases; the end-of-P1 (EOP1) that ends the P1 rise and begins the P2 plateau and the end-of-P2 (EOP2) that ends P2 and begins P3. Black arrows indicate the time of symptom onset. Survival time-days (D), hours (h). Black rectangles at the end-of-phase-1 show how toxin levels are convergent (lower differences between highest toxin PA and lowest toxin ETx) in animals with shorter survival or divergent (higher differences between PA and ETx) in animals with longer survival. Red rectangles in phase-3 in animals with longer survival show convergent levels at terminal infection. Toxins (ng/mL) and bacteremia (cfu/mL) were graphed on a similar scale (10-orders of magnitude) for comparison of dynamic changes, orders of magnitude. Aqua horizontal dashed line at 1 ng/mL toxin concentration and 1.0E+05 cfu/mL bacteremia. Low positive culture (+) graphed at 6 cfu/mL and negative culture (-) at 3 cfu/mL. Less than the limit of detection (
Fig 4
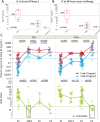
Fig 4. Stage-dependent biomarker levels.
Lethal factor levels in animals with fast and slow progression, and survivor, at the end-of-phase-1 (A) and 48 hours (B). Box plot is for median and quartiles, error bars for minimum and maximums, excluding outliers, median levels and p-values included for Wilcoxon rank sum test. (C) LF, EF levels (upper panel), and LF/EF ratio (lower panel), during earliest detection in phase-1 (P1), at the end-of-phase-1 (EOP1), subsequent phase-2 (P2), and phase-3 (P3) for fast progression (left panel) and slow progression (right panel). Lines connect the medians and error bars give quartiles for each stage. Red dashed line represents the LF threshold and blue line the EF threshold for phase-2. P-values included for testing differences in toxin levels and toxin ratios between phases. Black font includes all parameters unless another color font is shown for a specific parameter. Black rectangle shows similarity of low LF/EF ratios at the EOP1 for fast progression and P3 for slow progression.
Fig 5
Fig 5. Relationship of toxemia and time.
(A) Time in hours (h) from spore exposure to reach the phase-2 threshold for exiting phase-2 and entry to phase-3 (Table 5) and time from threshold to terminal. The time to reach the threshold was calculated for individual animals for all toxins and bacteremia and means and standard deviation (SD) (error bars) for the number (n) animals was determined for fast and slow progression. The overall mean±SD for all toxins and bacteremia combined for fast and slow progression is included above the bars. (B) Relationship between LF levels and survival time (days). Mean log10 concentrations and standard deviations as error bars for total LF over the time post-challenge (hours-h) for animals that survived 1.9–3.0 days (n = 10), 3.1 to 4.0 days (n = 5), 4.1 to 5 days (n = 4) and 5.1 to 6 days (n = 2), and for one animal at 8.4 days and survivor to end-of-study (End). Final time points for 22) C59618 at 8.4 days and 23) C58174 the survivor at end-of-study (14 days) were included together (End). Horizontal lines shown for median phase-2 LF (dashed grey) and LF phase-2 threshold (red dotted line). The black rectangle for LF at 60 h for mean log10 LF graphed vs mean subsequent survival time (60-h to terminal) (inset), fitted with a power regression.
Fig 6
Fig 6. Early hematology during inhalation anthrax.
Means and 95% confidence intervals graphed from day -7 (7 days pre-challenge) to 48 hours(h) post-challenge for fast progression (n = 11, n = 9 at 48 h), slow progression (n = 11), and survivor (n = 1). Differences between fast and slow progression at individual time points were determined by one-way ANOVA. P-values ≤0.10 were included in black font and p-values ≤0.05 in red font. All means, confidence intervals and p-values are included in Table 6. JMP fit model was used to test the effect of hematology with time (day -7, 24 h, 36 h and 48 h) and progression (fast vs slow). P-value for time overall (TO) and progression overall (PO) is given. Basophils (Baso), eosinophils (Eos) large unstained cells (LUC), monocytes (Mono), neutrophils (Neu), lymphocytes (Lymph), neutrophil lymphocyte ratio (NL Ratio), white blood cells (WBC), red blood cells (RBC), hemoglobin (Hgb), hematocrit (Hct), corpuscular hemoglobin concentration mean (CHCM), mean corpuscular hemoglobin (MCH), mean corpuscular hemoglobin concentration (MCHC), platelets (PLT), mean platelet volume (MPV), mean corpuscular volume (MCV), red cell distribution width (RDW).
Fig 7
Fig 7. Proposed relationship of toxemia-defined progression with clinical staging.
The triphasic (TP) kinetics of anthrax toxemia with slow progression in non-human primates mirrors the clinical staging algorithm. A brief incubation period is followed by 1) the early-prodromal stage 1 with the onset of non-specific symptoms which coincides with the early rise in toxemia to the end-of-phase-1 (EOP1). This is followed by 2) the intermediate-progressive stage which coincides with the plateau/decline in toxemia that continues to the end-of-phase-2 (EOP2) when the critical toxemic thresholds are exceeded, which coincides with entry to 3) the late-fulminant stage with a rapid decline in clinical stability and rapid rise in toxemia/bacteremia. Fast progression occurs over a compressed timeline during which the phase-2 plateau may (fast triphasic-TP) or may not be observed (fast monophasic-MP) kinetics. The dependence of progression on toxemia can be seen with the shorter time-to-threshold for fast progression than slow and the similar time from threshold-to-terminal for both. Progression may be reoriented from time/clinical-dependent staging to toxin/clinical-dependent staging.

References

    1. Helgason E, Okstad OA, Caugant DA, Johansen HA, Fouet A, Mock M, et al. Bacillus anthracis, Bacillus cereus, and Bacillus thuringiensis—one species on the basis of genetic evidence. Appl Environ Microbiol. 2000;66(6):2627–30. doi: 10.1128/AEM.66.6.2627-2630.2000 ; PubMed Central PMCID: PMC110590. - DOI - PMC - PubMed
    1. Goel AK. Anthrax: A disease of biowarfare and public health importance. World J Clin Cases. 2015;3(1):20–33. doi: 10.12998/wjcc.v3.i1.20 ; PubMed Central PMCID: PMC4295216. - DOI - PMC - PubMed
    1. Brachman PS. Inhalation anthrax. Ann N Y Acad Sci. 1980;353:83–93. doi: 10.1111/j.1749-6632.1980.tb18910.x . - DOI - PubMed
    1. Friedlander AM. Anthrax. In: Zajtchuk R, editor. Textbook of Military Medicine: Medical Aspects of Chemical and Biological Warfare. 5. Washington, D.C.: Office of The Surgeon General; 1997. p. 467–78.
    1. Holty JE, Bravata DM, Liu H, Olshen RA, McDonald KM, Owens DK. Systematic review: a century of inhalational anthrax cases from 1900 to 2005. Ann Intern Med. 2006;144(4):270–80. doi: 10.7326/0003-4819-144-4-200602210-00009 . - DOI - PubMed

Publication types

Substances

Supplementary concepts