. 2022 Dec 27;119(52):e2215799119.
doi: 10.1073/pnas.2215799119. Epub 2022 Dec 19.

Multi-color live-cell STED nanoscopy of mitochondria with a gentle inner membrane stain

Affiliations

Multi-color live-cell STED nanoscopy of mitochondria with a gentle inner membrane stain

Tianyan Liu et al. Proc Natl Acad Sci U S A. .

Abstract

Capturing mitochondria's intricate and dynamic structure poses a daunting challenge for optical nanoscopy. Different labeling strategies have been demonstrated for live-cell stimulated emission depletion (STED) microscopy of mitochondria, but orthogonal strategies are yet to be established, and image acquisition has suffered either from photodamage to the organelles or from rapid photobleaching. Therefore, live-cell nanoscopy of mitochondria has been largely restricted to two-dimensional (2D) single-color recordings of cancer cells. Here, by conjugation of cyclooctatetraene (COT) to a benzo-fused cyanine dye, we report a mitochondrial inner membrane (IM) fluorescent marker, PK Mito Orange (PKMO), featuring efficient STED at 775 nm, strong photostability, and markedly reduced phototoxicity. PKMO enables super-resolution (SR) recordings of IM dynamics for extended periods in immortalized mammalian cell lines, primary cells, and organoids. Photostability and reduced phototoxicity of PKMO open the door to live-cell three-dimensional (3D) STED nanoscopy of mitochondria for 3D analysis of the convoluted IM. PKMO is optically orthogonal with green and far-red markers, allowing multiplexed recordings of mitochondria using commercial STED microscopes. Using multi-color STED microscopy, we demonstrate that imaging with PKMO can capture interactions of mitochondria with different cellular components such as the endoplasmic reticulum (ER) or the cytoskeleton, Bcl-2-associated X protein (BAX)-induced apoptotic process, or crista phenotypes in genetically modified cells, all at sub-100 nm resolution. Thereby, this work offers a versatile tool for studying mitochondrial IM architecture and dynamics in a multiplexed manner.

Keywords: STED nanoscopy; cristae; mitochondria.


Conflict of interest statement

The authors declare competing interest. The authors have organizational affiliations to disclose, Z.C. is an inventor of the patent on the mitochondria dye described in this work (CN 202010492298.8). The patent was applied through Peking University and is currently transferred to Genvivo Tech (in which Z.C. is a founder and shareholder) for commercialization.

Figures

Fig. 1.
Fig. 1.
PKMO is a cyclooctatetraene-conjugated Cy3.5, featuring excellent photostability and remarkably low singlet oxygen generation. A. Chemical structures of PKMO and a benzoate-derived control compound. B. Absorption and fluorescence spectra of PKMO in orange–red channel. The fluorescence can be potentially depleted using a 775-nm laser. C. Singlet oxygen quantum yields of PKMO and PKMO 0.9 measured using 1,3-diphenylisobenzofuran (DPBF) decay assay in acetonitrile. TMRE in MeOH (ΦΔ= 0.012) was selected as a standard. D. Viability of PKMO (1 μM)- and PKMO 0.9 (0.65 μM)-stained HeLa cells after green LED light illumination (543-nm, 2.6 W/cm2). >500 cells were examined in each time point of the three independent experiments.
Fig. 2.
Fig. 2.
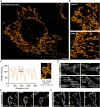
PKMO enables long time-lapse nanoscopic recordings of mitochondrial cristae in COS-7 cells with minimal phototoxicity. A. 2D-STED recording of mitochondrial cristae of a COS-7 cell labeled with PKMO. (Scale bar, 10 μm.) B. Magnified images of the white boxed areas (i, ii) in A. C. Fluorescence intensity line profiles measured as indicated in the magnified view of white boxed area in B. D. Time-lapse recordings of live COS-7 cell labeled with PKMO and PKMO 0.9; PKMO maintained both fluorescent signal and mitochondrial morphology during 30 frames of STED recording, while PKMO 0.9 caused visible mitochondrial swelling after 10 frames. E. Time-lapse STED nanoscopy recordings highlighting mitochondrial tubulation. (Scale bar, 1 μm.) F. Time-lapse STED nanoscopy recordings showing mitochondrial network dynamics such as fusion and fission. (Scale bar, 1 μm.) All the image data were deconvoluted and image series were corrected for photobleaching.
Fig. 3.
Fig. 3.
3D-STED imaging and reconstruction of cristae in COS-7 cells labeled with PKMO. A and B. 3D live-cell STED recording of a mitochondrion from a COS-7 cell labeled with PKMO. A. Orthogonal cross-sections through 3D STED recording. (Scale bars, 500 nm.) B. 3D reconstruction/volume rendering of 3D STED data (Imaris).
Fig. 4.
Fig. 4.
PKMO as a general mitochondrial crista probe enables STED recordings on different cell lines, primary cells, and tissue. A. STED overview image (Left) of live HeLa cells labeled with PKMO and magnified view (Right) of the orange boxed area. (Scale bar, overview 5 μm, Inset 2 μm.) B. Confocal image of mitochondria labeled with PKMO in U-2 OS cell (Left) and magnified view of the dashed boxes in STED mode (Right). (Scale bar, overview 5 μm, Inset 2 μm.) C. STED images of mitochondria labeled with PKMO in primary brown adipocytes (pBAcs). Confocal image of the mitochondria of pBAc (Left) and magnified views or time-lapse recordings of the corresponding dashed boxes (i, ii, and iii) in the overview (Right and lower panel). (Scale bar, overview 5 μm, Insets 1 μm.) D. Confocal image of mitochondria labeled with PKMO in primary hippocampal neurons (Left) and magnified STED image of the dendrite in the boxed region (Right). (Scale bar, overview 5 μm, Inset 2 μm.) E. Dual-color confocal image (Left) of mitochondria (magenta, PKMO) and beta cells (green, Ins-GCaMP6f) in the primary islet tissue and magnified STED images (Right) of the corresponding orange boxed region (i and ii). (Scale bar, overview 5 μm, Inset 1 μm.) F. Summary of crista spacing in primary cells and cultivated cancer cells. All STED data were deconvoluted and image series were corrected for photobleaching.
Fig. 5.
Fig. 5.
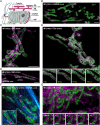
PKMO in conjunction with fluorogenic rhodamine probes enables nanoscopic mapping of mitochondria and the analysis of mito-organelle interactions using multi-color STED nanoscopy. A. Labeling strategies for multi-color live-cell recordings of mitochondria. Cartoon demonstrating the labeling strategies for mitochondrial subcompartments and for mitochondria-interacting cellular structures. Abbreviations: ER (endoplasmic reticulum); IM (inner mitochondrial membrane); OM (outer mitochondrial membrane); CJs (crista junctions), mtDNA (mitochondrial DNA). BG. Multi-color live-cell STED nanoscopy of HeLa and COS-7 cells labeled for the IM together with different mitochondrial targets or subcellular structures. IM was labeled using PKMO and recorded by live-cell STED nanoscopy (λex = 561 nm, λSTED = 775 nm). B. 2D single-color STED nanoscopy of mitochondria labeled for mtDNA. The mtDNA was stained using PicoGreen and was recorded in the confocal mode (λex = 488 nm). C and D. Dual-color STED nanoscopy of mitochondria in COS-7 cells. OM marker TOM20-Halo was labeled using 647-SiR-CA (λex = 640 nm, λSTED = 775 nm). Cells were recorded by 2D STED in (C) or 3D STED nanoscopy (D). E. 2D dual-color time-lapse STED nanoscopy of mitochondria in HeLa cells. CJs were labeled by overexpression of MIC10-SNAP and staining with SNAP-Cell 647-SiR. Insets (Lower panel) shows four consecutive frames illustrating cristae and CJ dynamics. F. 2D dual-color STED nanoscopy of mitochondria and microtubules in HeLa cells. Microtubules were labeled using 4-610CP-CTX (λex = 640 nm, λSTED = 775 nm). MtDNA was labeled using PicoGreen. Inset highlights contact sites of mitochondria and microtubules. G. 2D dual-color time-lapse STED nanoscopy of mitochondria and ER in HeLa cells. ER was labeled by overexpression of Halo-KDEL and staining with 647-SiR-CA. Insets (Lower panel) highlights contact sites of a mitochondrion and ER over several time points. If not indicated otherwise, all image data were deconvoluted and corrected for photobleaching. (Scale bars, 2 µm.)
Fig. 6.
Fig. 6.
Live-cell STED nanoscopy of apoptotic cells. HeLa cells labeled with PKMO (250 nM, 45 min) were transfected with mEGFP-BAX to induce apoptosis. Cells were recorded 4 to 6 h after transfection. PKMO was recorded using STED, and mEGFP-BAX was recorded in the confocal mode. Left: Overview recording, showing two cells expressing different amounts of mEGFP-BAX (magenta). Right: Time-lapse recording of the area indicated by the dashed box. Shown are four consecutive frames. Arrows indicate mitochondria that undergo severe changes of the crista morphology, once mEGFP-BAX clusters appeared along the mitochondria. Scale bars, 5 µm (overview), 1.5 µm (Inset).
Fig. 7.
Fig. 7.
Analysis of crista architecture using PKMO labeling and 2D live-cell STED nanoscopy. AC. The mitochondrial inner membrane (IM) of HeLa cells was labeled using PKMO (λex = 561 nm, λSTED = 775 nm). MtDNA was labeled using PicoGreen (λex = 488 nm, confocal). A. STED (Upper) and transmission electron microscopy (TEM) recording (Lower) of wild-type HeLa cells with typical lamellar crista architecture. B. STED (Upper) and TEM recording (Lower) of genome-edited HeLa cells lacking MIC10, a subunit of the mitochondrial contact site and crista organizing system (MICOS complex). STED nanoscopy reveals tube-like and onion-like crista arrangements and a disturbed arrangement of the mtDNA. C. STED (Upper) and TEM recording (Lower) of genome-edited HeLa cells lacking MIC60, the core subunit of MICOS. STED nanoscopy reveals a fragmented mitochondrial network, onion-like crista arrangements, and aggregations of mtDNA. All STED data were deconvoluted. Scale bars, STED (overview) 5 µm, STED (Insets) 1 µm, TEM 1 µm.

References

    1. Friedman J. R., Nunnari J., Mitochondrial form and function. Nature 505, 335–343 (2014). - PMC - PubMed
    1. Osellame L. D., Blacker T. S., Duchen M. R., Cellular and molecular mechanisms of mitochondrial function. Best Pract. Res. Clin. Endocrinol. Metab. 26, 711–723 (2012). - PMC - PubMed
    1. Jakobs S., Stephan T., Ilgen P., Brüser C., Light microscopy of mitochondria at the nanoscale. Annu. Rev. Biophys. 49, 289–308 (2020). - PMC - PubMed
    1. Palade G. E., The fine structure of mitochondria. Anat. Rec. 114, 427–451 (1952). - PubMed
    1. SjÖStrand F. S., Electron microscopy of mitochondria and cytoplasmic double membranes: Ultra-structure of rod-shaped mitochondria. Nature 171, 30–31 (1953). - PubMed

Publication types

Substances