. 2023 May 22;119(5):1265-1278.
doi: 10.1093/cvr/cvac193.

Endothelial PTP4A1 mitigates vascular inflammation via USF1/A20 axis-mediated NF-κB inactivation

Affiliations

Endothelial PTP4A1 mitigates vascular inflammation via USF1/A20 axis-mediated NF-κB inactivation

Min Ji Cho et al. Cardiovasc Res. .

Abstract

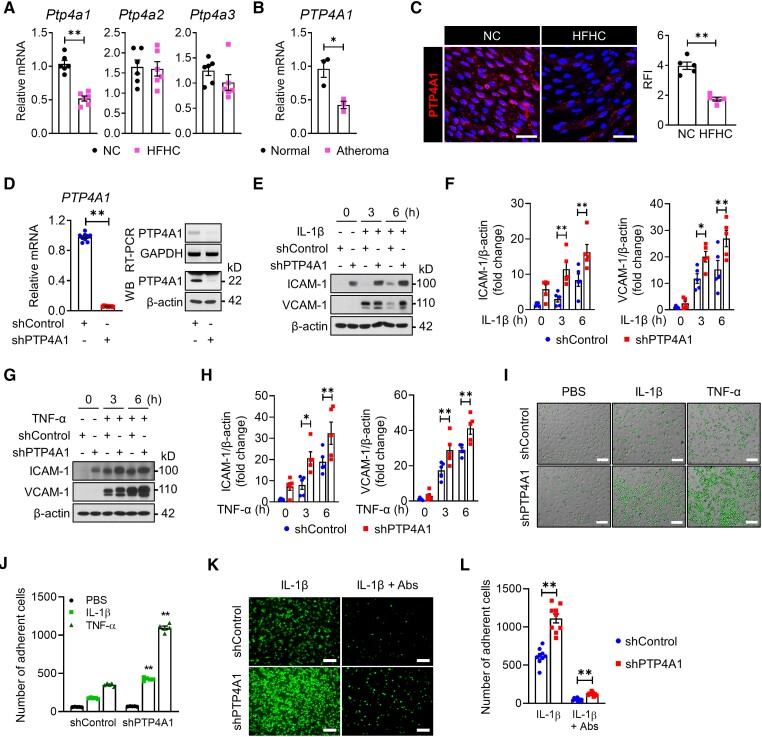
Aims: The nuclear factor-κB (NF-κB) signalling pathway plays a critical role in the pathogenesis of multiple vascular diseases. However, in endothelial cells (ECs), the molecular mechanisms responsible for the negative regulation of the NF-κB pathway are poorly understood. In this study, we investigated a novel role for protein tyrosine phosphatase type IVA1 (PTP4A1) in NF-κB signalling in ECs.

Methods and results: In human tissues, human umbilical artery ECs, and mouse models for loss of function and gain of function of PTP4A1, we conducted histological analysis, immunostaining, laser-captured microdissection assay, lentiviral infection, small interfering RNA transfection, quantitative real-time PCR and reverse transcription-PCR, as well as luciferase reporter gene and chromatin immunoprecipitation assays. Short hairpin RNA-mediated knockdown of PTP4A1 and overexpression of PTP4A1 in ECs indicated that PTP4A1 is critical for inhibiting the expression of cell adhesion molecules (CAMs). PTP4A1 increased the transcriptional activity of upstream stimulatory factor 1 (USF1) by dephosphorylating its S309 residue and subsequently inducing the transcription of tumour necrosis factor-alpha-induced protein 3 (TNFAIP3/A20) and the inhibition of NF-κB activity. Studies on Ptp4a1 knockout or transgenic mice demonstrated that PTP4A1 potently regulates the interleukin 1β-induced expression of CAMs in vivo. In addition, we verified that PTP4A1 deficiency in apolipoprotein E knockout mice exacerbated high-fat high-cholesterol diet-induced atherogenesis with upregulated expression of CAMs.

Conclusion: Our data indicate that PTP4A1 is a novel negative regulator of vascular inflammation by inducing USF1/A20 axis-mediated NF-κB inactivation. Therefore, the expression and/or activation of PTP4A1 in ECs might be useful for the treatment of vascular inflammatory diseases.

Keywords: Atherosclerosis; Cell adhesion molecules; Endothelial cells; Protein phosphatase; Vascular inflammation.


Conflict of interest statement

Conflict of interest: None declared.

Figures

Graphical Abstract
Graphical Abstract
Figure 1
Figure 1
Downregulation of PTP4A1 increases the expression levels of ICAM-1 and VCAM-1 on endothelial cells. (A) The mRNA level of Ptp4a1–3 was measured via qRT-PCR analysis in the aorta of 8-week-old ApoE−/− mice fed an NC or HFHC diet for 2 weeks (n = 6). (B) The mRNA levels of PTP4A1 were assessed via qRT-PCR in the human artery wall with or without atheroma (n = 3). (C) Representative en face immunostaining confocal images for the PTP4A1 protein (red) on the endothelium of the descending aorta from 8-week-old C57BL/6 mice (n = 5 mice per group) fed an NC or HFHC diet for 2 weeks. The nuclei were stained with DAPI. Scale bars, 50 μm. RFI was compared between the groups (right panel). (D) Downregulation of PTP4A1 was evaluated via qRT-PCR, RT-PCR, and immunoblot analysis (n = 9). PTP4A1 protein levels in lysates of shControl- or shPTP4A1-treated HUAECs were determined via western blot analysis after immunoprecipitation by PTP4A1 antibody. β-actin in whole-cell lysates served as a loading control. (E–H) shControl- and shPTP4A1-treated HUAECs were stimulated with IL-1β (E and F) or TNF-α (G and H). The ICAM-1 and VCAM-1 expression levels in the cell lysates were determined via immunoblot analysis. Bar diagrams represent normalized protein levels (n = 5). (I and J) Representative images (I) and a quantification graph (J) of the monocyte adhesion assay in shControl- or shPTP4A1-treated HUAECs after treatment with PBS, IL-1β, or TNF-α for 3 h (n = 5). Scale bars, 25 μm. (K and L) Representative images (K) and a quantification graph (L) of the monocyte adhesion assay with or without the neutralization of ICAM-1 and VCAM-1 (n = 9). Scale bars, 25 μm. All data are expressed as mean ± S.E.M. *P < 0.05 and **P < 0.01 (Mann–Whitney U test for A–C; two-tailed Student’s t-test for D; two-way ANOVA for F, H, J, and L).
Figure 2
Figure 2
PTP4A1 deficiency enhances IL-1β-mediated expression of ICAM-1 and VCAM-1 in the vasculature of mice. (A–F) Ptp4a1+/+ and Ptp4a1−/− mice (8 weeks old) were intraperitoneally injected with PBS or IL-1β (2 μg/20 g for 8 h). (A and B) Representative en face immunostaining confocal images (left) and quantification of the RFI (right) of ICAM-1 (A) and VCAM-1 (B) in the endothelium of the descending aorta from Ptp4a1+/+ and Ptp4a1−/− male mice (n = 5 mice per group). CD144 was stained as an endothelial cells marker. Scale bars, 50 μm. (C) qRT-PCR analysis of ICAM-1 (left) and VCAM-1 (right) mRNA levels in the aortas of Ptp4a1+/+ and Ptp4a1−/− male mice (n = 6 mice per group). (D and E) Representative immunostaining (D) and quantification of RFI (E) of ICAM-1 and VCAM-1 on the pulmonary vasculature (n = 5). Scale bars, 150 μm. (F) qRT-PCR analysis of ICAM-1 (left) and VCAM-1 (right) mRNA levels in the lungs of Ptp4a1+/+ and Ptp4a1−/− male mice (n = 5 mice per group). All data are expressed as mean ± S.E.M. *P < 0.05 and **P < 0.01 (two-way ANOVA for A–C, E, and F).
Figure 3
Figure 3
Deletion of PTP4A1 accelerates the development of atherosclerosis in ApoE−/− mice. (A–H) ApoE−/− and ApoE−/− Ptp4a1−/− littermate mice were fed an HFHC diet for 8 weeks. (A) Representative images of atherosclerotic plaques on the aortic arch (n = 9–11). Scale bars, 0.2 cm. (B) Representative en face images of Oil-Red-O-stained aorta (left) and quantification of plaque area (%) on the whole aorta (right) (n = 9–11). (C) Representative Oil-Red-O-stained plaque images of aortic sinuses (left). Scale bars, 500 μm. Quantification of lesion areas of atherosclerotic plaques on the aortic sinus (right) (n = 8 mice per group). (D) Immunostaining of adhesion molecules (ICAM-1 and VCAM-1) and macrophages (MOMA-2) on the aortic sinus (n = 7–8 mice per group). Nuclei were stained with DAPI. Scale bars, 200 μm. Quantification of ICAM-1 (RFI), VCAM-1 (RFI), and macrophages (percentage of positive area) in atherosclerotic lesions. (E and F) Expression analysis of plaque-specific genes via LCM and qRT-PCR. Representative images (E) of H&E-stained aortic sinuses. Scale bars, 250 μm. Red-dotted lines indicate the plaques captured using LCM. The mRNA levels (F) of Icam-1, Vcam-1, F4/80, and Ptp4a1 on laser-captured plaques of aortic sinuses (n = 5 mice per group). (G) Plasma levels of T-chol, LDL-C, and HDL-C in ApoE−/− and ApoE−/− Ptp4a1−/− mice fed an HFHC diet for 0 and 8 weeks (n = 12 mice per group). (H) The levels of MCP-1 and TNF-α in plasma were quantified via ELISA in ApoE−/− and ApoE−/− Ptp4a1−/− mice fed an HFHC diet for 0 and 8 weeks (n = 7–12 per group). All data are expressed as mean ± S.E.M. *P < 0.05 and **P < 0.01 (Mann–Whitney U test for B, C, D, and F; two-way ANOVA for G and H).
Figure 4
Figure 4
Phosphatase activity of PTP4A1 is required to inhibit the NF-κB-mediated expression of cell adhesion molecules. (A–H) HUAECs were stably transfected with shControl, shPTP4A1, mock or PTP4A1 using Lentivirus. (A) HUAECs were transiently transfected with a luciferase reporter plasmid of ICAM-1 or VCAM-1 and a Renilla luciferase internal control plasmid. The cells were stimulated with PBS or IL-1β, and luciferase activity was detected using the dual-luciferase assay system (n = 6). (B and C) HUAECs were stimulated with PBS or IL-1β for 2 h. Immunoblot analysis in cell lysates of shControl- or shPTP4A1-treated HUAECs (B) and bar diagrams representing normalized protein levels (n = 5) (C). (D) ChIP assays were performed to measure the binding activity of p-p65 to the promoters of ICAM-1 and VCAM-1 in shControl- or shPTP4A1-treated HUAECs stimulated with IL-1β for 2 h (n = 5). GAPDH was used as an internal control after immunoprecipitation by antibodies for RNA polymerase II (RNAP II, positive control) or IgG (negative control). (E) HUAECs were stimulated with PBS or IL-1β for 3 h after DMSO or PDTC treatment. Immunoblot analysis in cell lysates from shControl- or shPTP4A1-treated HUAECs. Bar diagrams representing normalized protein levels (n = 5). (F) Scheme for WT PTP4A1, DN-PTP4A1 (defective phosphatase activity; D74A plus C104S point mutations), and ΔCAAX (a truncated PTP4A1 at the prenylation motif). (G and H) HUAECs were stimulated with PBS or IL-1β. (G) Immunoblot analysis on cell lysates from mock-, PTP4A1-, or DN-PTP4A1-treated HUAECs. Bar diagrams representing normalized protein levels (n = 5). (H) Immunoblot analysis in cell lysates from mock-, PTP4A1-, or ΔCAAX-treated HUAECs. Bar diagrams representing normalized protein levels (n = 5). All data are expressed as mean ± S.E.M. *P < 0.05 and **P < 0.01 (two-way ANOVA for A, C, E, G, and H; two-tailed Student’s t-test for D).
Figure 5
Figure 5
PTP4A1 negatively regulates NF-κB transcriptional activity by controlling the A20 expression. (A–J) HUAECs were stably transfected with shControl, shPTP4A1, mock, PTP4A1, or DN-PTP4A1 using Lentivirus. (A) Immunoblot analysis in cell lysates of shControl- or shPTP4A1-treated HUAECs stimulated by IL-1β for the indicated times. Bar diagrams representing normalized protein levels (n = 5). (B–E) HUAECs were stimulated with PBS or IL-1β for 2 h. Immunoblot analysis in cell lysates from shControl- or shPTP4A1-treated HUAECs (B) and bar diagrams representing normalized protein levels (n = 5) (C). Immunoblot analysis in cell lysates from mock or PTP4A1-overexpressing HUAECs (D) and bar diagrams representing normalized protein levels (n = 5) (E). (F) Mock or PTP4A1 HUAECs were transfected with control siRNA or A20 siRNA (siA20) before PBS or IL-1β treatment for 3 h. Immunoblot analysis in cell lysates from mock or PTP4A1 HUAECs. Bar diagrams representing normalized protein levels (n = 5). (G and H) Stable HUAECs were stimulated with PBS or IL-1β for 2 h. The mRNA levels of A20 were detected via RT-PCR (G) and qRT-PCR (H) analysis in shControl- or shPTP4A1-treated HUAECs (n = 5). GAPDH was used as a loading control. (I and J) A20 luciferase reporter assays in shControl- or shPTP4A1-treated HUAECs (n = 5) (I) and A20 luciferase reporter assays in mock, PTP4A1, or DN-PTP4A1 HUAECs (n = 6) (J). All data are expressed as mean ± S.E.M. *P < 0.05 and **P < 0.01 (two-way ANOVA for A, C, E, F, H, I, and J).
Figure 6
Figure 6
PTP4A1 increases the activity of USF1 for A20 transcription. (A) A20 luciferase reporter assays in USF1 with PTP4A1- or DN-PTP4A1-overexpressing HUAECs stimulated with PBS or IL-1β for 4 h (n = 6). (B) A20 luciferase reporter assays in mock- or PTP4A1-overexpressing HUAECs treated with control siRNA or USF1 siRNA (siUSF1). Cells were stimulated with PBS or IL-1β for 4 h (n = 6). (C and D) HUAECs were stimulated with PBS or IL-1β for 3 h. Immunoblot analysis in cell lysates from mock- or PTP4A1-overexpressing HUAECs treated with siControl or siUSF1 (C). Bar diagrams representing normalized protein levels (n = 5) (D). (E) ChIP assay for PTP4A1-mediated USF1-binding activity on the E-box of the A20 promoter in PBS- or IL-1β-stimulated 293 T cells for 1 h (n = 5). qRT-PCR data (top) and RT-PCR (bottom) are presented. (F) ChIP assay for USF1-binding activity on the E-box of the A20 promoter in the presence of PTP4A1 or DN-PTP4A1. Two hundred and ninety-three T cells were stimulated with PBS or IL-1β for 1 h (n = 5). qRT-PCR data (top) and RT-PCR (bottom) are presented. All data are expressed as mean ± S.E.M. *P < 0.05 and **P < 0.01 (two-way ANOVA for A, B, D, E, and F).
Figure 7
Figure 7
PTP4A1 increases A20 transcription by dephosphorylating the Ser residue at 309 on USF1. (A) ChIP assay for USF1 or PTP4A1-binding activity on the A20 promoter region in 293 T cells (n = 5). qRT-PCR data (top) and RT-PCR (bottom) are presented. (B) Co-IP of flag-PTP4A1 with WT HA-USF1 or truncated forms in 293 T cells. Data were obtained from five independent experiments. (C) A20 luciferase reporter assays in HUAECs transfected with A20 luciferase reporter plasmids and Renilla luciferase internal control plasmids, as well as PTP4A1 with the indicated USF1 constructs. Cells were stimulated with PBS or IL-1β for 4 h (n = 5). (D) A20 luciferase reporter assays with USF1 constructs (WT, S309A, S309D) in parental or PTP4A1-overexpressing HUAECs. The cells were stimulated with PBS or IL-1β for 4 h (n = 5). (E) ChIP assay for USF1 (WT, S309A, S309D)-binding activity on the A20 promoter region in PBS- or IL-1β-stimulated 293 T cells for 1 h (n = 5). qRT-PCR data (top) and RT-PCR (bottom) are presented. All data are expressed as mean ± S.E.M. *P < 0.05 and **P < 0.01 (two-way ANOVA for A, C, D, and E).

References

    1. Libby P. Inflammation in atherosclerosis. Arterioscler Thromb Vasc Biol 2012;32:2045–2051. - PMC - PubMed
    1. Ley K, Laudanna C, Cybulsky MI, Nourshargh S. Getting to the site of inflammation: the leukocyte adhesion cascade updated. Nat Rev Immunol 2007;7:678–689. - PubMed
    1. Cotran RS, Mayadas-Norton T. Endothelial adhesion molecules in health and disease. Pathol Biol 1998;46:164–170. - PubMed
    1. Park JG, Ryu SY, Jung IH, Lee YH, Kang KJ, Lee MR, Lee MN, Sonn SK, Lee JH, Lee H, Oh GT, Moon K, Shim H. Evaluation of VCAM-1 antibodies as therapeutic agent for atherosclerosis in apolipoprotein E-deficient mice. Atherosclerosis 2013;226:356–363. - PubMed
    1. Kitagawa K, Matsumoto M, Sasaki T, Hashimoto H, Kuwabara K, Ohtsuki T, Hori M. Involvement of ICAM-1 in the progression of atherosclerosis in APOE-knockout mice. Atherosclerosis 2002;160:305–310. - PubMed

Publication types