. 2022 Dec 19;20(2):112-128.
doi: 10.1123/jpah.2022-0464. Print 2023 Feb 1.

Status and Trends of Physical Activity Surveillance, Policy, and Research in 164 Countries: Findings From the Global Observatory for Physical Activity-GoPA! 2015 and 2020 Surveys

Andrea Ramírez VarelaPedro C HallalJuliana Mejía GruesoŽeljko PedišićDeborah SalvoAnita NguyenBojana KlepacAdrian BaumanKatja SiefkenErica HincksonAdewale L OyeyemiJustin RichardsElena Daniela Salih KhidirShigeru InoueShiho AmagasaAlejandra JaureguiMarcelo Cozzensa da SilvaI-Min LeeMelody DingHarold W KohlUlf EkelundGregory W HeathKenneth E PowellCharlie FosterAamir Raoof MemonAbdoulaye DoumbiaAbdul Roof RatherAbdur RazzaqueAdama DioufAdriano Akira HinoAlbertino DamascenoAlem Deksisa AbebeAlex Antonio FlorindoAlice MannocciAltyn AringazinaAndrea Backović JuričanAndrea PoffetAndrew DecelisAngela CarlinAngelica EnescuAngélica María Ochoa AvilésAnna KontsevayaAnnamaria SomhegyiAnne VuilleminAsmaa El HamdouchiAsse Amangoua ThéodoreBojan MasanovicBrigid M LynchCatalina MedinaCecilia Del CampoChalchisa AbdetaChanga MorewaysChathuranga RanasingheChristina HowittChristine CameronDanijel JurakićDavid Martinez-GomezDawn TladiDebrework Tesfaye DiroDeepti AdlakhaDušan MitićDuško BjelicaElżbieta BiernatEnock M ChisatiEstelle Victoria LambertEster CerinEun-Young LeeEva-Maria RisoFelicia Cañete VillalbaFelix AssahFranjo LovrićGerardo A Araya-VargasGiuseppe La TorreGloria Isabel Niño CruzGul BaltaciHaleama Al SabbahHanna NaleczHilde Liisa NashandiHyuntae ParkInés Revuelta-SánchezJackline Jema NusurupiaJaime Leppe ZamoraJaroslava KopcakovaJavier Brazo-SayaveraJean-Michel OppertJinlei NieJohn C SpenceJohn Stewart BradleyJorge MotaJosef MitášJunshi ChenKamilah S HyltonKarel FromelKaren MiltonKatja BorodulinKeita Amadou MoustaphaKevin Martinez-FolgarLara NasreddineLars Breum ChristiansenLaurent MalisouxLeapetswe MaleteLorelie C Grepo-JalaoLuciana Zaranza MonteiroLyutha K Al SubhiMaja DakskoblerMajed AlnajiMargarita Claramunt GarroMaria HagströmerMarie H MurphyMatthew MclaughlinMercedes Rivera-MoralesMickey ScheinowitzMimoza ShkodraMonika PiątkowskaMoushumi ChaudhuryNaif Ziyad AlrashdiNanette MutrieNiamh MurphyNorhayati Haji AhmadNour A ObeidatNubia Yaneth Ruiz GómezNucharapon LiangruenromOscar Díaz ArnestoOscar Flores-FloresOscar IncarboneOyun ChimeddambaPascal BovetPedro MagalhãesPekka JousilahtiPiyawat KatewongsaRafael Alexander Leandro GómezRawan Awni ShihabReginald OcanseyRéka VeressRichard MarineRolando Carrizales-RamosSaad Younis SaeedSaid El-AshkerSamuel GreenSandra KasomaSantiago BeretervideSe-Sergio BaldewSelby NicholsSelina KhooSeyed Ali HosseiniShifalika GoenkaShima GholamalishahiSoewarta KosenSofie CompernolleStefan Paul EnescuStevo PopovicSusan PaudelSusana AndradeSylvia TitzeTamu DavidsonTheogene DusingizimanaThomas E DornerTracy L Kolbe-AlexanderTran Thanh HuongVanphanom SychareunVera Jarevska-SimovskaViliami Kulikefu PulokaVincent OnyweraWanda Wendel-VosYannis DionyssiotisMichael Pratt

Status and Trends of Physical Activity Surveillance, Policy, and Research in 164 Countries: Findings From the Global Observatory for Physical Activity-GoPA! 2015 and 2020 Surveys

Andrea Ramírez Varela et al. J Phys Act Health. .

Abstract

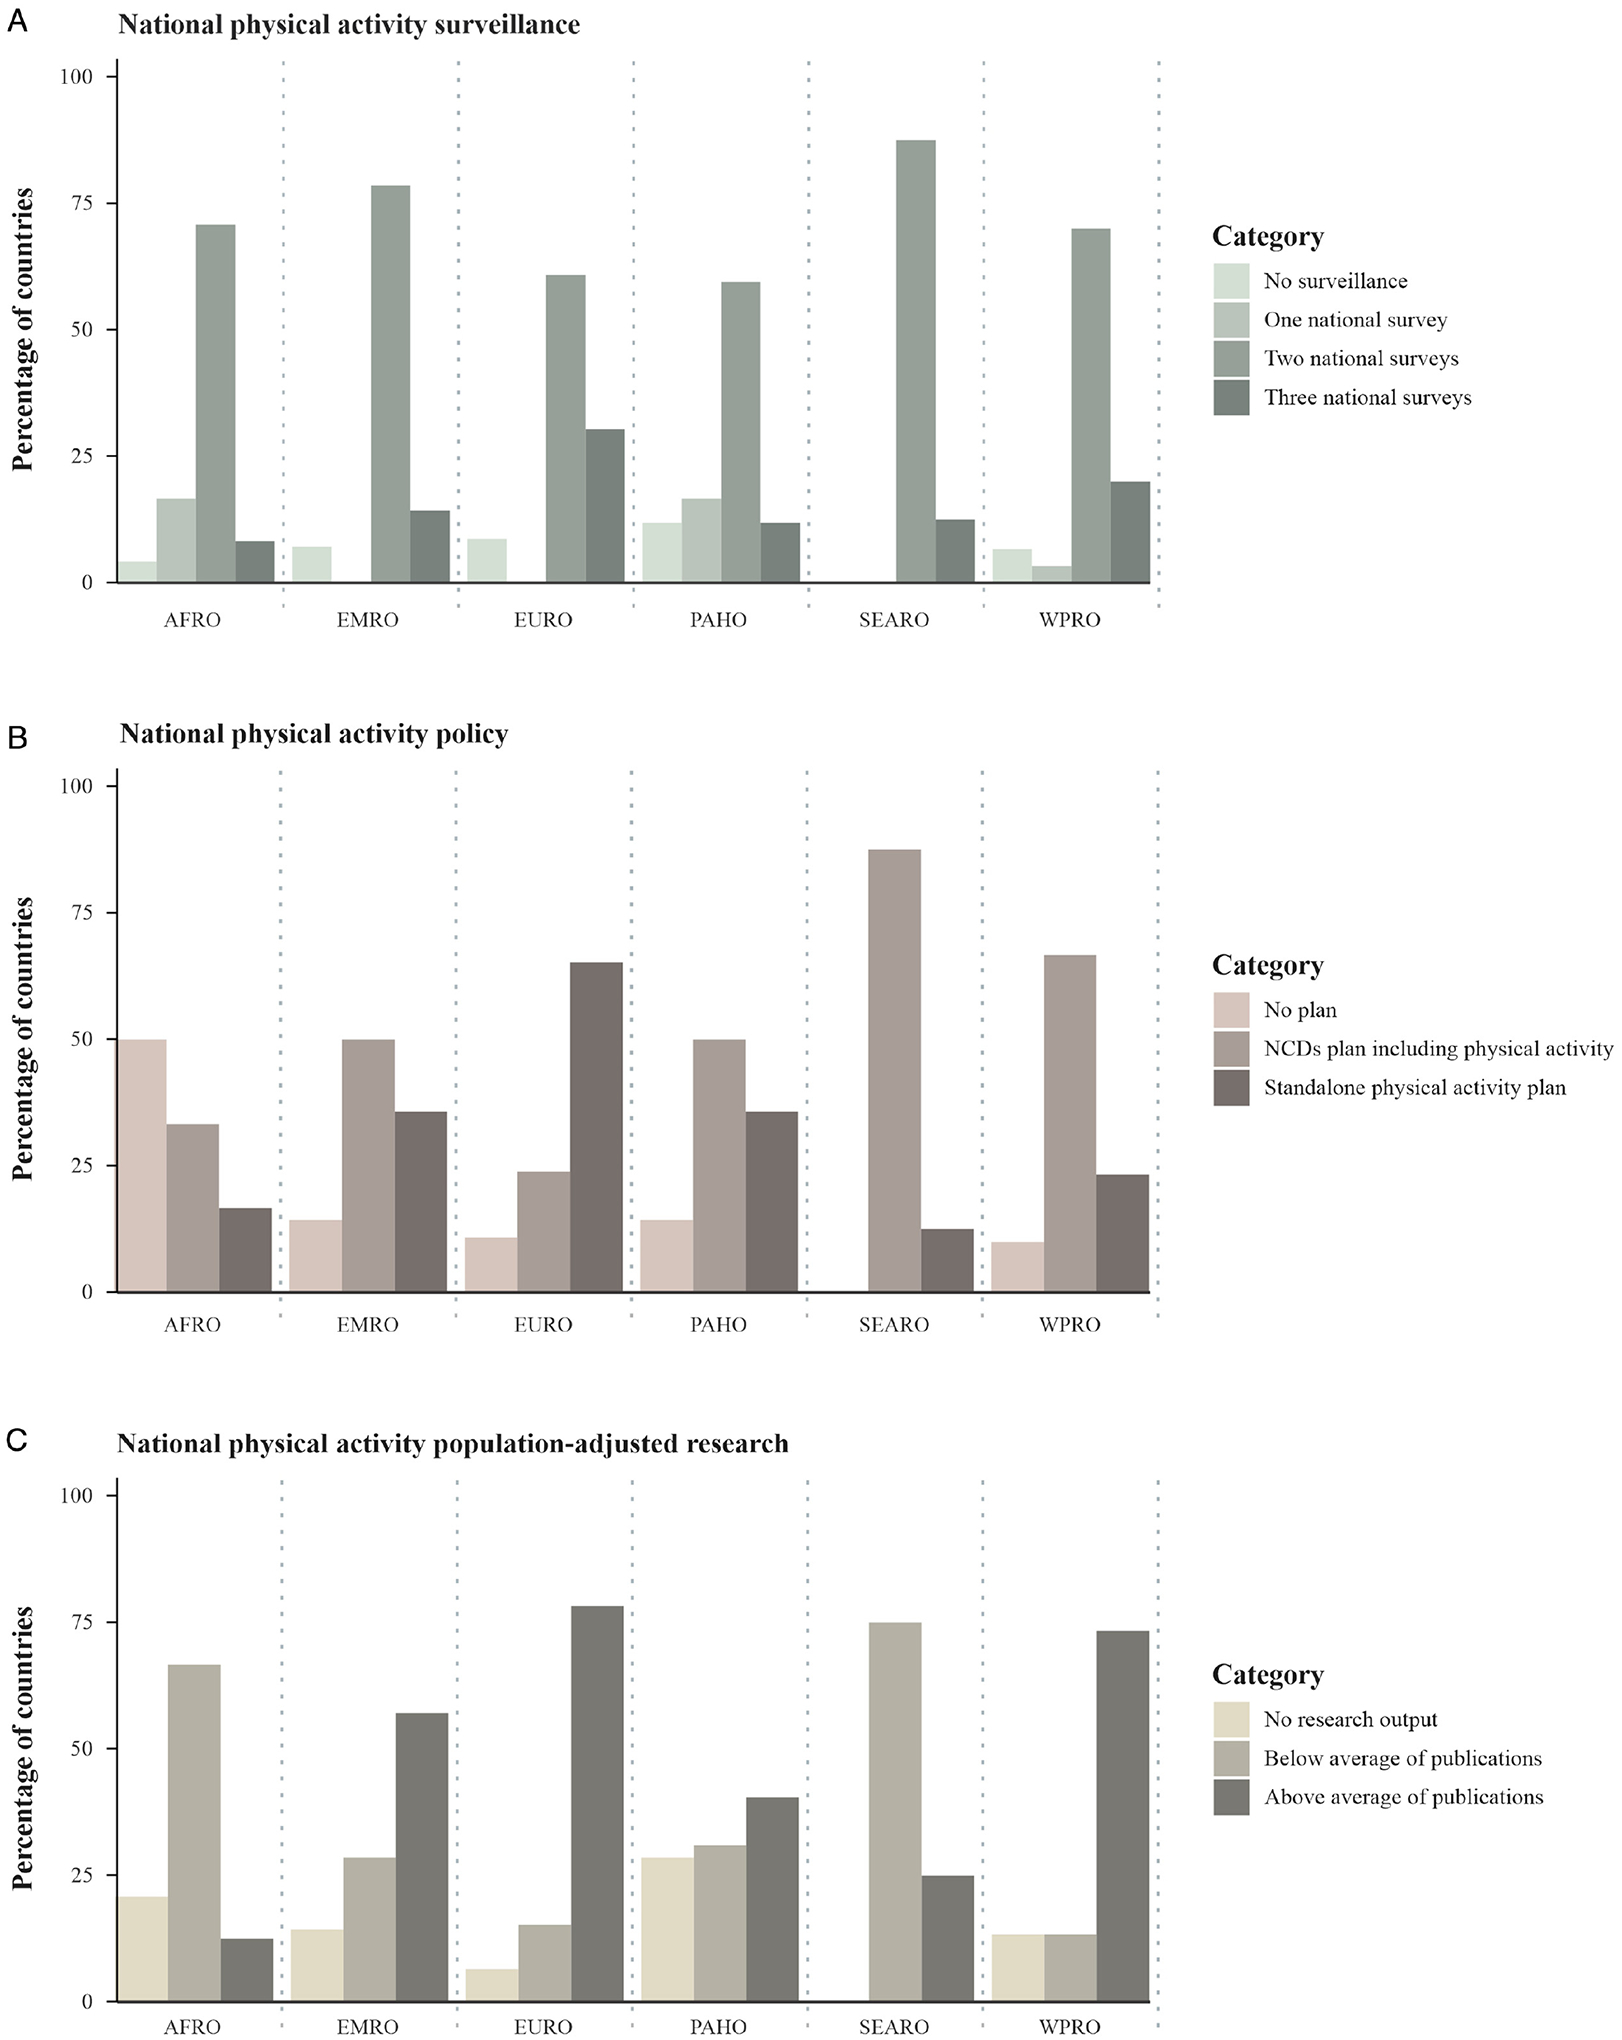
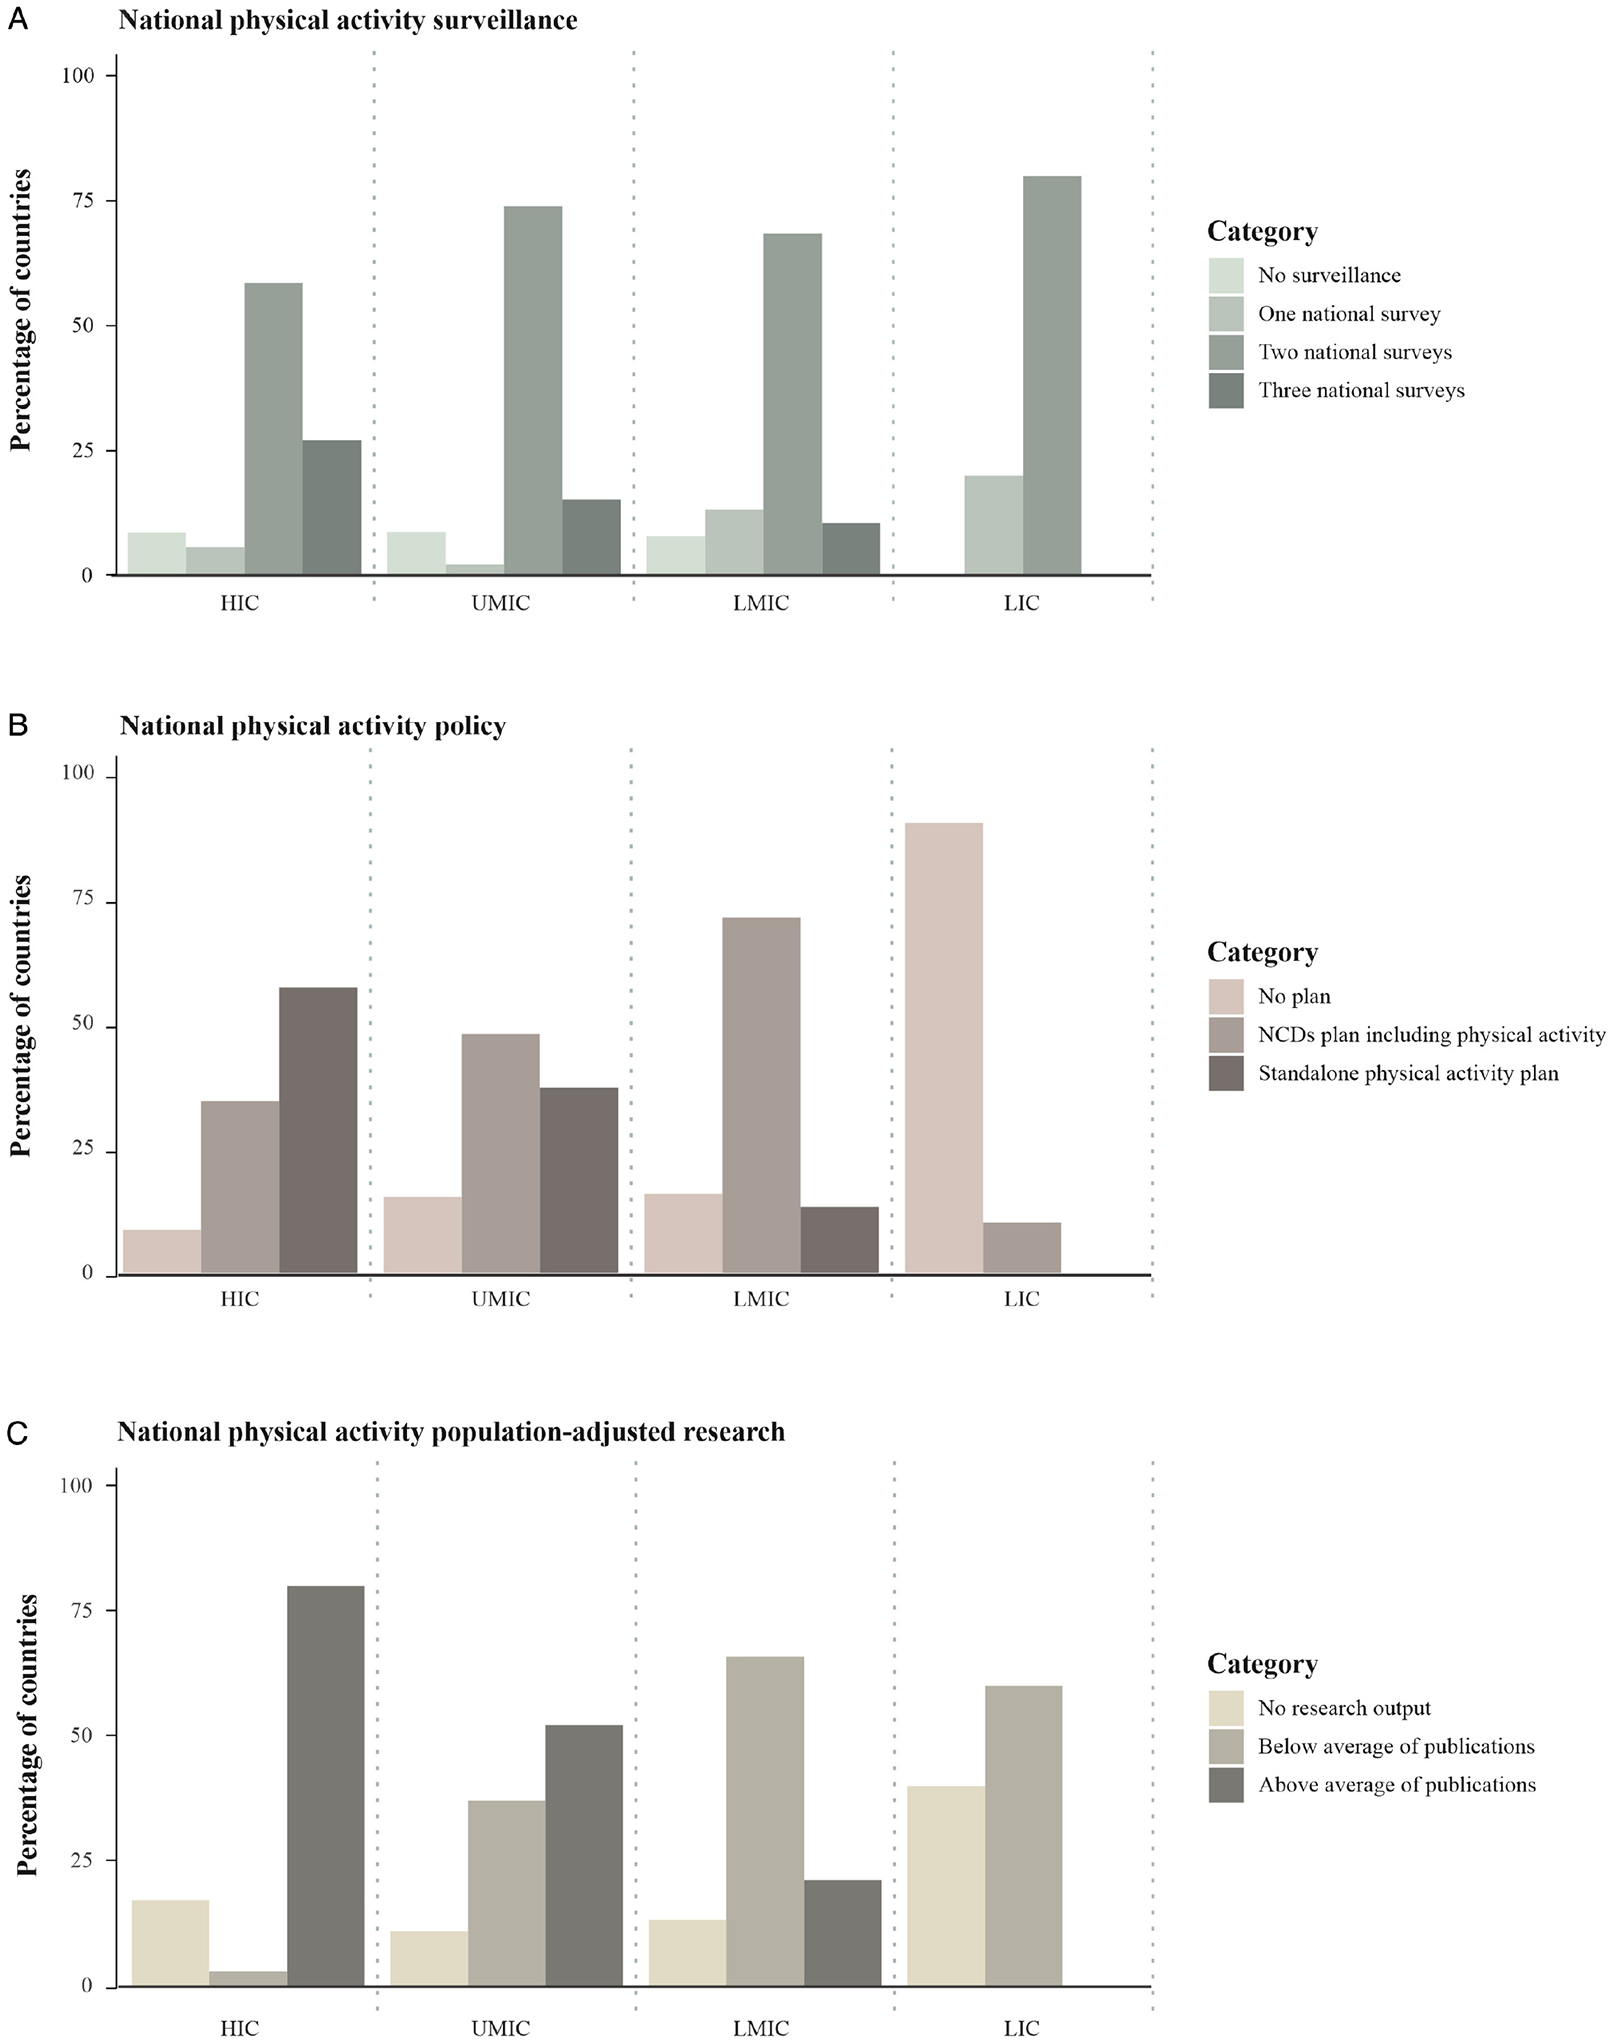
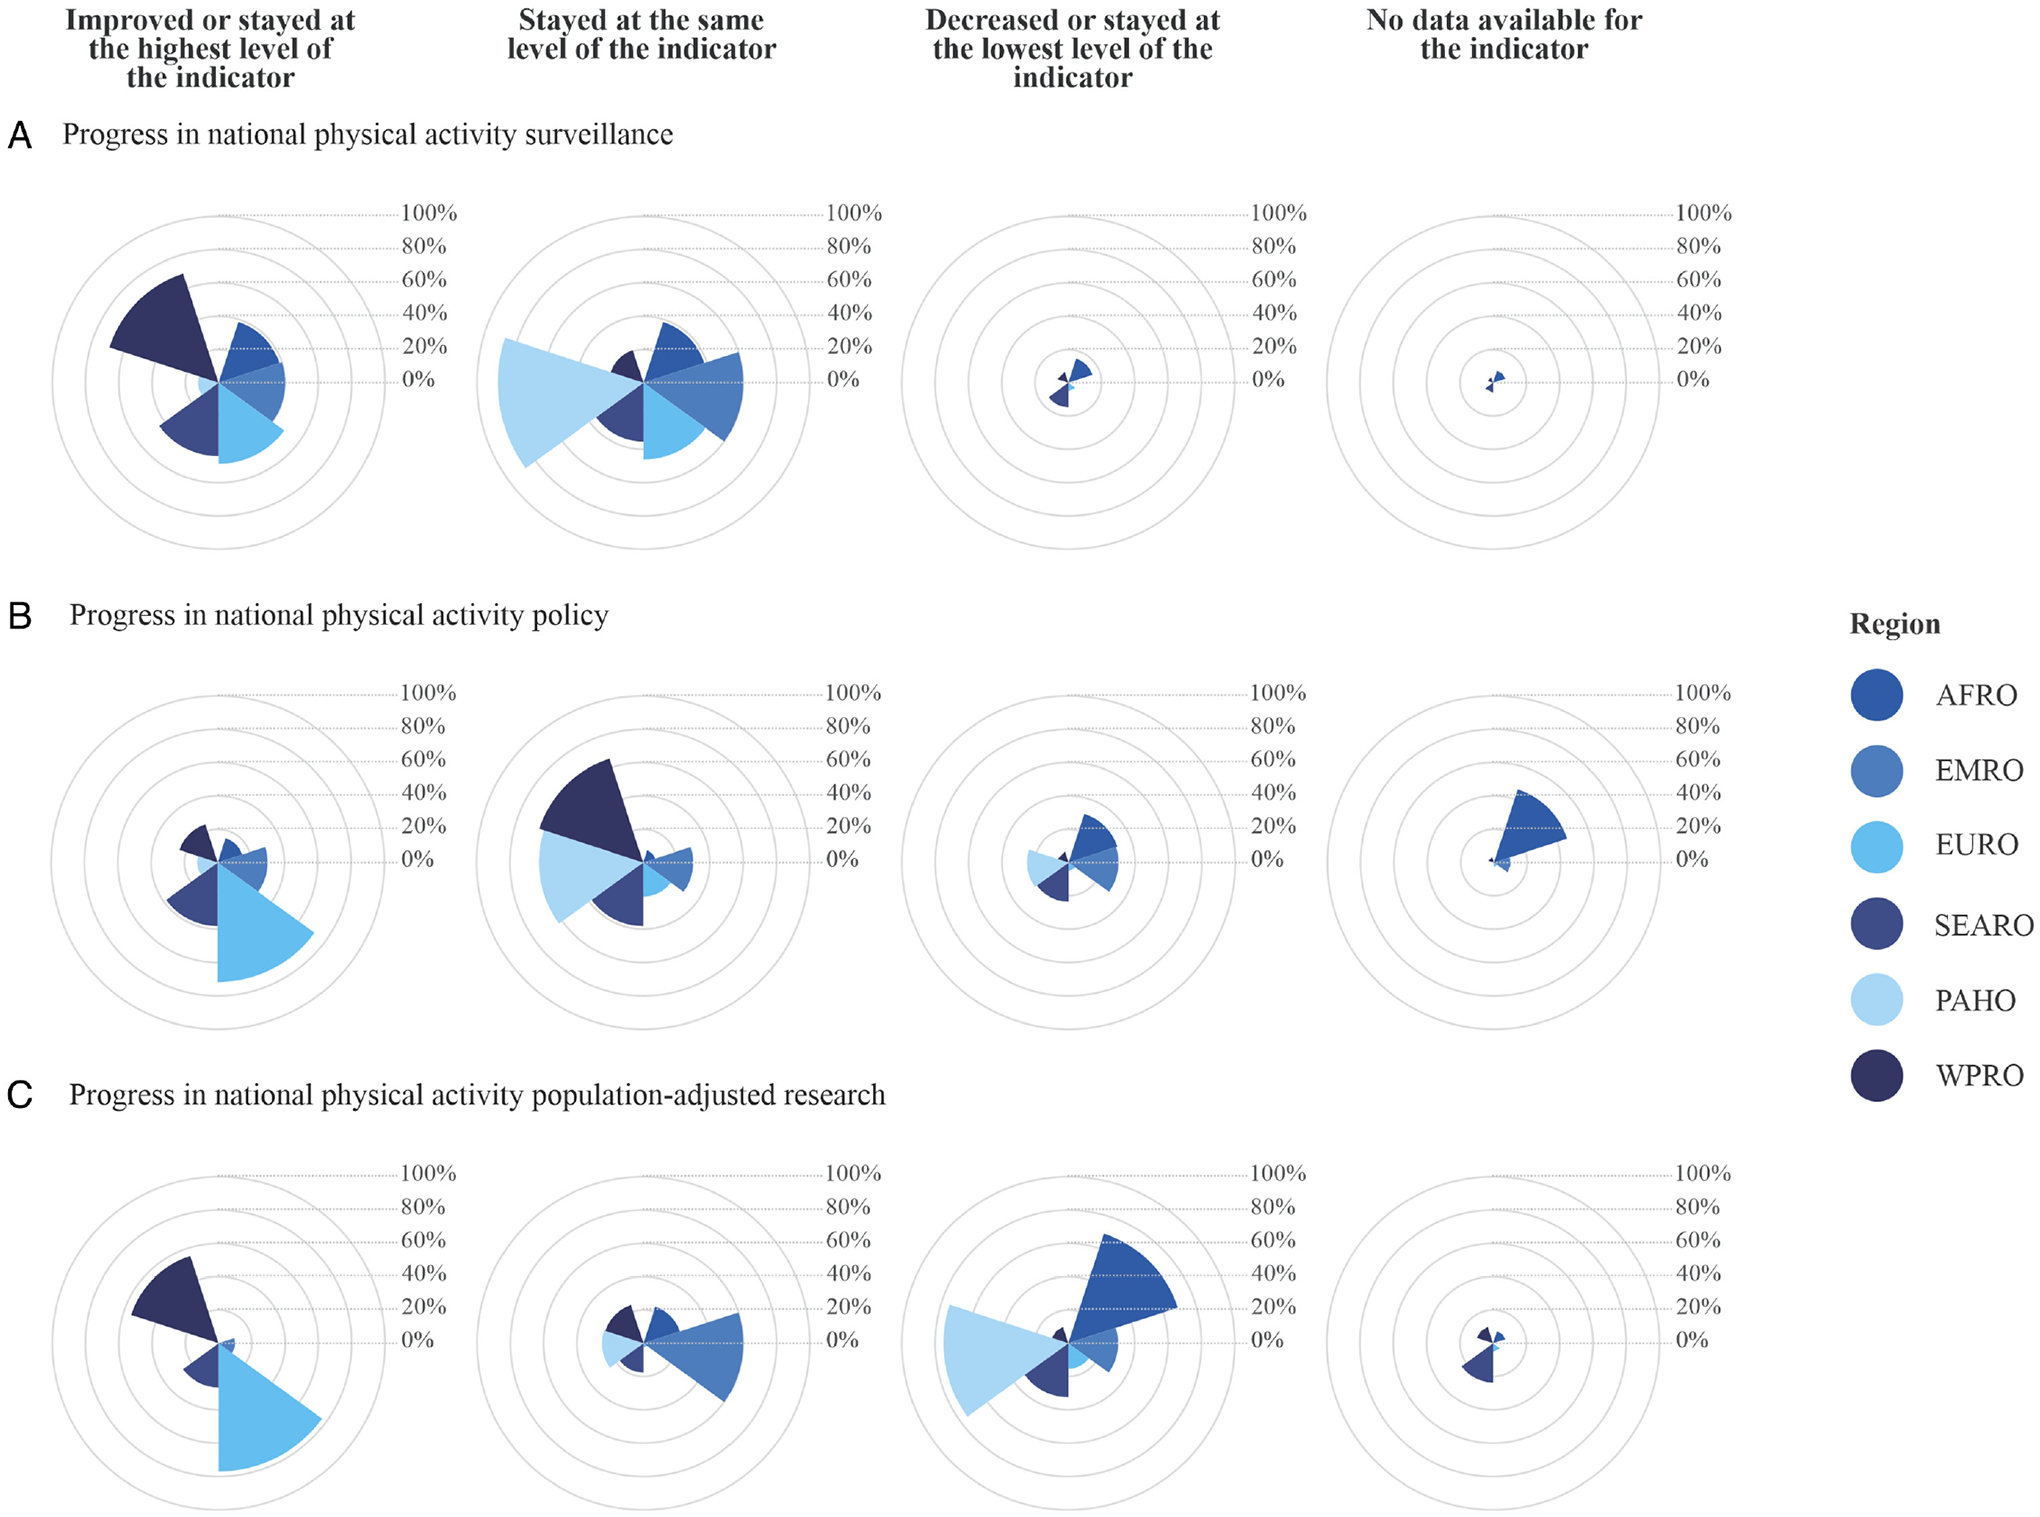
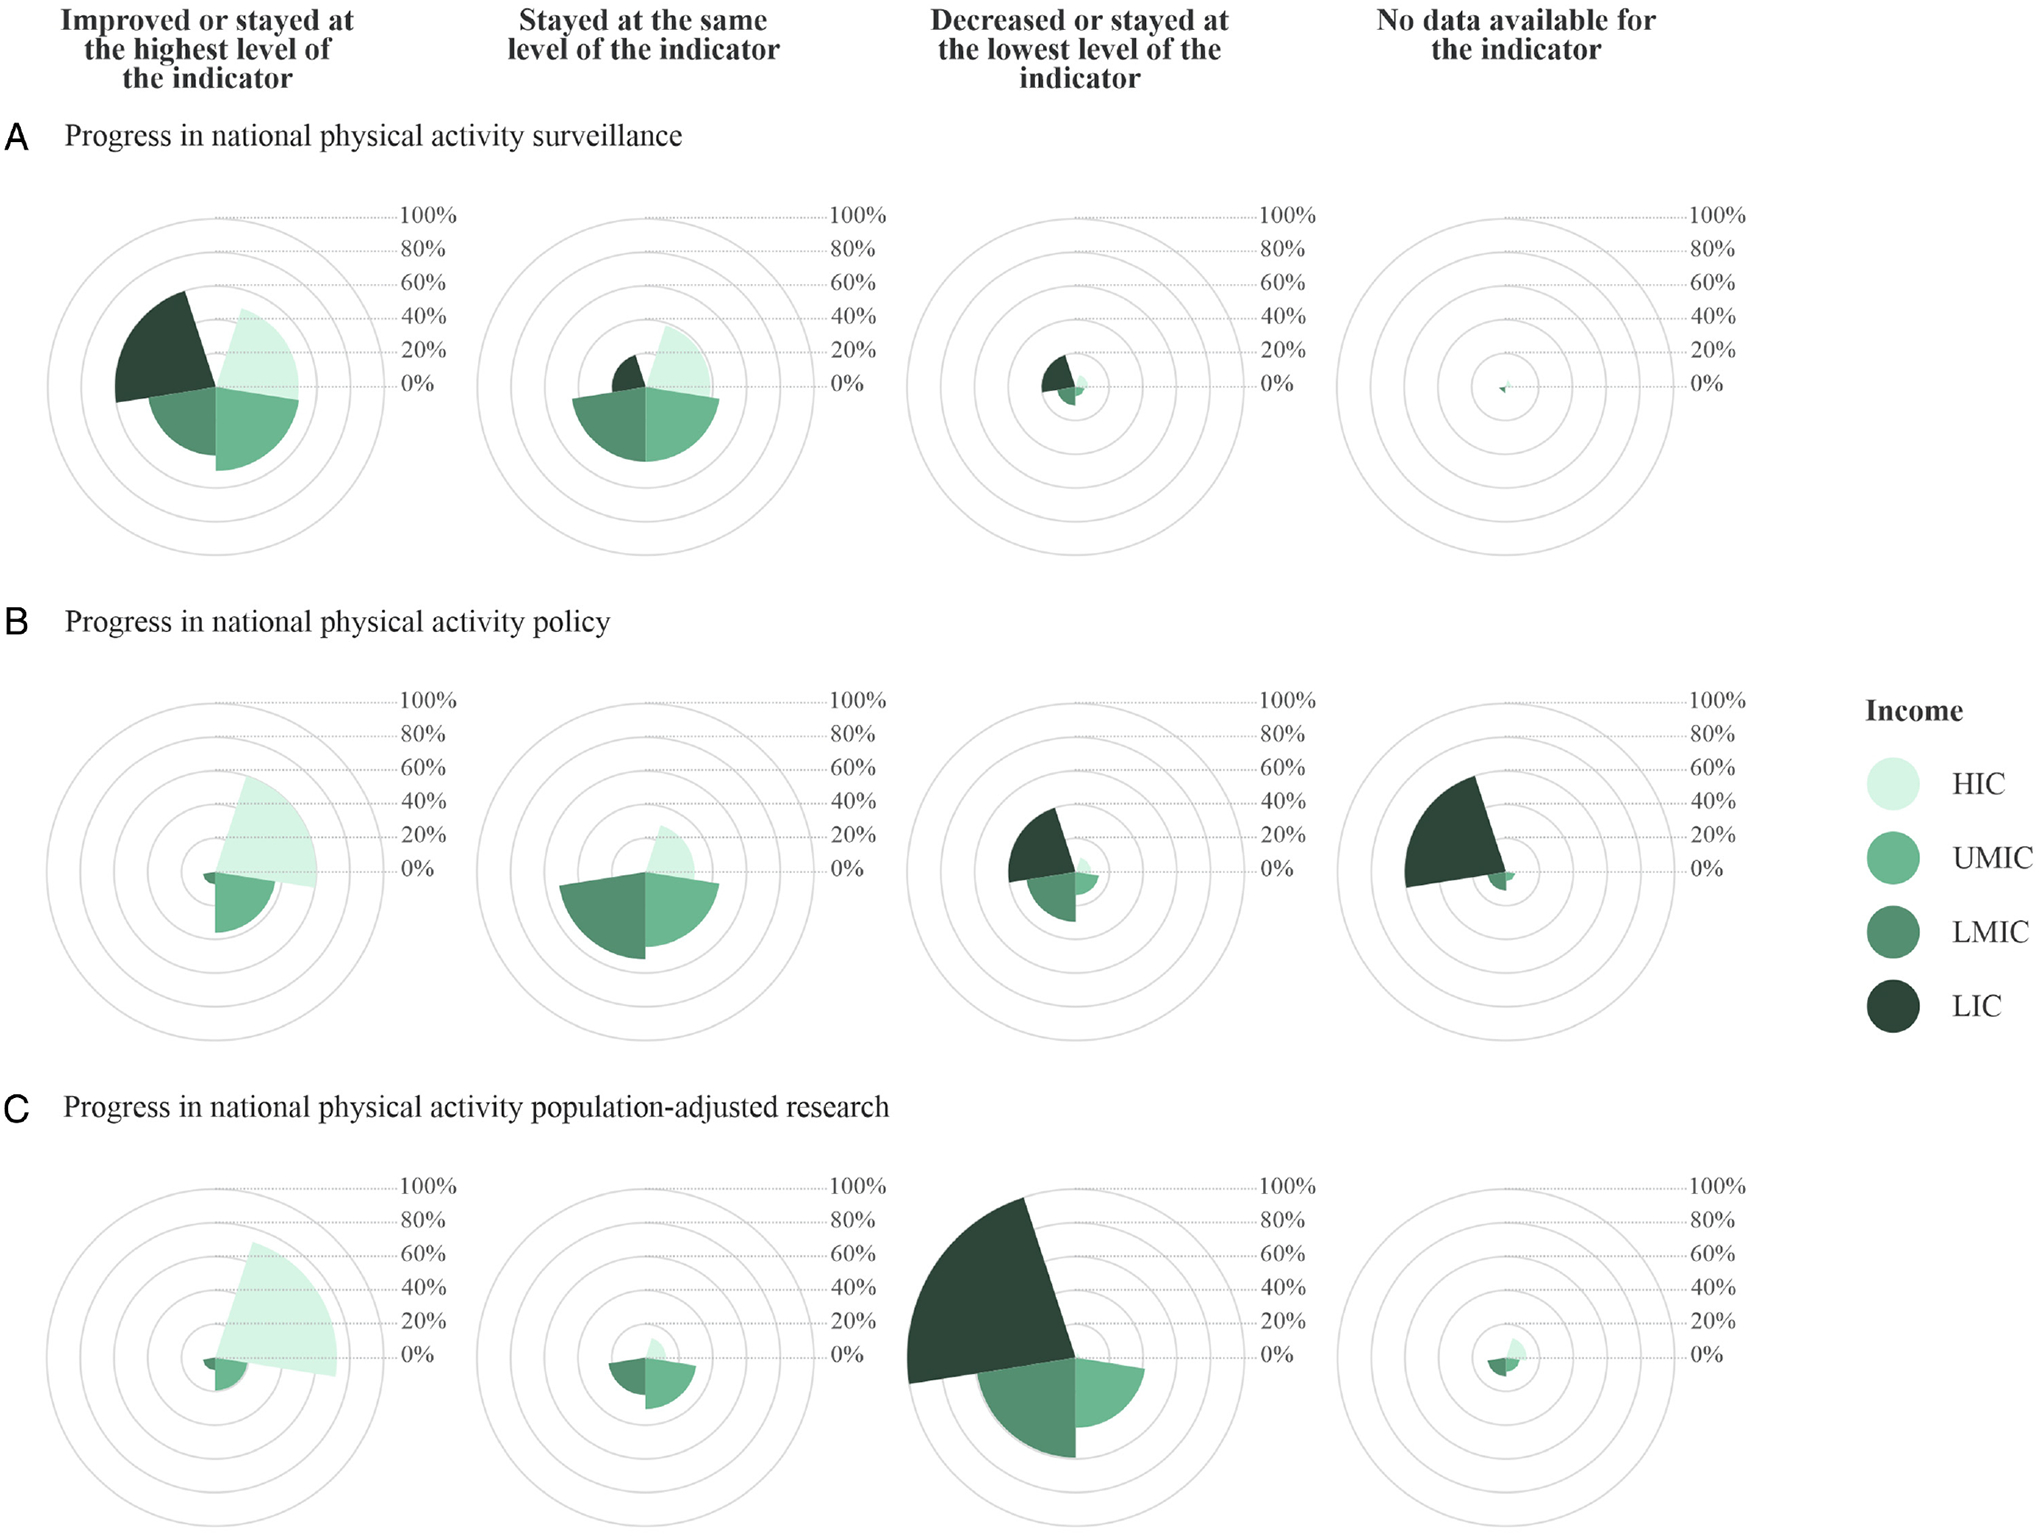
Background: Physical activity (PA) surveillance, policy, and research efforts need to be periodically appraised to gain insight into national and global capacities for PA promotion. The aim of this paper was to assess the status and trends in PA surveillance, policy, and research in 164 countries.

Methods: We used data from the Global Observatory for Physical Activity (GoPA!) 2015 and 2020 surveys. Comprehensive searches were performed for each country to determine the level of development of their PA surveillance, policy, and research, and the findings were verified by the GoPA! Country Contacts. Trends were analyzed based on the data available for both survey years.

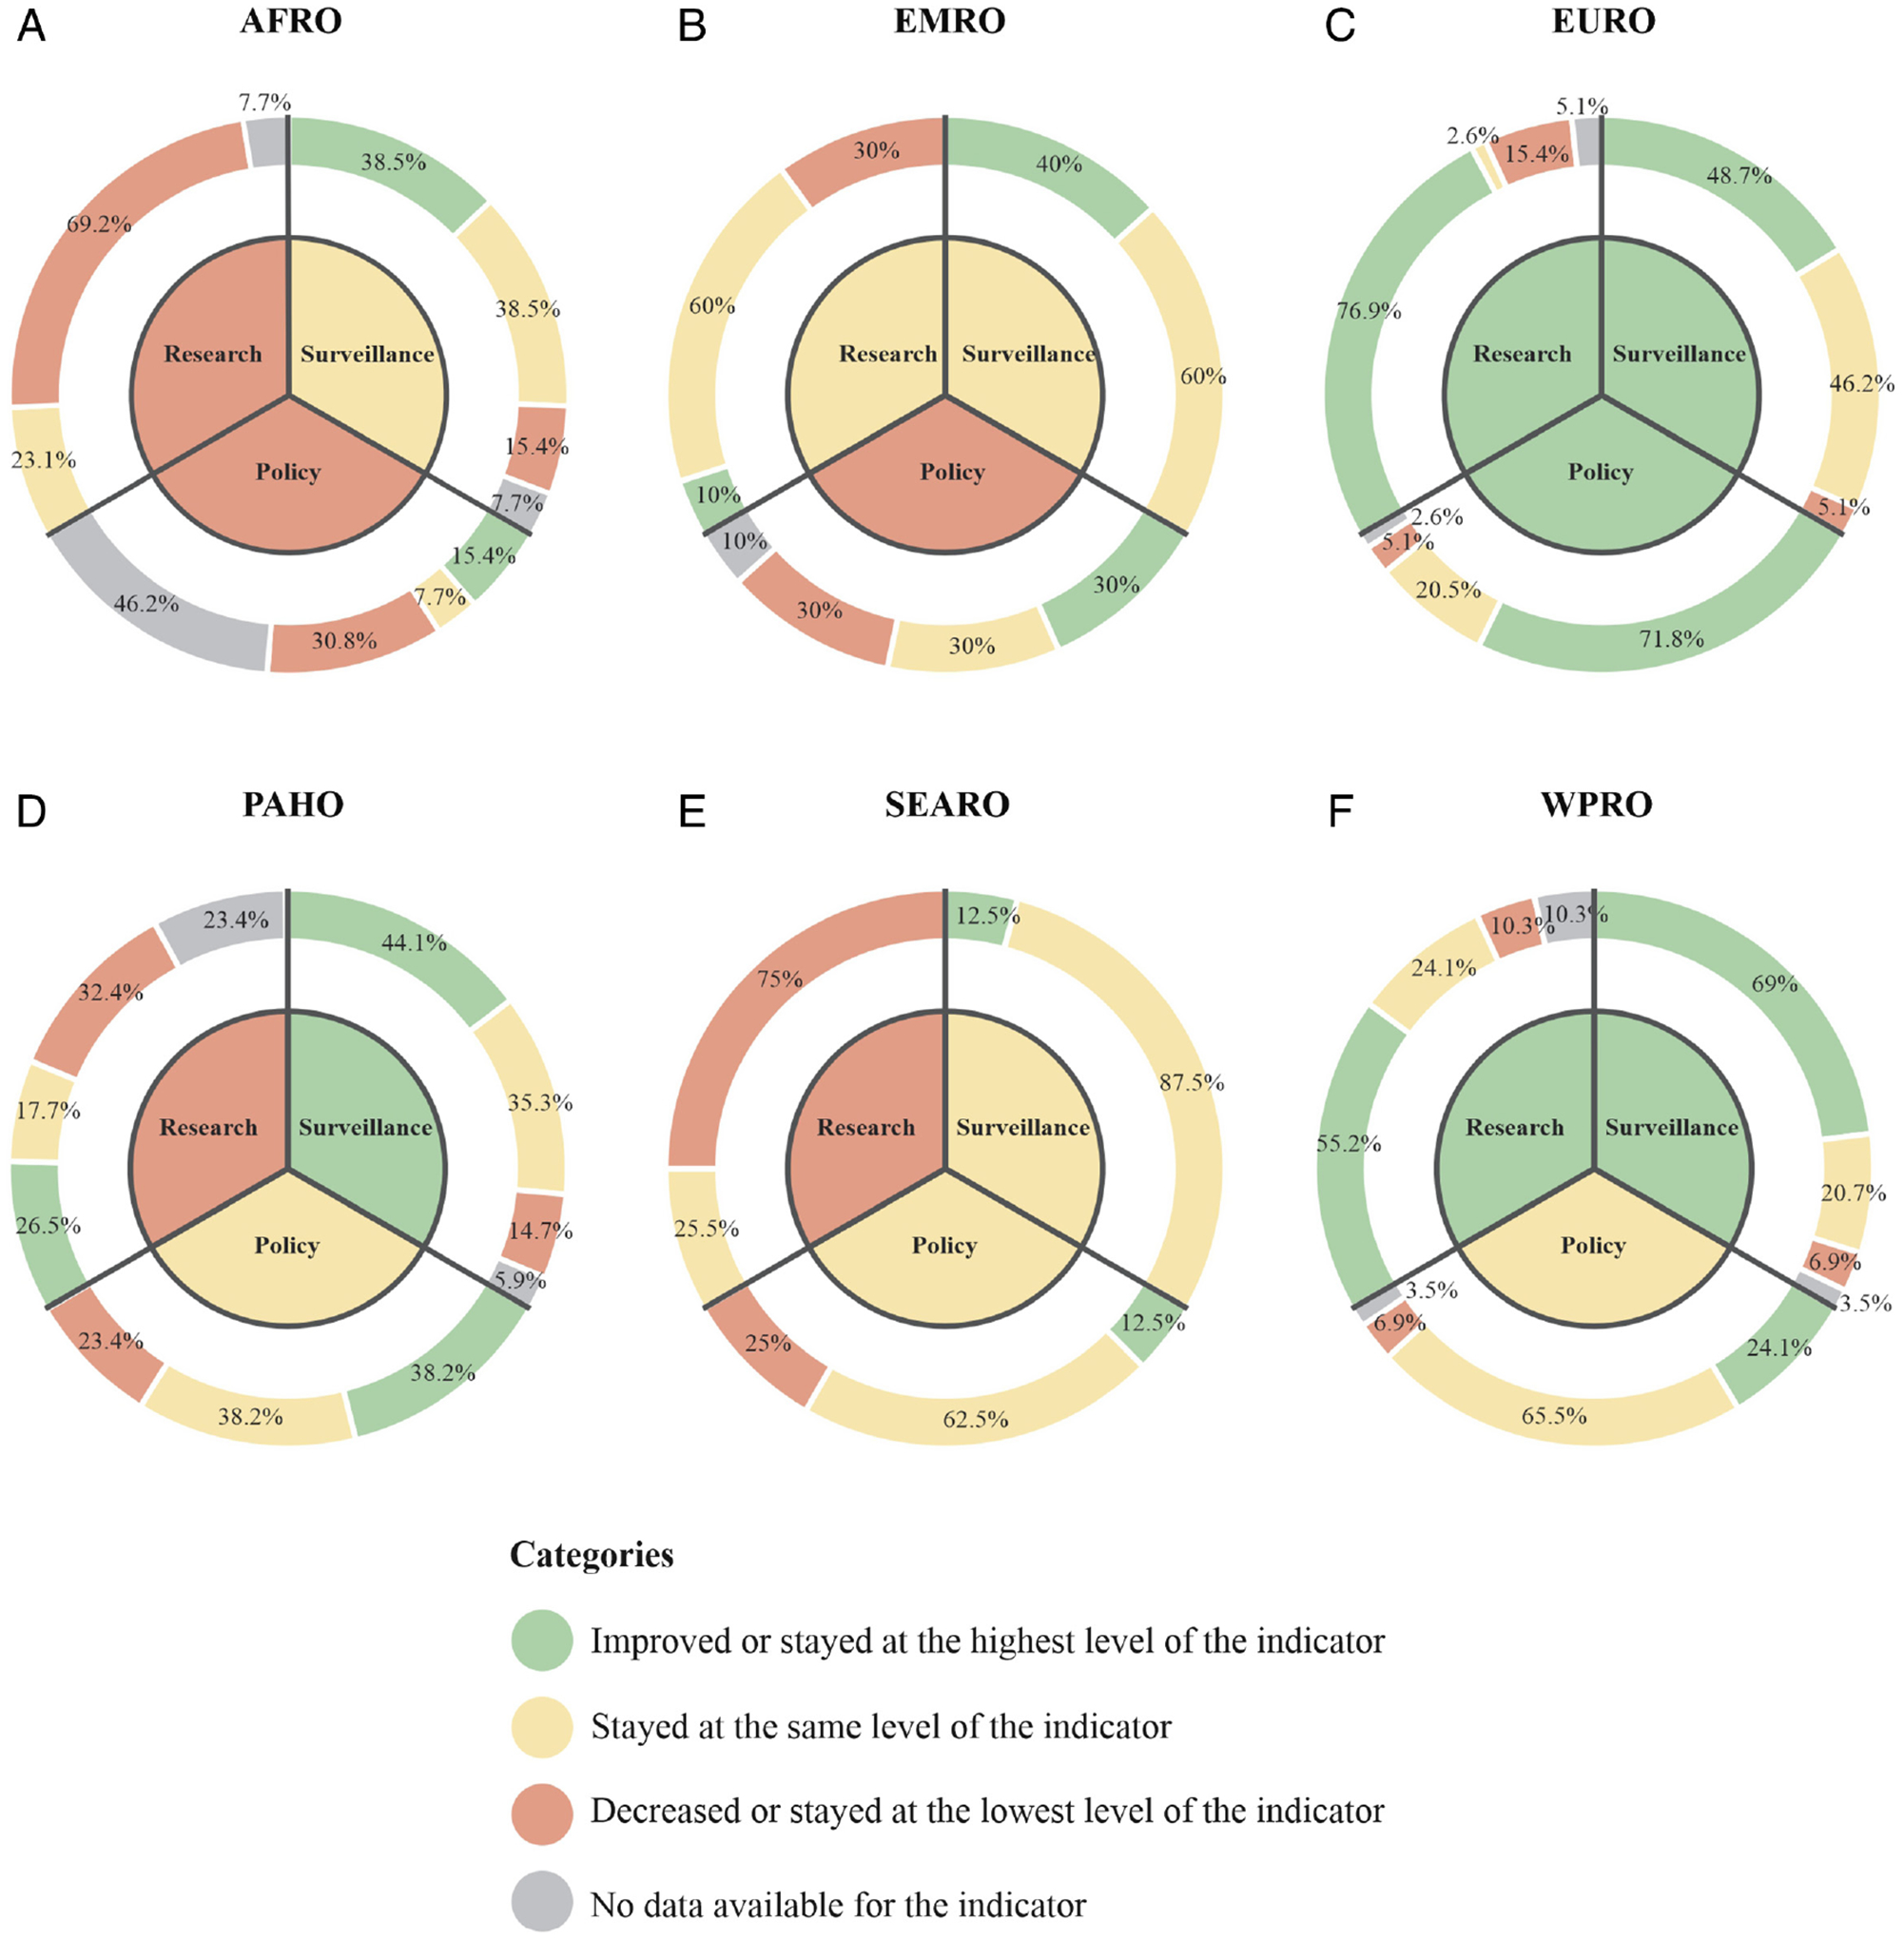
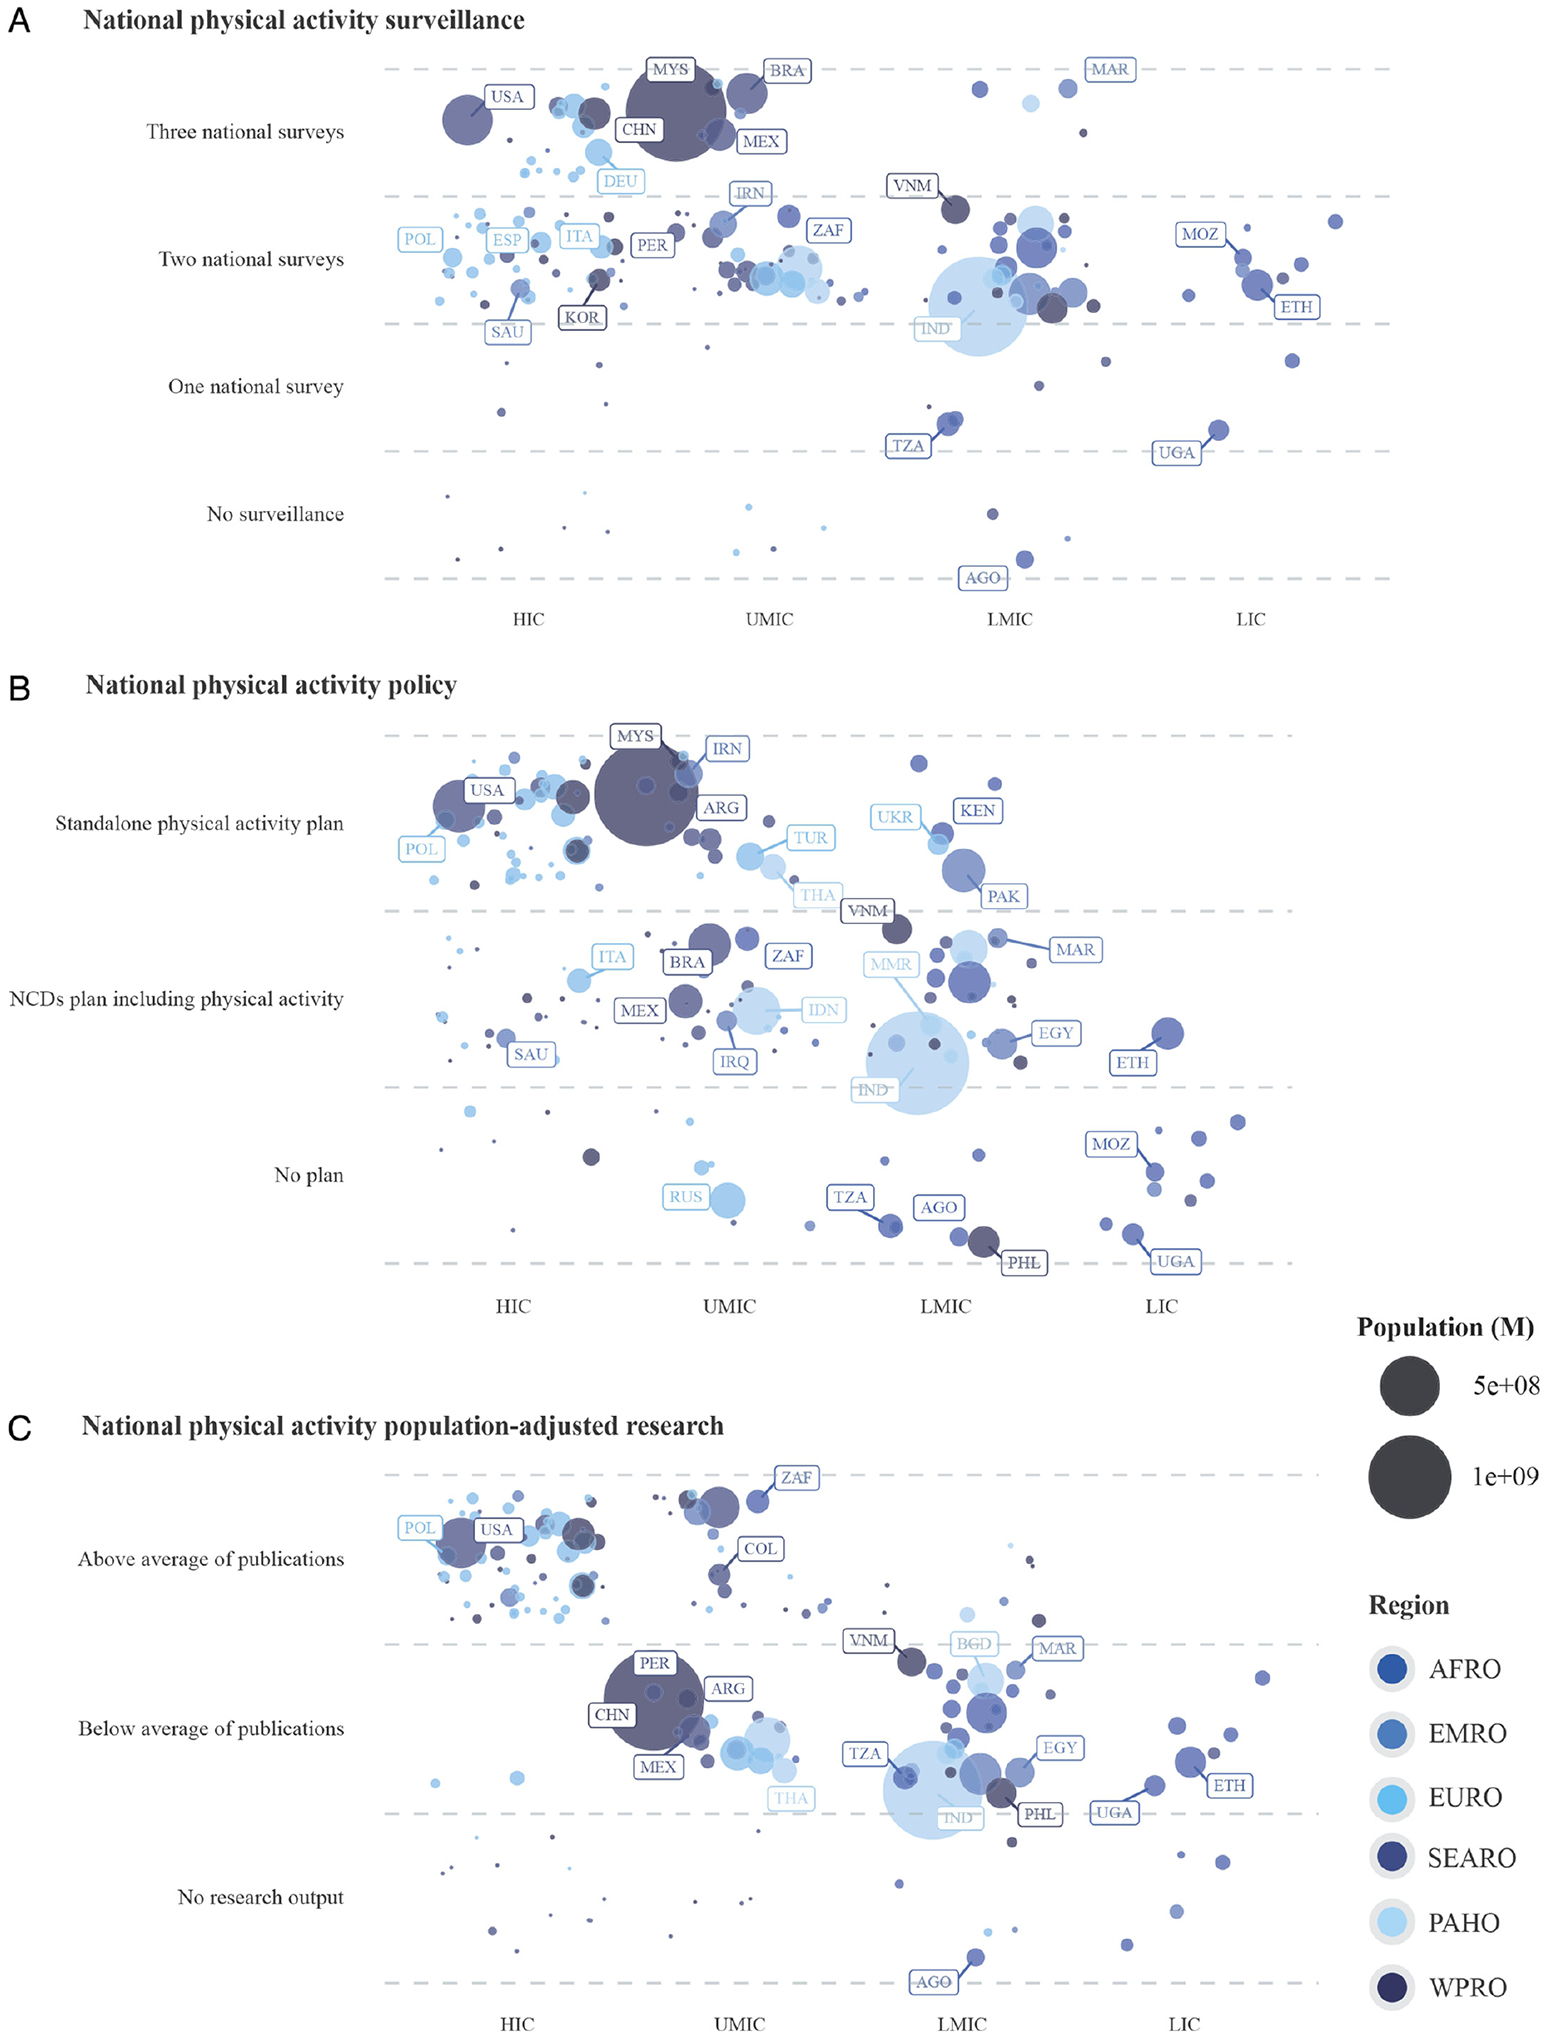
Results: The global 5-year progress in all 3 indicators was modest, with most countries either improving or staying at the same level. PA surveillance, policy, and research improved or remained at a high level in 48.1%, 40.6%, and 42.1% of the countries, respectively. PA surveillance, policy, and research scores decreased or remained at a low level in 8.3%, 15.8%, and 28.6% of the countries, respectively. The highest capacity for PA promotion was found in Europe, the lowest in Africa and low- and lower-middle-income countries. Although a large percentage of the world's population benefit from at least some PA policy, surveillance, and research efforts in their countries, 49.6 million people are without PA surveillance, 629.4 million people are without PA policy, and 108.7 million live in countries without any PA research output. A total of 6.3 billion people or 88.2% of the world's population live in countries where PA promotion capacity should be significantly improved.

Conclusion: Despite PA is essential for health, there are large inequalities between countries and world regions in their capacity to promote PA. Coordinated efforts are needed to reduce the inequalities and improve the global capacity for PA promotion.

Keywords: epidemiology; guidelines and recommendations; health promotion; measurement; public health practice.


Figures

Figure 1 —
Figure 1 —
Physical activity surveillance, policy, and research characteristics by world region based on the 2020 GoPA! survey. AFRO indicates Africa; EMRO, Eastern Mediterranean; EURO, Europe; GoPA!, Global Observatory for Physical Activity; NCD, noncommunicable disease; PAHO, The Americas; SEARO, South-East Asia; WPRO, Western Pacific. Note: The lighter-colored bars show the indicators’ lowest level (ie, surveillance: no surveillance, policy: no plan, population-adjusted research: no research output). The darker-colored bars show the indicators’ highest level (ie, surveillance: 3 national surveys, policy: standalone physical activity plan, research: above average of publications). For the most accurate interpretation of this graph (full range of color) please refer to the electronic version of the manuscript.
Figure 2 —
Figure 2 —
Physical activity surveillance, policy, and research characteristics by income group based on the 2020 GoPA! survey. GoPA! indicates Global Observatory for Physical Activity; HIC, high-income country; LIC, low-income country; LMIC, lower-middle-income country; NCD, noncommunicable disease; UMIC, upper-middle-income country. Note: The lighter-colored bars show the indicators’ lowest level (ie, surveillance: no surveillance, policy: no plan, population-adjusted research: no research output). The darker-colored bars show the indicators’ highest level (ie, surveillance: 3 national surveys, policy: standalone physical activity plan, research: above average of publications). For the most accurate interpretation of this graph (full range of color) please refer to the electronic version of the manuscript.
Figure 3 —
Figure 3 —
Estimated number of countries with low, medium, and high capacity for physical activity promotion. AFRO indicates Africa; EMRO, Eastern Mediterranean; EURO, Europe; PAHO, The Americas; SEARO, South-East Asia; WPRO, Western Pacific. Note: The levels of the indicators, from lightest to darkest, are: Stayed at the same level of the indicator (light color), Improved or stayed at the highest level of the indicator, No data available for the indicator, and Decreased or stayed at the lowest level of the indicator (dark color). For the most accurate interpretation of this graph (full range of color) please refer to the electronic version of the manuscript.
Figure 4 —
Figure 4 —
Global physical activity surveillance, policy, and research: GoPA! categories by country population, income, and region. Note: Random noise was added to minimize countries’ overplotting according to H. Wickham with the countries maintaining their position based on the indicator and income group. For example, POL and ITA both have 2 national surveys (upper left) and are high-income countries; the random noise prevents them from overlapping but keeps them in their respective positions inside the cell, as determined by the indicator and their respective income group classification. AFRO indicates Africa; ARG, Argentina; BGD, Bangladesh; BRA, Brazil; CHN, China; COL, Colombia; EGY, Egypt, Arab Rep.; EMRO, Eastern Mediterranean; ESP, Spain; EURO, Europe; ETH, Ethiopia; DEU, Germany; GoPA!, Global Observatory for Physical Activity; HIC, high-income country; IND, India; IDN, Indonesia; IRN, Iran, Islamic Rep.; IRQ, Iraq; ITA, Italy; KEN, Kenya; KOR, Korea, Rep.; LIC, low-income country; LMIC, lower-middle-income country; MYS, Malaysia; MEX, Mexico; MAR, Morocco; MOZ, Mozambique; MMR, Myanmar; PAHO, The Americas; PAK, Pakistan; PER, Peru; PHL, Philippines; POL, Poland; RUS, Russian Federation; SEARO, South-East Asia; SAU, Saudi Arabia; TZA, Tanzania; THA, Thailand; TUR, Turkey; UGA, Uganda; UKR, Ukraine; UMIC, upper-middle-income country; USA, United States; VNM, Vietnam; WPRO, Western Pacific; ZAF, South Africa. Note: The regions from lightest to darkest on the color scale are: PAHO, EURO, EMRO, AFRO, SEARO, and WPRO. For the most accurate interpretation of this graph (full range of color) please refer to the electronic version of the manuscript.
Figure 5 —
Figure 5 —
Progress in national physical activity surveillance, policy, and research by world region. Note: The reference period was 2015–2020 for surveillance and policy and 2010–2019 for research. The inner circles in each radial plot accumulate a percentage, thus the first inner circle represents 20.0% and the last inner circle represents 100.0%. Each region is represented by a color, for example, the first radial plot (top left) shows that 69.0% of countries in the WPRO region (dark blue) improved or stayed at the highest surveillance level. AFRO indicates Africa; EMRO, Eastern Mediterranean; EURO, Europe; PAHO, The Americas; SEARO, South-East Asia; WPRO, Western Pacific. Note: The regions from lightest to darkest on the color scale are: PAHO, EURO, EMRO, AFRO, SEARO, and WPRO. For the most accurate interpretation of this graph (full range of color) please refer to the electronic version of the manuscript.
Figure 6 —
Figure 6 —
Progress in national physical activity surveillance, policy, and research by income group. Note: The reference period was 2015–2020 for surveillance and policy and 2010–2019 for research. The inner circles in each radial plot accumulate a percentage, thus the first inner circle represents 20.0% and the last inner circle represents 100.0%. Each income group is represented by a color, for example, the first radial plot (top left) shows that 60.0% of the LICs (dark green) improved or stayed at the highest surveillance level. HIC indicates high-income country; LIC, low-income country; LMIC, lower-middle-income country; UMIC, upper-middle-income country. Note: The income groups from lightest to darkest on the color scale are: HIC, UMIC, LMIC, and LIC. For the most accurate interpretation of this graph (full range of color) please refer to the electronic version of the manuscript.

References

    1. Guthold R, Stevens GA, Riley LM, Bull FC. Worldwide trends in insufficient physical activity from 2001 to 2016: a pooled analysis of 358 population-based surveys with 1.9 million participants. Lancet Glob Health. 2018;6(10):e1077–e1086. doi: 10.1016/S2214-109X(18)30357-7 - DOI - PubMed
    1. Warburton DER, Bredin SSD. Health benefits of physical activity. Curr Opin Cardiol. 2017;32(5):541–556. doi: 10.1097/HCO.0000000000000437 - DOI - PubMed
    1. Saunders TJ, McIsaac T, Douillette K, et al. Sedentary behaviour and health in adults: an overview of systematic reviews. Appl Physiol Nutr Metab. 2020;45(10 suppl 2):S197–S217. doi: 10.1139/apnm-2020-0272 - DOI - PubMed
    1. Stockwell S, Trott M, Tully M, et al. Changes in physical activity and sedentary behaviours from before to during the COVID-19 pandemic lockdown: a systematic review. BMJ Open Sport Exerc Med. 2021; 7(1):e000960. doi: 10.1136/bmjsem-2020-000960 - DOI - PMC - PubMed
    1. Ramirez Varela A, Sallis R, Rowlands Av, Sallis JF. Physical inactivity and COVID-19: when pandemics collide. J Phys Act Health. 2021; 18(10):1159–1160. doi: 10.1123/jpah.2021-0454 - DOI - PubMed

Publication types