. 2023 Feb;614(7948):521-529.
doi: 10.1038/s41586-022-05644-7. Epub 2022 Dec 19.

Imprinted SARS-CoV-2 humoral immunity induces convergent Omicron RBD evolution

Affiliations

Imprinted SARS-CoV-2 humoral immunity induces convergent Omicron RBD evolution

Yunlong Cao et al. Nature. 2023 Feb.

Abstract

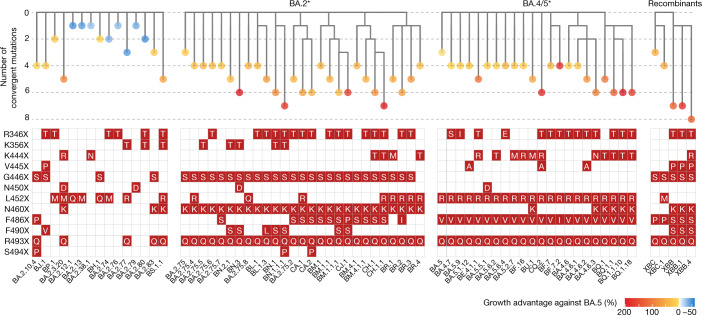
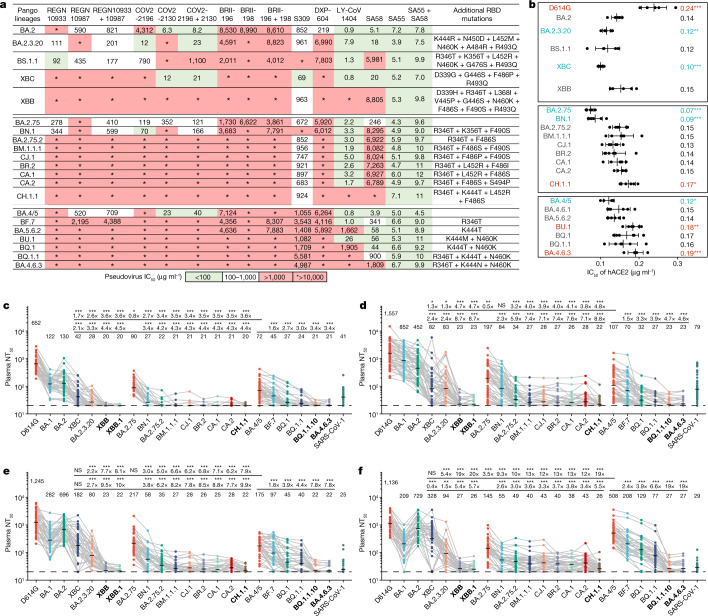
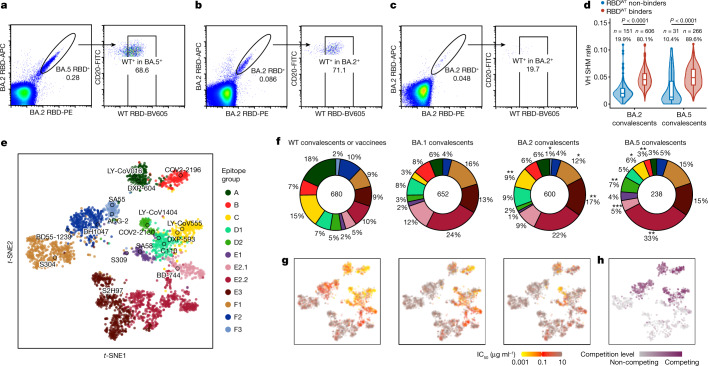
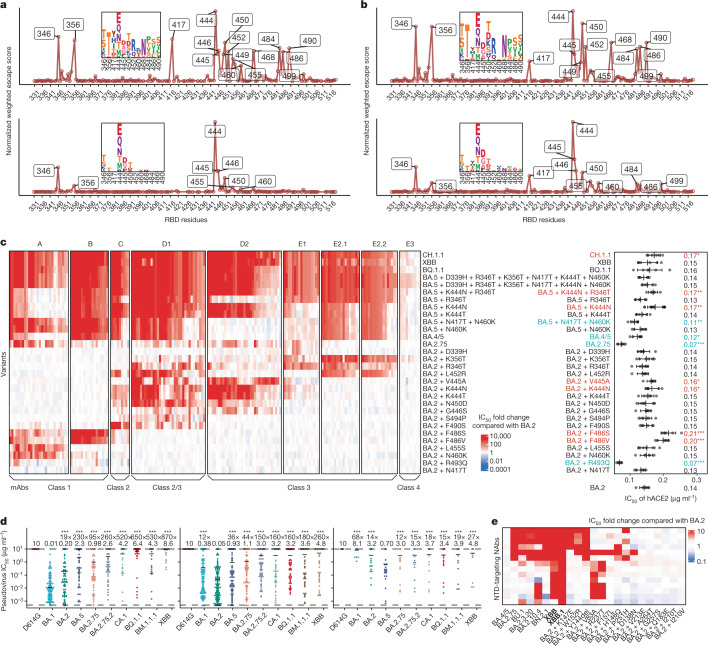
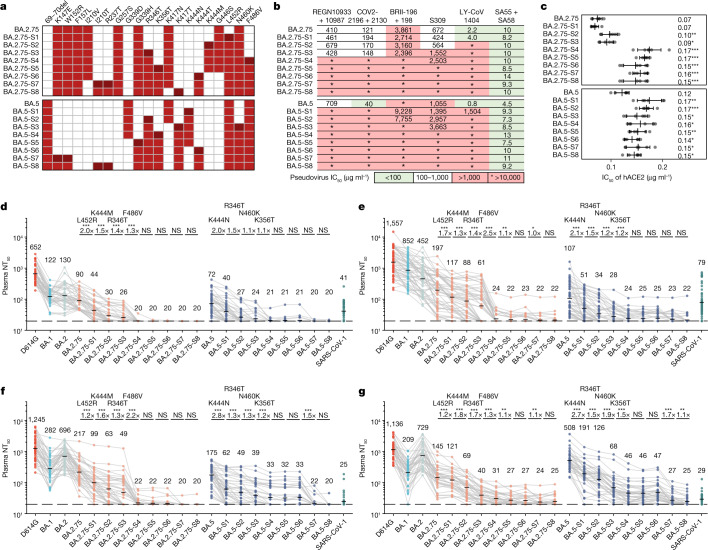
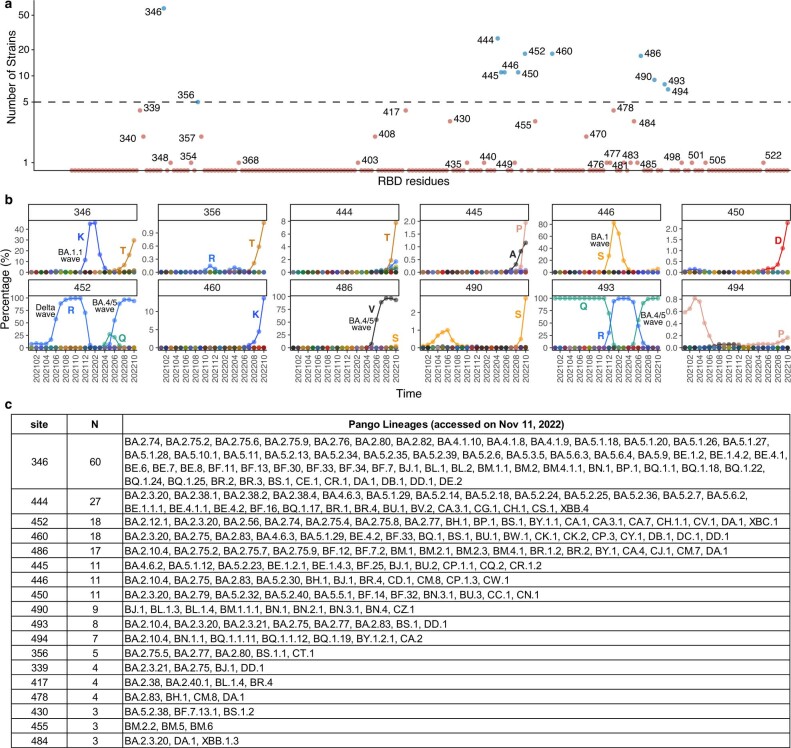
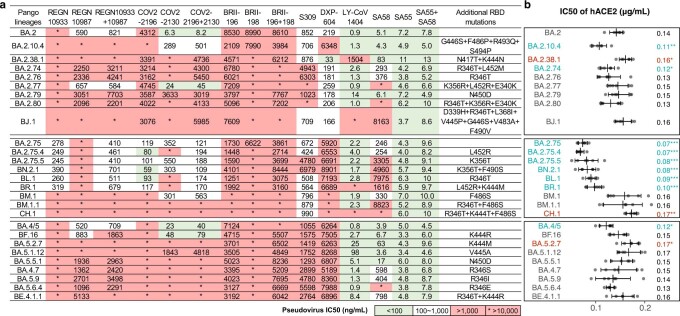
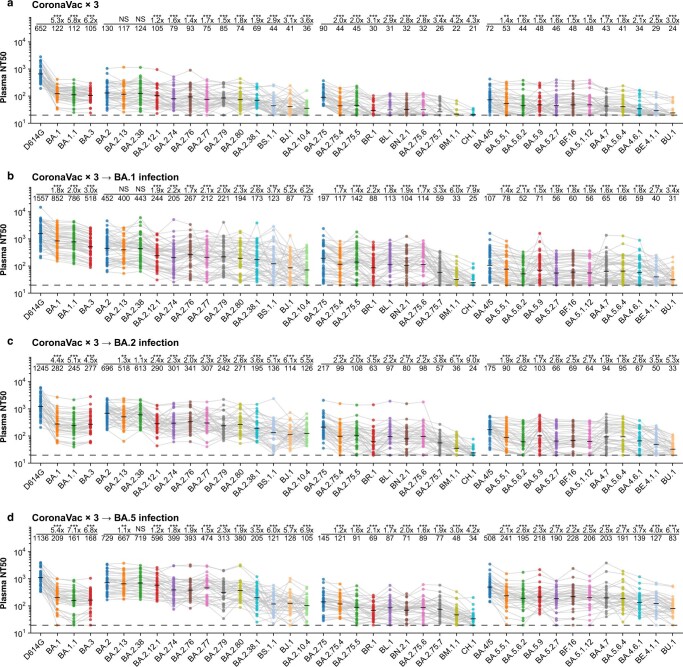
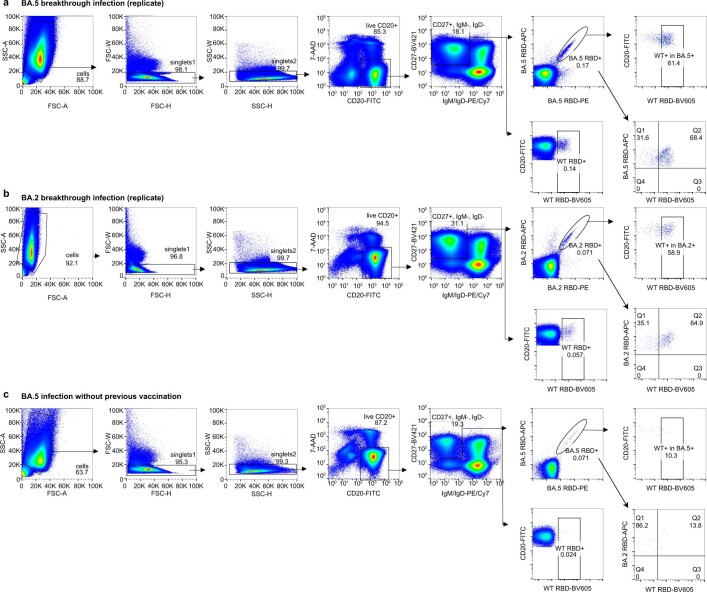
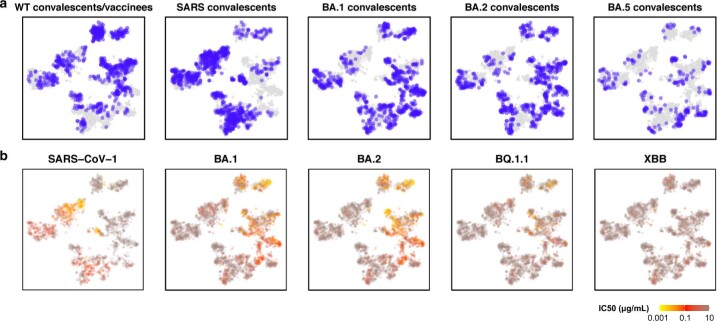
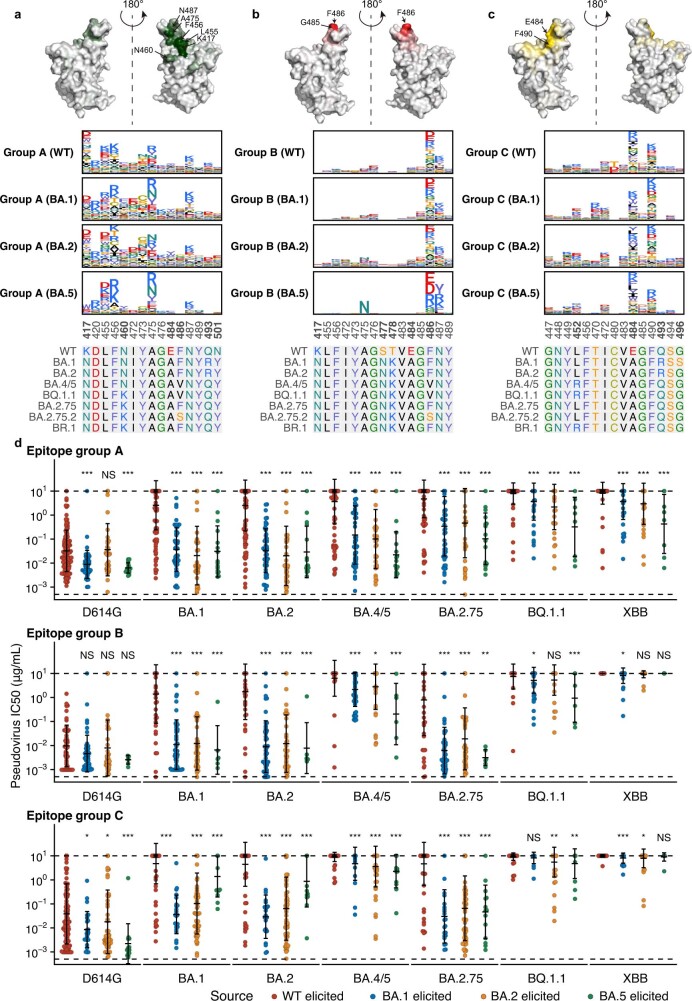
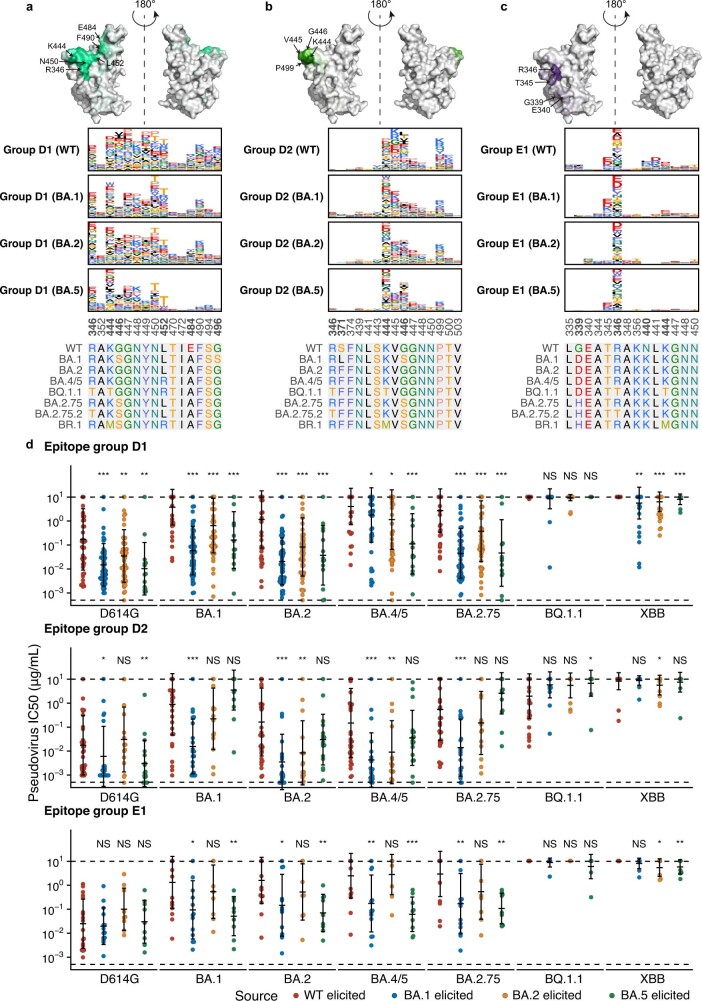
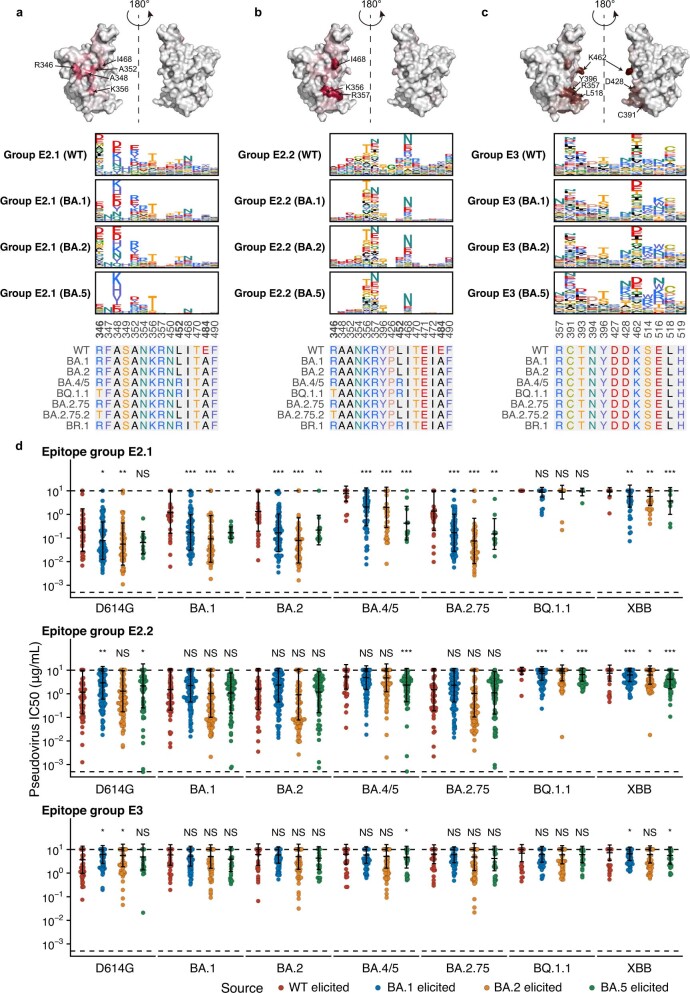
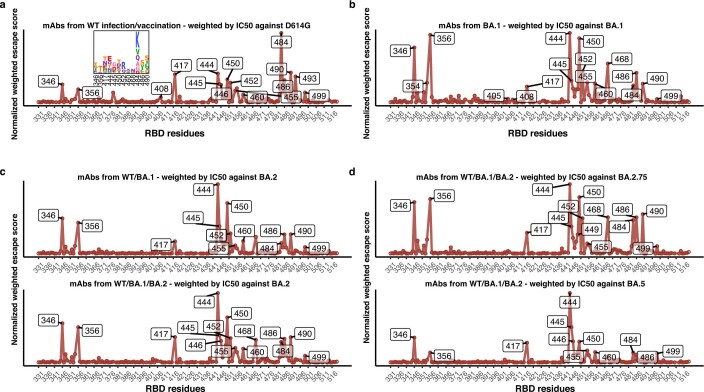
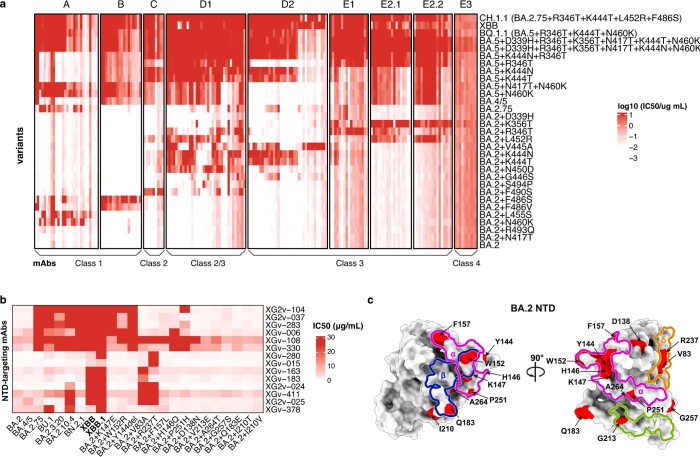
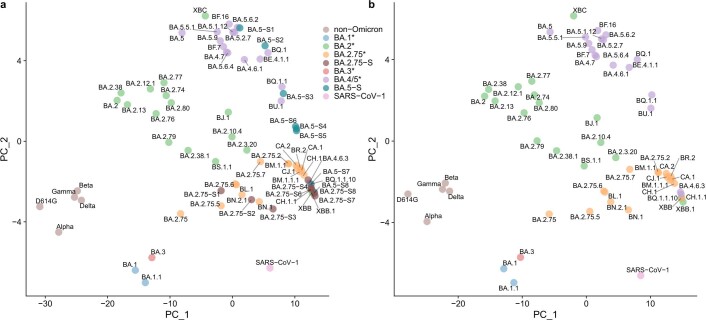
Continuous evolution of Omicron has led to a rapid and simultaneous emergence of numerous variants that display growth advantages over BA.5 (ref. 1). Despite their divergent evolutionary courses, mutations on their receptor-binding domain (RBD) converge on several hotspots. The driving force and destination of such sudden convergent evolution and its effect on humoral immunity remain unclear. Here we demonstrate that these convergent mutations can cause evasion of neutralizing antibody drugs and convalescent plasma, including those from BA.5 breakthrough infection, while maintaining sufficient ACE2-binding capability. BQ.1.1.10 (BQ.1.1 + Y144del), BA.4.6.3, XBB and CH.1.1 are the most antibody-evasive strains tested. To delineate the origin of the convergent evolution, we determined the escape mutation profiles and neutralization activity of monoclonal antibodies isolated from individuals who had BA.2 and BA.5 breakthrough infections2,3. Owing to humoral immune imprinting, BA.2 and especially BA.5 breakthrough infection reduced the diversity of the neutralizing antibody binding sites and increased proportions of non-neutralizing antibody clones, which, in turn, focused humoral immune pressure and promoted convergent evolution in the RBD. Moreover, we show that the convergent RBD mutations could be accurately inferred by deep mutational scanning profiles4,5, and the evolution trends of BA.2.75 and BA.5 subvariants could be well foreseen through constructed convergent pseudovirus mutants. These results suggest that current herd immunity and BA.5 vaccine boosters may not efficiently prevent the infection of Omicron convergent variants.


Conflict of interest statement

X.S.X. and Y.C. are founders of Singlomics Biopharmaceuticals. Changping Laboratory is in the process of applying for provisional patents (PCT/CN2021/090146 and PCT/CN2021/080537) covering BD series SARS-CoV-2 monoclonal antibodies, including BD-604 (DXP-604), BD55-5840 (SA58) and BD55-5514 (SA55), that lists X.S.X. and Y.C. as inventors. All other authors declare no competing interests.

Figures

Fig. 1
Fig. 1. Convergent evolution of Omicron RBD with growth advantage over BA.5.
Phylogenetic tree of featured Omicron subvariants carrying convergent mutations. Their relative growth advantage values, calculated using the CoV-Spectrum website, are indicated as a colour scale. Specific convergent mutations carried by each lineage are labelled.
Fig. 2
Fig. 2. Convergent Omicron subvariants induce NAb evasion.
a, IC50 of therapeutic NAbs against VSV-based pseudoviruses with spike glycoproteins of emerging SARS-CoV-2 BA.2, BA.5 or BA.2.75 convergent subvariants. b, Relative hACE2-binding capability measured by IC50 of hACE2 against pseudoviruses of variants. Error bars indicate mean ± s.d. of n = 5 biologically independent replicates. P values were calculated using two-tailed Student’s t-test. *P < 0.05, **P < 0.01 and ***P < 0.001. There is no label on variants with P > 0.05. Variants with significantly stronger binding are coloured blue, whereas those with weaker binding are coloured red. cf, Pseudovirus-neutralizing titres against SARS-CoV-2 D614G and Omicron subvariants of plasma from vaccinated or convalescent individuals of breakthrough infection. Individuals who had received three doses of CoronaVac (n = 40) (c), individuals who had been infected with BA.1 after receiving three doses of CoronaVac (n = 50) (d), individuals who had been infected with BA.2 after receiving three doses of CoronaVac (n = 39) (e) and individuals who had been infected with BA.5 after receiving three doses of CoronaVac (n = 36) (f) are shown. The geometric mean titres are labelled. Statistical tests were performed using two-tailed Wilcoxon signed-rank tests of paired samples. *P < 0.05, **P < 0.01, ***P < 0.001 and not significant (NS) P > 0.05. NT50 against BA.2-derived and BA.2.75-derived subvariants were compared with that against BA.4/5 (the upper line) and BA.2.75 (the lower line); BA.4/5-derived subvariants were only compared with BA.4/5. Dashed lines indicate the limit of detection (LOD,  NT50 = 20). Strains showing the strongest evasion are in bold. All neutralization assays were conducted in at least two independent experiments.
Fig. 3
Fig. 3. Epitope characterization of mAbs elicited by Omicron breakthrough infections.
ac, FACS analysis of pooled memory B cells (IgM, IgD/CD27+) from Omicron breakthrough-infection convalescent individuals. BA.5 breakthrough infection (a), BA.2 breakthrough infection (b) and BA.2 convalescent individuals without vaccination (c) are shown. APC, allophycocyanine; FITC, fluorescein isothiocyanate; PE, phycoerythrin. d, The heavy-chain variable (VH) domain SHM rate of mAbs from individuals with BA.2 (n = 757) and BA.5 (n = 297) breakthrough infection. Binding specificity was determined by ELISA. Statistical tests were determined using two-tailed Wilcoxon rank-sum tests. Boxes display the 25th percentile, median and 75th percentile, and whiskers indicate median ± 1.5 times the interquartile range. Violin plots show kernel density estimation curves of the distribution. Numbers and ratios of samples in each group are labelled above the violin plots. e, t-SNE and clustering of SARS-CoV-2 WT RBD-binding antibodies based on DMS profiles of 3,051 antibodies. f, Epitope distribution of mAbs from convalescent individuals after WT infection or post-vaccination BA.1, BA.2 or BA.5 infection. Numbers in the centre circles indicate total numbers of mAbs. Colours for epitope groups in e also refer to f. Two-tailed binomial tests were used to compare the proportion of each epitope group from BA.2 and BA.5 convalescent individuals with that from BA.1. *P < 0.05, **P < 0.01, ***P < 0.001 and no label for P > 0.05. g, Projection of the neutralizing activity of mAbs against SARS-CoV-2 D614G (left; n = 3,046), BA.2.75 (middle; n = 3,046) and BA.4/5 (right; n = 3,046). h, Projection of the ACE2 competition level of mAbs determined by competition ELISA (n = 1,317). All neutralization assays and ELISA were conducted in at least two independent experiments.
Fig. 4
Fig. 4. Immune imprinting promotes convergent evolution of NAb-evasive mutations.
a,b, Normalized average escape scores weighted by IC50 against BA.2 (top) and BA.5 (bottom) using DMS profiles of NAbs from corresponding convalescent individuals (a), and BA.2.75 (top) and BA.5 (bottom) using DMS profiles of all NAbs except those from individuals convalescent from SARS-CoV-1 infection followed by three-dose CoronaVac. (b). c, IC50 of representative potent BA.2-neutralizing antibodies in the epitope group against emerging and constructed Omicron subvariants pseudovirus with escape mutations, in addition to IC50 of hACE2 against these variants. The classes of the NAbs as defined in ref.  are also annotated below this map. Error bars indicate mean ± s.d. of n = 5 biologically independent replicates. P values were calculated using two-tailed Student’s t-test. *P < 0.05, **P < 0.01, ***P < 0.001 and no label on variants with P > 0.05. Variants with significantly stronger binding are coloured blue, whereas those with weaker binding are coloured red. d, IC50 against featured subvariants of RBD-targeting Omicron-specific NAbs from convalescent individuals with BA.1 (left; n = 100), BA.2 (middle; n = 151) and BA.5 (right; n = 31) breakthrough infection. The geometric mean IC50s are labelled, and error bars indicate the geometric standard deviation. Dashed lines indicate the LOD (IC50 = 0.0005 μg ml−1). P values are calculated using two-tailed Wilcoxon signed-rank tests compared with the corresponding eliciting strain. Antibodies with IC50 of more than 10 μg ml−1 against the eliciting strain were excluded from the calculation of P values and fold changes. ***P < 0.001 and P > 0.05 (NS). e, IC50 of NTD-targeting NAbs against emerging Omicron subvariants and BA.2 mutants with a single NTD substitution. All neutralization assays were conducted in at least two independent experiments.
Fig. 5
Fig. 5. Accumulation of convergent escape mutations leads to complete loss of plasma neutralization.
a, Mutations of multiple designed mutants with key convergent escape mutations based on BA.2.75 and BA.5. Mutations in dark red indicate the additional mutation compared with the former mutant. b, IC50 of therapeutic mAbs and cocktails against pseudoviruses of designed mutants. c, IC50 of hACE2 against the designed mutants. Error bars indicate mean ± s.d. of n = 5 biologically independent replicates. P values were calculated using two-tailed Student’s t-test, compared with BA.2.75 and BA.5 for BA.2.75-derived and BA.5-derived mutants, respectively. *P < 0.05, **P < 0.01, ***P < 0.001 and no label on variants with P > 0.05. dg, Pseudovirus neutralizing titres against SARS-CoV-2 D614G, Omicron subvariants and designed mutants of plasma from vaccinated or convalescent individuals with breakthrough infection. Individuals who received three doses of CoronaVac (n = 40) (d), convalescent individuals infected with BA.1 after receiving three doses of CoronaVac (n = 50) (e), convalescent individuals infected with BA.2 after receiving three doses of CoronaVac (n = 39) (f), and convalescent individuals infected with BA.5 after receiving three doses of CoronaVac (n = 36) (g) are shown. Key additional mutations from each designed mutant are annotated above the points. Dashed lines indicate the limit of detection (LOD,  NT50 = 20). The geometric mean titres are labelled. P values are determined using two-tailed Wilcoxon signed-rank tests of paired samples. *P < 0.05, **P < 0.01, ***P < 0.001 and P > 0.05 (NS). All neutralization assays were conducted in at least two independent experiments.
Extended Data Fig. 1
Extended Data Fig. 1. Emergence of convergent mutations on SARS-CoV-2 RBD.
a, Number of independent Omicron sublineages that gained mutations on the corresponding SARS-CoV-2 RBD residue and exhibited growth advantage compared to its ancestral Omicron strain (BA.2, BA.2.75, or BA.5). Residues that were mutated in at least five independent sublineages are considered convergent (dash threshold). Recombinants were not counted, but their derivatives were included in the analysis (see Methods). b, Proportions of each convergent mutation in all detected Spike sequences. Spike sequences were from GISAID (Spike protein sequences released on Oct 27, 2022). The percentage of the wild-type residue is not plotted, except for 493Q, considering the prevalence of R493Q reversion. c, List of Pango lineages shown in Extended Data Fig. 1a.
Extended Data Fig. 2
Extended Data Fig. 2. Antibody drug evasion and hACE2 binding capability of convergent Omicron variants.
a, IC50 of therapeutic NAbs against pseudoviruses of additional emerging SARS-CoV-2 Omicron subvariants. b, Relative hACE2-binding capability measured by IC50 of hACE2 against pseudoviruses. Error bars indicate mean ± s.d. of n = 5 biologically independent replicates. P-values were calculated using a two-tailed Student’s t-test. *, p < 0.05; **, p < 0.01; ***, p < 0.001. No label on variants with p > 0.05. Variants with significantly stronger binding are coloured blue, while those with weaker binding are coloured red. All neutralization assays were conducted in at least two independent experiments.
Extended Data Fig. 3
Extended Data Fig. 3. Plasma neutralization evasion of convergent Omicron variants.
a-d, NT50 against SARS-CoV-2 previous variants of concern and additional Omicron subvariants of plasma from vaccinated or convalescent individuals following breakthrough infection. Plasma samples, statistical methods and meaning of labels are the same as in Fig. 2. All neutralization assays were conducted in at least two independent experiments.
Extended Data Fig. 4
Extended Data Fig. 4. FACS gating strategy for isolating mAbs from BA.2 and BA.5 convalescent individuals.
a, FACS gating strategy of antigen-specific B cells from individuals who recovered from BA.5 breakthrough infection. Data from an independent experiment compared to Fig. 3a are shown here. b, FACS gating strategy of antigen-specific B cells from individuals who recovered from BA.2 breakthrough infection. Data from an independent experiment compared to Fig. 3b are shown here. c, FACS gating strategy of antigen-specific B cells from individuals who recovered from BA.5 infection.
Extended Data Fig. 5
Extended Data Fig. 5. Distribution of antibody sources and neutralizing activities on the DMS landscape.
a, Sources of the 3051 mAbs involved in this study projected on the t-SNE of DMS profiles. b, IC50 against SARS-CoV-1 (N = 1870 determined), Omicron BA.1 (N = 3031), BA.2 (N = 3046), BQ.1.1 (N = 3051), and XBB (N = 3033) of these mAbs projected on the embedding. All neutralization assays were conducted in at least two independent experiments.
Extended Data Fig. 6
Extended Data Fig. 6. Escape hotspots and neutralization of mAbs in epitope groups A, B and C.
a-c, Average escape scores from DMS of epitope groups A (a), B (b), C (c) and each RBD residue. Scores are projected onto the structure of SARS-CoV-2 RBD (PDB: 6M0J). Average escape maps that indicate the score of each mutation from DMS on escape hotspots of antibodies, grouped by their sources, in epitope groups A (a), B (b) and C (c), and corresponding sequence alignment of SARS-CoV-2 WT and Omicron RBDs are also shown. The height of each amino acid in the escape maps represents its mutation escape score. Mutated sites in Omicron variants are marked in bold. d, Pseudovirus-neutralizing IC50 of antibodies in group A, B, and C, from wild-type vaccinated or convalescent individuals (WT-elicited, n = 133, 50, 106 for A-C, respectively), BA.1 (BA.1-elicited, n = 51, 49, 24), BA.2 (BA.2-elicited, n = 34, 36, 56) and BA.5 convalescent individuals (BA.5-elicited, n = 16, 6, 14). The geometric mean IC50s are labelled, and error bars indicate the geometric standard deviation. P-values are calculated using two-tailed Wilcoxon rank sum tests. *, p < 0.05; **, p < 0.01; ***, p < 0.001; NS, not significant, p > 0.05. All neutralization assays were conducted in at least two independent experiments.
Extended Data Fig. 7
Extended Data Fig. 7. Escape hotspots and neutralization of mAbs in epitope group D and E1.
a-c, Average escape scores from DMS of epitope groups D1 (a), D2 (b), E1 (c) and each RBD residue. d, Pseudovirus-neutralizing IC50 of mAbs in group D1, D2, and E1 from WT vaccinated or convalescent individuals (n = 49, 37, 19 for D1, D2 and E1, respectively), BA.1 (n = 59, 21, 14 for D1, D2 and E1, respectively), BA.2 (n = 56, 15, 9 for D1, D2 and E1, respectively), and BA.5 convalescent individuals (n = 14, 17, 9 for D1, D2 and E1, respectively). The geometric mean IC50s are labelled, and error bars indicate the geometric standard deviation. P-values are calculated using two-tailed Wilcoxon rank sum tests. *, p < 0.05; **, p < 0.01; ***, p < 0.001; NS, not significant, p > 0.05. All neutralization assays were conducted in at least two independent experiments.
Extended Data Fig. 8
Extended Data Fig. 8. Escape hotspots and neutralization of mAbs in epitope group E2 and E3.
a-c, Average escape scores from DMS of epitope groups E2.1 (a), E2.2 (b), E3 (c) and each RBD residue. d, Pseudovirus-neutralizing IC50 of mAbs in group E2.1, E2.2, and E3 from WT vaccinated or convalescent individuals (n = 49, 37, 19 for E2.1, E2.2, and E3, respectively), BA.1 (n = 59, 21, 14 for E2.1, E2.2, and E3, respectively), BA.2 convalescents (n = 56, 15, 9 for E2.1, E2.2, and E3, respectively), and BA.5 convalescent individuals (n = 14, 17, 9 for E2.1, E2.2, and E3, respectively). The geometric mean IC50s are labelled, and error bars indicate the geometric standard deviation. P-values are calculated using two-tailed Wilcoxon rank sum tests. *, p < 0.05; **, p < 0.01; ***, p < 0.001; NS, not significant, p > 0.05. All neutralization assays were conducted in at least two independent experiments.
Extended Data Fig. 9
Extended Data Fig. 9. Predicted escape hotspots of SARS-CoV-2 variants.
a, Normalized average escape scores weighted by IC50 against D614G using DMS profiles of mAbs from ancestral strain infection or vaccination with a logo plot showing specific mutations on important residues. b, Normalized average escape scores of mAbs from BA.1 breakthrough infection, weighted by IC50 against BA.1. c, Normalized average escape scores of mAbs from ancestral strain infection or vaccination and BA.1 breakthrough infection, weighted by IC50 against BA.2. d, WT/BA.1/BA.2-elicited mAbs with IC50 against BA.2.75 and BA.5, similar to Fig. 4b. All neutralization assays were conducted in at least two independent experiments.
Extended Data Fig. 10
Extended Data Fig. 10. IC50 heatmaps of representative mAbs against constructed Omicron variants.
a, Colour shades indicate IC50 of antibodies (columns) against constructed Omicron BA.2 or BA.5 subvariants (rows) carrying mutations on the epitope of each group. The order of mAbs is the same as in Fig. 4c. b, IC50 of NTD-targeting antibodies against SARS-CoV-2 variants, which is related to Fig. 4e. c, Epitope groups and escape hotspots on BA.2 NTD. All neutralization assays were conducted in at least two independent experiments.
Extended Data Fig. 11
Extended Data Fig. 11. Antigenic map of current SARS-CoV-2 variants.
a, Antigenic map of SARS-CoV-2 variants constructed using plasma neutralization data by principal component analysis (PCA). b, Antigenic map of SARS-CoV-2 variants with constructed Omicron subvariants removed.

References

    1. Chen C, et al. CoV-Spectrum: analysis of globally shared SARS-CoV-2 data to identify and characterize new variants. Bioinformatics. 2021;38:1735–1737. doi: 10.1093/bioinformatics/btab856. - DOI - PMC - PubMed
    1. Cao Y, et al. BA.2.12.1, BA.4 and BA.5 escape antibodies elicited by Omicron infection. Nature. 2022;608:593–602. doi: 10.1038/s41586-022-04980-y. - DOI - PMC - PubMed
    1. Cao Y, et al. Omicron escapes the majority of existing SARS-CoV-2 neutralizing antibodies. Nature. 2022;602:657–663. doi: 10.1038/s41586-021-04385-3. - DOI - PMC - PubMed
    1. Starr TN, et al. Deep mutational scanning of SARS-CoV-2 receptor binding domain reveals constraints on folding and ACE2 binding. Cell. 2020;182:1295–1310.e20. doi: 10.1016/j.cell.2020.08.012. - DOI - PMC - PubMed
    1. Greaney AJ, Starr TN, Bloom JD. An antibody-escape estimator for mutations to the SARS-CoV-2 receptor-binding domain. Virus Evol. 2022;8:veac021. doi: 10.1093/ve/veac021. - DOI - PMC - PubMed

Publication types

MeSH terms

Supplementary concepts