. 2023 Jan 11;51(1):99-116.
doi: 10.1093/nar/gkac1158.

Dynamic phase separation of the androgen receptor and its coactivators key to regulate gene expression

Affiliations

Dynamic phase separation of the androgen receptor and its coactivators key to regulate gene expression

Fan Zhang et al. Nucleic Acids Res. .

Abstract

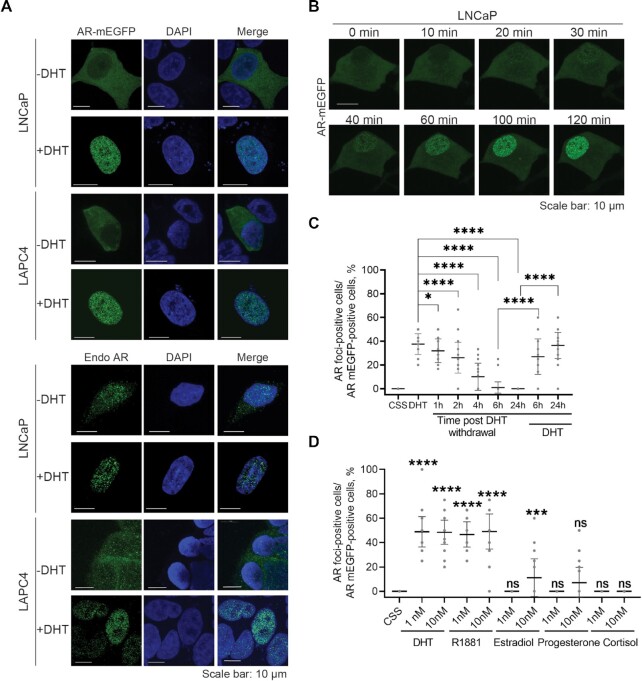
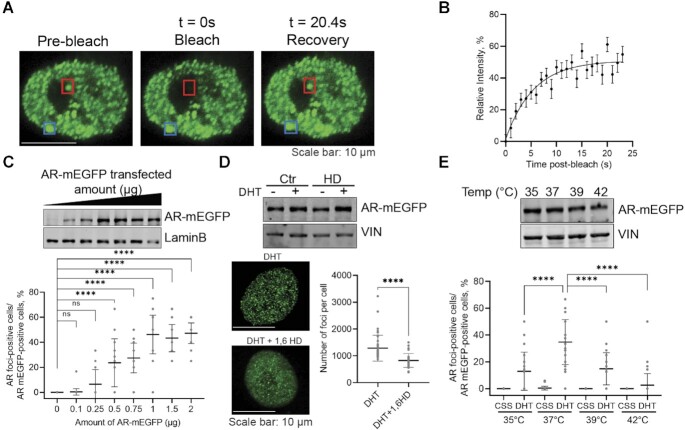
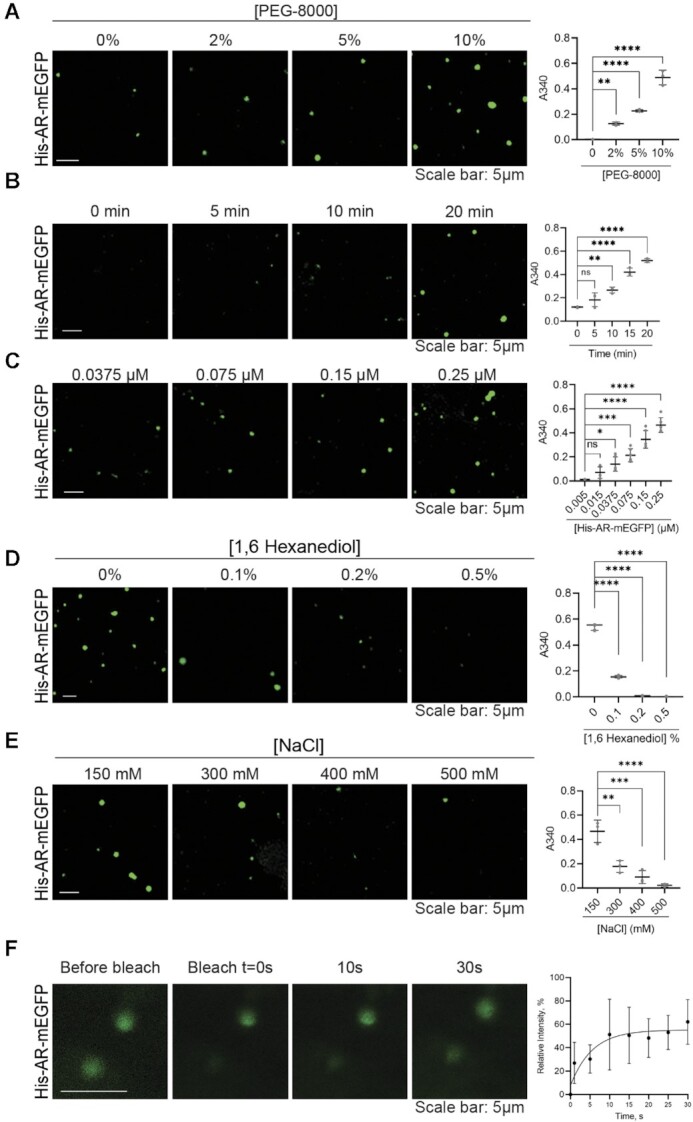
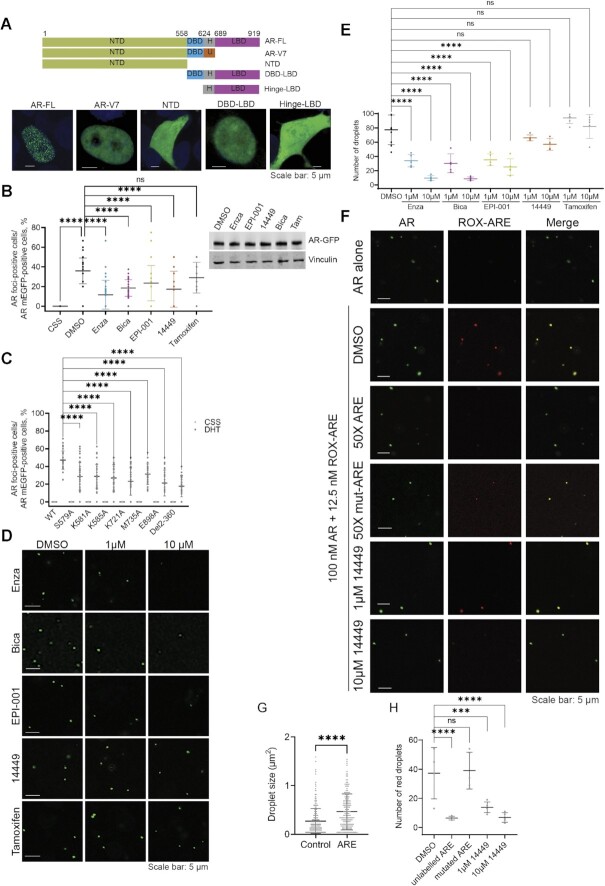
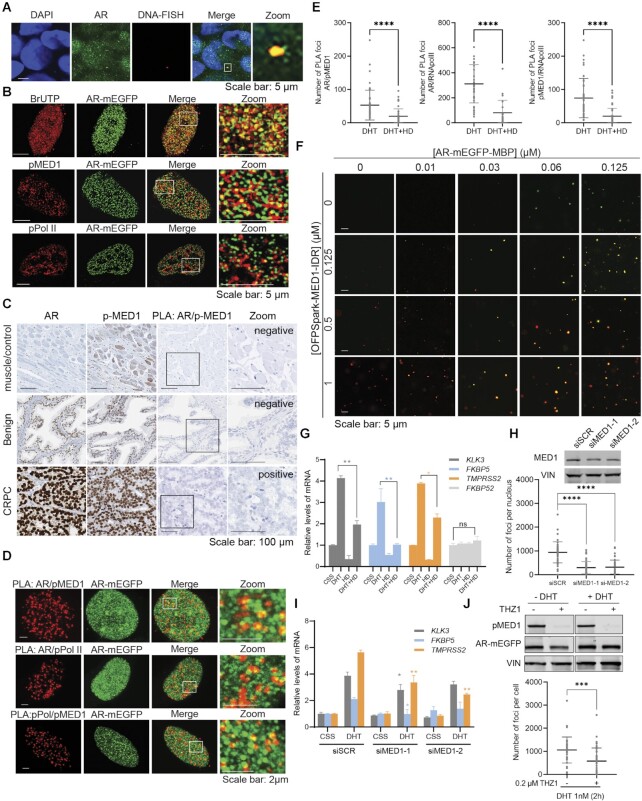
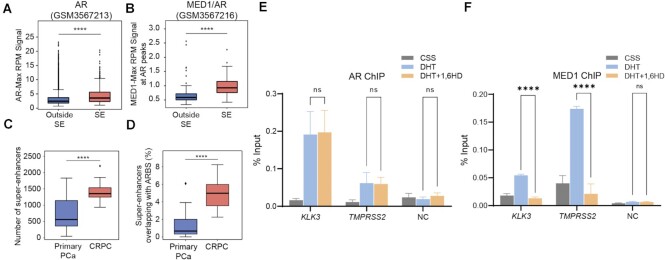
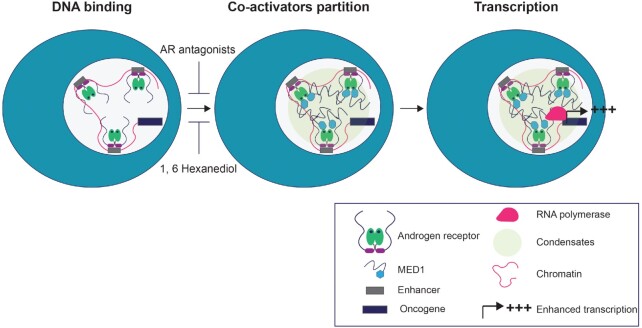
Numerous cancers, including prostate cancer (PCa), are addicted to transcription programs driven by specific genomic regions known as super-enhancers (SEs). The robust transcription of genes at such SEs is enabled by the formation of phase-separated condensates by transcription factors and coactivators with intrinsically disordered regions. The androgen receptor (AR), the main oncogenic driver in PCa, contains large disordered regions and is co-recruited with the transcriptional coactivator mediator complex subunit 1 (MED1) to SEs in androgen-dependent PCa cells, thereby promoting oncogenic transcriptional programs. In this work, we reveal that full-length AR forms foci with liquid-like properties in different PCa models. We demonstrate that foci formation correlates with AR transcriptional activity, as this activity can be modulated by changing cellular foci content chemically or by silencing MED1. AR ability to phase separate was also validated in vitro by using recombinant full-length AR protein. We also demonstrate that AR antagonists, which suppress transcriptional activity by targeting key regions for homotypic or heterotypic interactions of this receptor, hinder foci formation in PCa cells and phase separation in vitro. Our results suggest that enhanced compartmentalization of AR and coactivators may play an important role in the activation of oncogenic transcription programs in androgen-dependent PCa.


Figures

Figure 1.
Figure 1.
AR foci form upon androgen stimulation. (A) Foci formed by transiently expressed and endogenous AR (Endo AR). Cells were cultured with 5% CSS-containing medium for two days then stimulated with 1 nM DHT or ethanol (control) for 2 h. The transiently expressed AR-mEGFP and the immune-stained endogenous AR were inspected under confocal microscope. (B) Time-lapsed foci formation. LNCaP cells expressing AR-mEGFP were hormone starved (5% CSS) for 2 days and then stimulated with 1 nM DHT. A live time-lapse confocal imaging assay was performed along the DHT treatment. (C) Reversibility of foci formation. AR-mEGFP expressing LNCaP cells were starved in 5% CSS for 2 days, treated with DHT for 2 h, and then washed twice to remove DHT. Cells were then cultured in 5% CSS for the indicated time course. DHT was applied back to cells at 6h and 24 h post-DHT removal, respectively. AR-rich foci were quantified. Percentage of AR-mEGFP foci containing cells were quantified from 45 fields of three independent experiments and the data was presented as aligned points with mean ± SD. (D) Androgen dependence of foci formation. AR-mEGFP expressing LNCaP cells were cultured in 5% CSS for 2 days then treated with various hormones and foci formation was quantified as in 1C. One-way ANOVA was used to analyse the data in (C) and (D). P values are indicated by stars: ns ≥ 0.05, * 0.01 to 0.05, ** 0.001 to 0.01, *** 0.0001 to 0.001, **** < 0.0001.
Figure 2.
Figure 2.
AR foci present liquid-liquid condensate characteristics in AR-mEGFP expressing LNCaP cells. (A, B) FRAP assay to examine the diffusion of AR in and out the condensates. Cells were cultured in 5% CSS media for 2 days, then stimulated with 1 nM DHT for 2 h. Foci were photobleached with 100% of laser power for 10 s, the time-lapse imaging on the bleached punctum (red) as well as a reference punctum (blue) were captured with confocal microscope in a Z-stacking model (A). FRAP results are presented as mean ± SD (21 cells from 3 biological replicates) (B). (C) Foci numbers as a function of AR expression levels. Cells transfected with increasing amount of AR-mEGFP plasmid were cultured in 5% CSS media for 2 days and then stimulated with 1 nM DHT for 2 h. AR-rich foci were quantified by confocal microscopy. Data are presented as aligned points and the horizontal bar corresponds to the mean ± SD (45 fields were analysed from 3 biological replicates). The corresponding nuclear AR levels were evaluated by western blot (WB, anti-GFP antibody). (D) AR Foci's response to 1,6-hexanediol (HD). Cells cultured in 5% CSS for 2 days were stimulated with DHT for 2 h, treated with 4% 1,6-HD for 5 min and then fixed. The effect of 1,6-HD on AR protein level was evaluated by WB. The numbers of foci were quantified from 45 cells from three biological replicates and the data is presented as mean ± SD. The graph presents aligned points. (E) Foci formation at different temperatures. Cells starved in 5% CSS for 2 days were cultured at various temperatures for 1 h then 1 nM DHT was added for an additional h and AR-rich condensates were quantified. The effect of temperatures on the stability of AR protein was evaluated by WB. The aligned dotted blot presents the data from 45 fields from three independent experiments with mean ± SD. P values are indicated by stars: ns ≥ 0.05, * 0.01 to 0.05, ** 0.001 to 0.01, *** 0.0001 to 0.001, **** < 0.0001.
Figure 3.
Figure 3.
Recombinant AR protein forms droplets in vitro. (A) Effect of PEG-8000 concentration on His-AR-mEGFP (0.25 μM) droplet formation as characterized by confocal microscopy and turbidity assay after 20 min at room temperature. Droplet formation is associated with increased turbidity and light scattering that could be followed by optical density measurements at 340 nm. (B) Droplets as a function of time. Droplets are formed 15–20 min after incubation with 10% PEG-8000. (C) Droplets as function of His-AR-mEGFPconcentration. The number of droplets increased with the increasing concentrations of His-AR-mEGFP. Effect of 1,6-hexanediol (D) and salt concentration (E) on His-AR-mEGFP droplet formation. His-AR-mEGFP at 0.25 μM was incubated for 20 min in presence of 10% PEG-8000 and increasing concentration of 1,6-hexanediol or NaCl. (F) FRAP assay showing fluorescence recovery after photobleaching of His-AR-mEGFP droplet in comparison to an unbleached droplet and the relative fluorescence intensity of the bleached droplets (mean ± SD, N = 3). Scale bars: 5 μm. P values are indicated by stars: ns ≥ 0.05, * 0.01 to 0.05, ** 0.001 to 0.01, *** 0.0001 to 0.001, **** < 0.0001.
Figure 4.
Figure 4.
Full Length AR is required for foci formation in LNCaP cells. (A) (Top) Different truncated forms of AR-mEGFP: Full length (FL), N-terminal domain (NTD), DNA-binding domain (DBD), hinge region (H) and the ligand-binding domain (LBD). AR variant 7 protein (AR-V7) presents its unique cryptic exon inclusion sequence (U). (Bottom) Foci formation in LNCaP cells transiently transfected by mEGFP tagged truncated AR, starved in 5% CSS for 2 days, then stimulated with 1 nM DHT for 2 h. (B) Impact of AR antagonists on foci formation in LNCaP cells. AR-mEGFP transfected LNCaP cells starved in 5% CSS for 2 days were stimulated with DHT for 2 h and then received treatment with 10 μM of enzalutamide (Enza), bcalutamide (Bica), EPI-001, 14449 and Tamoxifen for 2 h. The aligned points present the data from 45 fields and from three independent experiments with mean ± SD. (Right panel) Western blot showing nuclear AR-mEGFP levels 2 h post-treatment with the studied inhibitors. (C) Effect of mutations or truncation that either disrupt DNA binding or AR N/C interactions on AR foci formation. LNCaP cells were transfected with mEGFP tagged AR constructs and starved in 5%CSS for 2 days then stimulated with DHT for 2 h. Foci formation was quantified and presented as in B. (D) Disruption of AR droplet formation by AR antagonists EPI-001, bicalutamide, 14449 and enzalutamide in vitro. Inhibitors were incubated with AR protein (0.1 μM) in presence of 10% PEG-8000 for 20 min prior to visualization by confocal microscopy. Tamoxifen was used as negative control. (E) Quantification of the impact of antagonists on the number of AR droplets. The data corresponds to the mean ± SD (N = 5). (F) Colocalization of AR-mEGFP-MBP (0.1 μM) and ROX labelled ARE (12.5 nM) and the effect of unlabeled or mutated ARE as well as DBD inhibitor (14449) on this colacalization. (G) Effect of ARE addition on AR droplets size. (H) Quantification of the effect of unlabeled or mutated ARE and 14449 on DNA recruitment to AR droplets. Data are presented as aligned points with mean ± SD (N = 5). P values are indicated by stars: ns ≥ 0.05, * 0.01 to 0.05, ** 0.001 to 0.01, *** 0.0001 to 0.001, **** < 0.0001.
Figure 5.
Figure 5.
Foci formation correlates with AR transcriptional activity in mEGFP expressing LNCaP cells. (A) Co-localization between AR foci and the locus of FKBP5 as detected by immunofluorescence (IF) and DNA-FISH in LNCaP cells transfected with AR-mEGFP, starved for 2 days then stimulated with 1 nM DHT for 2 h. The merge between DAPI staining (blue), AR foci (green) and FKBP5-FISH signal (red) is shown. The area of colocalization is enlarged in the zoom panel. (B) IIF imaging of BrUTP, pMED1 and pPol II. LNCaP cells transfected with AR-mEGFP were starved with 5% CSS for two days and then stimulated with 1 nM DHT for 2 h. For BrUTP incorporation assay (top panel), cells were incubated with BrUTP transfection solution for 30 min and then incubated with culture medium without BrUTP for another 2 h before fixation. IF on BrUTP, pMED1 and pPol II were performed (red panels) and the co-localization with AR-rich foci (green panel) were examined under confocal microscope. Images in the white frames were enlarged and displayed in the right panel. (C) The expression levels of AR and pMED1 were assessed in clinical prostate tumor specimens with the Ventana DISCOVERY Ultra autostainer. The interaction between the two proteins was evaluated by proximity ligation assay (PLA). (D) Colocalization of combined PLA staining (red) and AR-mEGFP (green) in LNCaP cells starved in 5% CSS for 2 days then stimulated with 1 nM DHT. Images in the white frames were enlarged and displayed in the right panels. (E) AR-mEGFP transfected LNCaP cells were grown in 5% CSS for two days and then received 1 nM DHT for 2 h. Cells were then treated with or without 4% 1,6-hexanediol (HD) for 5 min before fixing and PLA staining. The quantification of PLA signal was performed using the same method as foci quantification. The aligned points present the data from 45 cells and from three independent experiments with mean ± SD. (F) AR-mEGFP-MBP droplet and MED1-IDR colocalization in vitro. (G) Effect of HD on mRNA levels of different genes. Cells were starved for 3 days and then treated with 1 nM DHT ± 2.5% HD for 30 min, and then washed and incubated with DHT containing medium for 16 h. Total RNAs were extracted and the mRNA levels of genes of interest were examined using qRT-PCR. Values are expressed as mean ± SD. (H-I) Effects of knocking down of MED1 on AR condensates (H) and on AR transactivation (I). (H) LNCaP cells were transfected with AR-mEGFP plasmid and 6 h later with siRNA targeting MED1 (siMED1) or control (siSCR). Cells were then grown in 5% CSS for 2 days and stimulated with 1 nM DHT for 2 h. Cells were fixed and the foci formation was quantified. The reduction of MED1 protein levels was validated by western blot. Vinculin (VIN) was used as a loading control. The aligned points represent data from 45 cells from three independent experiments. (I) Cells transfected with siSCR or siMED1 were grown in 5% CSS media for 3 days and stimulated with 1 nM DHT for 16 h. Levels of AR-targeting genes were examined with q-RT-PCR. The PCR values are expressed as mean ± SD. (J) Inhibiting MED1 phosphorylation by THZ1 (0.2 μM for 2 h) reduces foci formation without affecting AR protein levels. LNCaP cells transfected with AR-mEGFP plasmid were cultured in 5% CSS for 2 days and then treated with or without 0.2 μM THZ1 for 2 h before the stimulation with 1 nM DHT for 2 h. MED1 phosphorylation and AR-mEGFP protein levels were investigated with WB. The number of Foci formation per nucleus was quantified and presented with aligned dotplot as mean ± SD from 45 cells and from three independent experiments. p values are indicated by stars: ns ≥ 0.05, * 0.01 to 0.05, ** 0.001 to 0.01, *** 0.0001 to 0.001, **** < 0.0001.
Figure 6.
Figure 6.
1,6 Hexanediol treatment affects MED1 recruitment to AR binding sites at SEs. (A, B) Binding intensities at AR binding sites (ARBS) within superenhancers (SE) was increased compared to non-SE sites for both AR (A) and MED1 (B). (C) Number of SEs in primary PCa and CRPC patient samples. SEs were called with the ROSE algorithm from published H3K27ac (GSE130408) of clinical samples from primary PCa or CRPC. (D) The percentage of AR binding sites (ARBS) localizing at SEs in CRPC compared to primary PCa. (E, F) Effect of 1,6-hexanediol (1,6HD) on AR and MED1 binding to specific SEs. LNCaP cells were hormone starved in 5% CSS for 72 h then treated with 1 nM DHT or ETOH for 2 h and followed by 2.5% 1,6-HD for 30 min. The crosslinked chromatin was incubated with AR (E) or MED1 (F) specific antibodies. Enrichment of AR and MED1 at KLK3 and TMPRSS2 sites as well as a negative control (NC) site were quantified by qPCR using specific primers. P values are indicated by stars: ns ≥ 0.05, * 0.01 to 0.05, ** 0.001 to 0.01, *** 0.0001 to 0.001, **** < 0.0001.
Figure 7.
Figure 7.
Model of the recruitment of the AR to superenhancers and the subsequent formation of transcriptional condensates. Our results suggest a model in which AR is recuited post-DHT stimulation to AREs at SEs, enabled by its DBD. Combinations of homotypic as well as heterotypic interactions, including interactions with coactivators such as MED1, may induced phase separatioin and the cooperative recruitment of other factors necessary for enhanced transcriptional activity in PCa cells. Antagonists and 1,6-hexanediol targeting homo and heterotypic AR interactions are preventing phase separation and thus foci formation by AR at SEs.

References

    1. Crawford E.D., Heidenreich A., Lawrentschuk N., Tombal B., Pompeo A.C.L., Mendoza-Valdes A., Miller K., Debruyne F.M.J., Klotz L.. Androgen-targeted therapy in men with prostate cancer: evolving practice and future considerations. Prostate Cancer Prostatic Dis. 2019; 22:24–38. - PMC - PubMed
    1. Devos G., Devlies W., De Meerleer G., Baldewijns M., Gevaert T., Moris L., Milonas D., Van Poppel H., Berghen C., Everaerts W.et al. .. Neoadjuvant hormonal therapy before radical prostatectomy in high-risk prostate cancer. Nat. Rev. Urol. 2021; 18:739–762. - PubMed
    1. Asangani I.A., Blair I., Van Duyne G., Hilser V.J., Moiseenkova-Bell V., Plymate S., Sprenger C., Wand A.J., Penning T.M.. Using biochemistry and biophysics to extinguish androgen receptor signalling in prostate cancer. J. Biol. Chem. 2020; 296:100240. - PMC - PubMed
    1. Liu G., Sprenger C., Wu P.J., Sun S., Uo T., Haugk K., Epilepsia K.S., Plymate S.. MED1 mediates androgen receptor splice variant induced gene expression in the absence of ligand. Oncotarget. 2015; 6:288–304. - PMC - PubMed
    1. Chen Z., Zhang C., Wu D., Chen H., Rorick A., Zhang X., Wang Q.. Phospho-MED1-enhanced UBE2C locus looping drives castration-resistant prostate cancer growth. EMBO J. 2011; 30:2405–2419. - PMC - PubMed

Publication types

LinkOut - more resources