. 2023;15(4):949-970.
doi: 10.1016/j.jcmgh.2022.12.008. Epub 2022 Dec 16.

Hepatocyte Smoothened Activity Controls Susceptibility to Insulin Resistance and Nonalcoholic Fatty Liver Disease

Affiliations

Hepatocyte Smoothened Activity Controls Susceptibility to Insulin Resistance and Nonalcoholic Fatty Liver Disease

Tianyi Chen et al. Cell Mol Gastroenterol Hepatol. 2023.

Abstract

Background & aims: Nonalcoholic steatohepatitis (NASH), a leading cause of cirrhosis, strongly associates with the metabolic syndrome, an insulin-resistant proinflammatory state that disrupts energy balance and promotes progressive liver degeneration. We aimed to define the role of Smoothened (Smo), an obligatory component of the Hedgehog signaling pathway, in controlling hepatocyte metabolic homeostasis and, thereby, susceptibility to NASH.

Methods: We conditionally deleted Smo in hepatocytes of healthy chow-fed mice and performed metabolic phenotyping, coupled with single-cell RNA sequencing (RNA-seq), to characterize the role of hepatocyte Smo in regulating basal hepatic and systemic metabolic homeostasis. Liver RNA-seq datasets from 2 large human cohorts were also analyzed to define the relationship between Smo and NASH susceptibility in people.

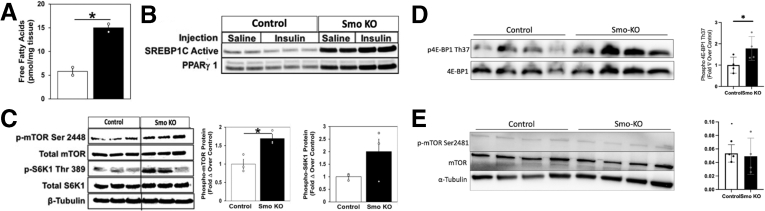
Results: Hepatocyte Smo deletion inhibited the Hedgehog pathway and promoted fatty liver, hyperinsulinemia, and insulin resistance. We identified a plausible mechanism whereby inactivation of Smo stimulated the mTORC1-SREBP1c signaling axis, which promoted lipogenesis while inhibiting the hepatic insulin cascade. Transcriptomics of bulk and single Smo-deficient hepatocytes supported suppression of insulin signaling and also revealed molecular abnormalities associated with oxidative stress and mitochondrial dysfunction. Analysis of human bulk RNA-seq data revealed that Smo expression was (1) highest in healthy livers, (2) lower in livers with NASH than in those with simple steatosis, (3) negatively correlated with markers of insulin resistance and liver injury, and (4) declined progressively as fibrosis severity worsened.

Conclusions: The Hedgehog pathway controls insulin sensitivity and energy homeostasis in adult livers. Loss of hepatocyte Hedgehog activity induces hepatic and systemic metabolic stress and enhances susceptibility to NASH by promoting hepatic lipoxicity and insulin resistance.

Keywords: hedgehog; metabolic syndrome; nonalcoholic fatty liver disease.


Figures

None
Graphical abstract
Figure 1
Figure 1
Hepatocyte-specific Smo-KO induces NAFLD and insulin resistance in mice. (A) Schematic of the Smo-KO study. (B) Quantitative reverse-transcription polymerase chain reaction (qRT-PCR) analysis of Smo in hepatocytes and liver nonparenchymal cells after AAV-TBG-CRE treatment of Smoflox/flox mice. (C) Representative oil red staining in the mouse liver. Scale bars = 100 μm. (D–G) Quantification of serum insulin, Homeostatic Model Assessment for Insulin Resistance, AST, and alanine aminotransferase (ALT) after Smo knockout. (H) Body weights (g) were quantified. Data are displayed as mean ± SEM. Significance was determined using Student’s t test. The error bar indicates SEM. ∗P ≤ .05; ∗∗ P.01. AAV, adeno-associated virus; ns, not significant.
Figure 2
Figure 2
Smo deletion impairs hepatic insulin-IR signaling. (A) Protein immunoblots of IRβ, Akt in control and Smo-KO mice treated with saline or insulin (left). Quantification of the intensity from the blots (right). (B) Protein immunoblots of pIRS1/2 and their total proteins in control and Smo-KO mice treated with saline or insulin (left). Quantification of the intensity from the blots (right). The error bar indicates SEM. ∗P ≤ .05; ∗∗ P.01.
Figure 3
Figure 3
Smo deletion induces genes that promote hepatic gluconeogenesis and inhibits insulin-mediated suppression of blood glucose levels. (A) Protein immunoblots of pFOXO1 and total FOXO1 in control and Smo-KO mice. (B) Representative staining of cytosolic pFOXO1-S256. Scale bars = 10 μm. (C) Quantitative reverse-transcription polymerase chain reaction (qRT-PCR) analysis of Foxo1 and target genes. (D) Blood glucose levels (mg/dL) in control and Smo-KO mice after insulin treatment to assess insulin tolerance. (E) Enrichment analysis of bulk RNA-seq data showing downregulated GO terms in Smo-KO hepatocytes vs control hepatocytes. The error bar indicates SEM. ∗P ≤ .05; ∗∗ P.01.
Figure 4
Figure 4
Smo deletion promote lipogenesis by activating mTOR. (A) Hepatic free fatty acids (pmol/mg) in control and Smo-KO mice. (B) Protein immunoblots of SREBP1c and peroxisome proliferator-activated receptor (PPARγ1) in control and Smo-KO mice treated with saline or insulin. (C, D) Protein immunoblots of pmTOR Ser 2448 and its downstream effectors pS6K1 and p4E-BP1 in control and Smo-KO mice. (E) Protein immunoblots of pmTOR Ser 2481 in control and Smo-KO mice. The error bar indicates SEM. ∗P ≤ .05; ∗∗ P.01.
Figure 5
Figure 5
Integrated single-cell analysis of control and Smo-KO hepatocytes. (A) UMAP plot of all 9207 cells. (B) Cell type annotation. (C) UMAP plots of representative cell type–specific genes (eg, hepatocyte-specific markers), including Hnf4a, Tfr, Tat, Fah, and Cebpa; markers of hepatic stellate cells, including Lrat, Des, and Msn; and markers of Kupffer cells, including Cd52 and Ptprc.
Figure 6
Figure 6
Single-cell analysis reveals hepatocytes with Smo activity localize in midlobular region. (A) UMAP plot of 6895 hepatocytes. (B) Expression of Cyp2f2 and Glul. (C) Cell origin annotation. (D) Percent contribution of cells from AAV8-TBG-Luciferase (blue) and AAV8-TBG-Cre (red) treated mice in each hepatocyte cluster. (E) Heatmap showing correlation between Smo hepatocytes and zonal layers. (F) Enrichment analysis showing downregulation of Hedgehog pathway in Smo-KO hepatocytes.
Figure 7
Figure 7
Analysis of differentially expressed genes demonstrates pathways that are dysregulated after Smo deletion. (A) Heatmap showing downregulation of mitochondrial genes in Smo-KO vs control hepatocytes. (B, C) Pathways that are significantly downregulated or upregulated in Smo-KO hepatocytes.
Figure 8
Figure 8
Smo deletion causes hepatocyte mitochondrial dysfunction and DNA damage. (A) Seahorse studies demonstrate reduced hepatocellular respiration after Smo knockout. ∗∗P ≤ .005 by t test. (B) GSEA analysis of single-cell RNA-seq data from Smo–/– vs Smo+/+ hepatocytes. (C) γH2AX staining in control and Smo-KO livers. Scale bars = 10 μm. (D) Comparison of genes differentially upregulated in Smo–/– hepatocytes and aged hepatocytes vs their respective controls. Fisher’s exact test was used to assess significance of shared upregulated genes (ie, overlap). (E) Functional analysis demonstrates disease categories enriched in the overlapped genes. (F) Correlation between the 2 datasets as calculated using Pearson correlation: r = 0.66, P < 2.2 × 10–16.
Figure 9
Figure 9
Cell type–specific expression of Smo and Ptch1 in mouse livers. (A) Comparison of expression in each cell type. The genes were compared using a normalized set of mouse RNA-seq libraries representing 11 liver cell types (unpublished data, J. Locker, MD, November 2022). (Left) Smo is most strongly expressed in cholangiocytes, fibroblasts, and stellate cells but is also detected in sinusoidal endothelium and hepatocytes. Ptch1 expression is strongest in cholangiocytes, but is detected in hepatocytes, sinusoidal endothelium, stellate cells, B cells, and T cells. In this display, the transcript levels have been normalized by the median values of each RNA-seq library, but because the size of cell-type transcriptomes may be different, any of the detected levels might be significant. (Right) The plot displays the fractional contribution of each cell type to total liver expression and shows that almost all the Smo and Ptch1 transcripts come from hepatocytes, which are calculated to provide 96% of total liver cell transcripts. Calculated proportions of other cell-type transcriptomes in normal liver: cholangiocyte = 0.3%; stellate cell = 1.0%, sinusoidal endothelium = 1.6%, and fibroblast = 0.1%. Each plot is normalized to the maximum expression level. From primary libraries, a set of cell type–specific transcripts was compiled, and for each transcript within the set the following ratio was calculated whole liver transcriptome fraction / cell-type transcriptome fraction. The average of values for multiple transcripts approximated the fraction of the cell-specific transcriptome within the total liver transcriptome. (B) RNA-seq and chromatin immunoprecipitation sequencing visualizations of Smo and Ptch1 in normal liver. Despite relatively low levels, transcripts are clearly detected. The detection of H3K4Me3 (active promoters) and H3K27Ac (transcriptionally active chromatin) indicates that the promoters (arrows) are active in hepatocytes. The datasets are described in reference 113 RNA-seq and chromatin immunoprecipitation sequencing are displayed on log and linear scales, respectively. (C) Smo and Ptch1 co-purify with hepatocytes. The increased expression of Smo suggests that expression is stimulated by isolation, a common reactive phenotype. RNA-seq data were the following: n = 2 for each group; plots show mean ± SD; transcripts are quantified as reads/kb. (D) Cell-type fractions of the total liver transcriptome. The ratios (tL/tc) for multiple cell type–specific genes were averaged for each cell type. The plot shows mean ± SD.
Figure 10
Figure 10
Differential gene expression analysis of human liver samples with or without NAFLD. Liver samples from subjects undergoing evaluation for suspected NAFLD grouped according to histologic diagnosis (normal/nonspecific changes [n = 69] or NAFLD with little to no fibrosis [F0/F1], early bridging fibrosis [F2], and advanced fibrosis [F3/F4] [n = 299]). (A) Heatmap showing genes differentially regulated between groups. (B, C) Pathways that are upregulated or downregulated in NAFLD livers with advanced (F3/F4) fibrosis vs livers without NAFLD (healthy control subjects). LDL, low-density lipoprotein.
Figure 11
Figure 11
Smo expression and NAFLD severity are inversely correlated. Further analysis of patient cohort described in Figure 9. (A) Boxplot of liver Smo expression according to NAFLD fibrosis stage. (B) Correlation between Smo mRNA expression and serum AST. (C, D) Smo mRNA levels vary with NASH activity score and ballooning scores. (E) Smo transcript levels distinguish NAFLD subjects with advanced (F3/F4) fibrosis from those with mild (F0/F1) fibrosis. Area under the curve is shown. (F) Boxplot of liver Smo expression in an independent cohort of NAFLD patients (see text for details). The error bar indicates SEM. ∗P ≤ .05; ∗∗P ≤ .005; ∗∗∗P ≤ .001.
Figure 12
Figure 12
Analysis of mouse-derived Smo positive signature in human NAFLD data. (A) A Smo+ gene signature score was generated by analyzing single-cell RNA-seq data to identify genes that were significantly upregulate healthy control (Smo+/+) vs Smo-deleted (Smo–/–) mouse hepatocytes. Boxplot showing the estimated scores of Smo+ gene signature in patients with healthy-appearing livers (control subjects) and patients with different fibrosis stages of NAFLD. (B) Venn diagram displaying shared gene set that is upregulated in the mouse hepatocyte Smo+ signature and healthy human livers vs Smo-depleted hepatocytes and human livers with advanced (F3/F4) NAFLD fibrosis; gene overlap significance was determined using Fisher’s exact test. (C, D) Boxplot of ALDH6A1 and MAT1A expressions in NAFLD cohort.
Figure 13
Figure 13
Model for Smo-mediated protection from steatosis and lipotoxicity. In healthy livers (left), subpopulations of hepatocytes that express essential Hedgehog (Hh) pathway signaling components (eg, Ptch and Smo) are exposed to Hh ligands that are released from neighboring cells (eg, hepatic stellate cells) and escape the soluble Hh ligand inhibitors (eg, Hhip) that their neighbors also produce. These “free” Hh ligands interact with Ptch on the surface of hepatocytes and this permits activation of Smo to initiate intracellular signaling cascades, one of which leads to the phosphorylation/activation of AMPK. Activated AMPK, in turn, restricts activation of mTORC1 (a kinase that can inhibit both insulin signaling and autophagy). High AMPK activity or low mTORC1 activity limits accumulation of SREBP1c (a lipogenic transcription factor) and supports autophagy of both lipid droplets and damaged mitochondria. Hence, hepatocytes that can activate Smo are sensitive to insulin inhibition of gluconeogenesis and do not become fatty because they have little de novo lipogenesis, are capable of lipophagy, and are enriched with healthy mitochondria that can oxidize fatty acids. In diseased livers (right), stromal cells downregulate their production of Hhip and stressed cells upregulate their production of Hh ligands. All types of liver cells that retain the ability to activate Smo remain sensitive to insulin (a factor that promotes cell viability and proliferation) and are protected from lipotoxcity, enabling their outgrowth and thereby dynamically reconfiguring the hepatic microenvironment to support eventual repopulation of the liver with healthy hepatocytes. However, this healthy regenerative process is not possible if the hepatocyte compartment is unable to activate Smo because Smo-deficient hepatocytes struggle to activate AMPK and thus, exhibit overactivation of mTORC1 which reduces their sensitivity to insulin while impairing clearance of damaged mitochondria and promoting synthesis of lipid substrates that can be oxidized. In aggregate, these responses enhance hepatocyte vulnerability to oxidative stress and lipotoxicity that results from peroxidation of cellular lipids. Lipotoxicity is a dynamic process that can be catalyzed by iron and prevented or reversed by factors that limit production of H2O2, constrain accumulation of lipid targets, or enhance the activity of enzymes that detoxify lipid peroxides. Thus, Smo-deficient cells that experience lipotoxic stress can undergo adaptations that permit their recovery or at least, delay their ultimate demise. The latter response leads to accumulation of Smo-deficient hepatocytes and these metabolically stressed hepatocytes that are no longer able to regenerate amplify their production of Hedgehog ligands and other paracrine wound-healing signals. This promotes fibrogenic repair, which attempts to nurture the outgrowth of hepatocyte replacements. However, repair is destined to be futile or maladaptive unless the hepatocyte population is able to activate Smo and prevent further lipotoxicity. LSEC, liver sinusoidal endothelial cell.

References

    1. Younossi Z., Anstee Q.M., Marietti M., et al. Global burden of NAFLD and NASH: trends, predictions, risk factors and prevention. Nat Rev Gastroenterol Hepatol. 2018;15:11–20. - PubMed
    1. Sanyal A.J., Van Natta M.L., Clark J., et al. NASH Clinical Research Network Prospective study of outcomes in adults with nonalcoholic fatty liver disease. N Engl J Med. 2021;385:1559–1569. - PMC - PubMed
    1. Eslam M., Sanyal A.J., George J., International Consensus Panel MAFLD: A consensus-driven proposed nomenclature for metabolic associated fatty liver disease. Gastroenterology. 2020;158:1999–2014.e1. - PubMed
    1. Ramachandran P., Matchett K.P., Dobie R., et al. Single-cell technologies in hepatology: new insights into liver biology and disease pathogenesis. Nat Rev Gastroenterol Hepatol. 2020;17:457–472. - PubMed
    1. Planas-Paz L., Orsini V., Boulter L., et al. The RSPO-LGR4/5-ZNRF3/RNF43 module controls liver zonation and size. Nat Cell Biol. 2016;18:467–479. - PubMed

Publication types