

Added value of multiple autoantibody testing for predicting progression to inflammatory arthritis in at-risk individuals
- PMID: 36535711
- PMCID: PMC9764647
- DOI: 10.1136/rmdopen-2022-002512
Added value of multiple autoantibody testing for predicting progression to inflammatory arthritis in at-risk individuals
Abstract
Background: Predicting progression to clinical arthritis in individuals at-risk of developing rheumatoid arthritis is a prerequisite to developing stratification groups for prevention strategies. Selecting accurate predictive criteria is the critical step to define the population at-risk. While positivity for anti-citrullinated protein antibodies (ACPA) remains the main recruitment biomarker, positivity for other autoantibodies (AutoAbs) identified before the onset of symptoms, may provide additional predictive accuracy for stratification.
Objective: To perform a multiple AutoAbs analysis for both the prediction and the time of progression to inflammatory arthritis (IA).
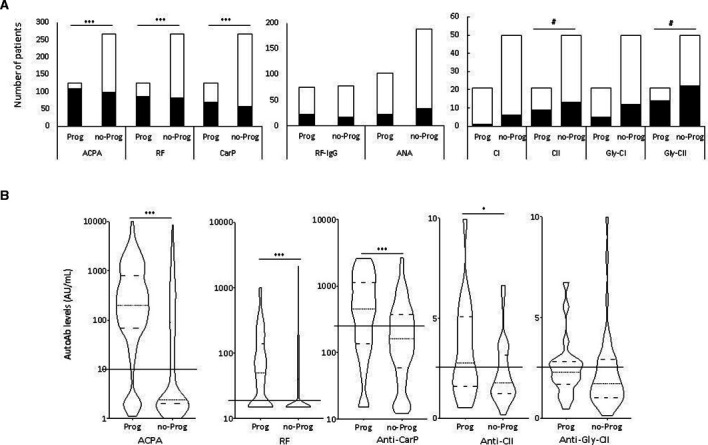
Methods: 392 individuals were recruited based on a new musculoskeletal complaint and positivity for ACPA or rheumatoid factor (RF). ELISAs were performed for ACPA, RF, anti-nuclear Ab, anti-carbamylated protein (anti-CarP) and anti-collagen AutoAbs. Logistic and COX regression were used for analysis.
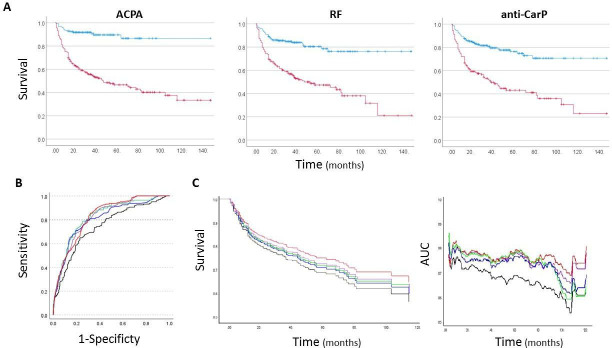
Results: Progression to IA was observed in 125/392 (32%) of cases, of which 78 progressed within 12 months. The AutoAbs ACPA, RF, anti-CarP were individually associated with progression (p<0.0001) and improved prediction when combined with demographic/clinical data (Accuracy >77%; area under the curve (AUC) >0.789), compared with prediction using only demographic/clinical data (72.9%, AUC=0.760). Multiple AutoAbs testing provided added value, with +6.4% accuracy for number of positive AutoAbs (AUC=0.852); +5.4% accuracy for AutoAbs levels (ACPA/anti-CarP, AUC=0.832); and +6.2% accuracy for risk-groups based on high/low levels (ACPA/RF/anti-CarP, AUC=0.837). Time to imminent progression was best predicted using ACPA/anti-CarP levels (AUC=0.779), while the number of positive AutoAbs was/status/risk were as good (AUC=0.778).
Conclusion: We confirm added value of multiple AutoAbs testing for identifying progressors to clinical disease, allowing more specific stratification for intervention studies.
Keywords: Anti-Citrullinated Protein Antibodies; Arthritis, Rheumatoid; Rheumatoid Factor.
© Author(s) (or their employer(s)) 2022. Re-use permitted under CC BY. Published by BMJ.
Conflict of interest statement
Competing interests: LAT is mentioned as an inventor on a patent describing a method to detect anti-CarP antibodies.
Figures
References
-
- Pincus T, Callahan LF. The 'side effects' of rheumatoid arthritis: joint destruction, disability and early mortality. Br J Rheumatol 1993;32 Suppl 1:28–37. - PubMed
Publication types
MeSH terms
Substances
LinkOut - more resources
Full Text Sources
Medical
Research Materials