. 2022 Dec 19;8(1):100.
doi: 10.1038/s41522-022-00364-2.

The tongue biofilm metatranscriptome identifies metabolic pathways associated with the presence or absence of halitosis

Affiliations

The tongue biofilm metatranscriptome identifies metabolic pathways associated with the presence or absence of halitosis

M Carda-Diéguez et al. NPJ Biofilms Microbiomes. .

Abstract

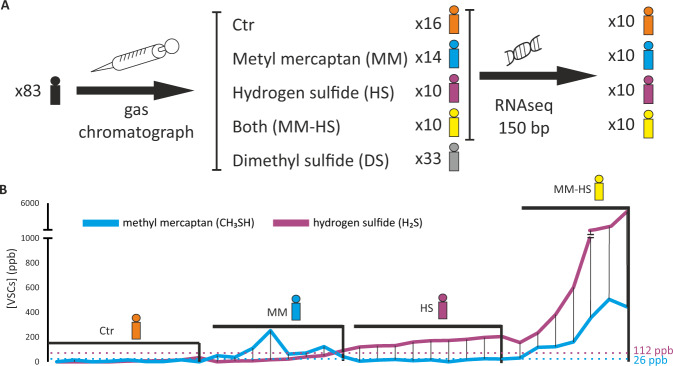
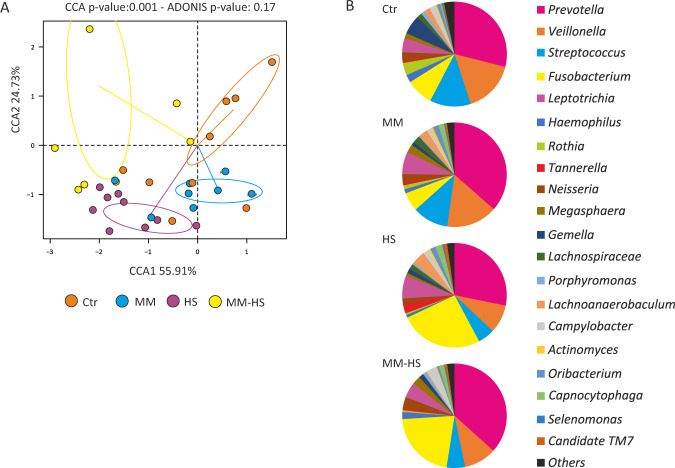
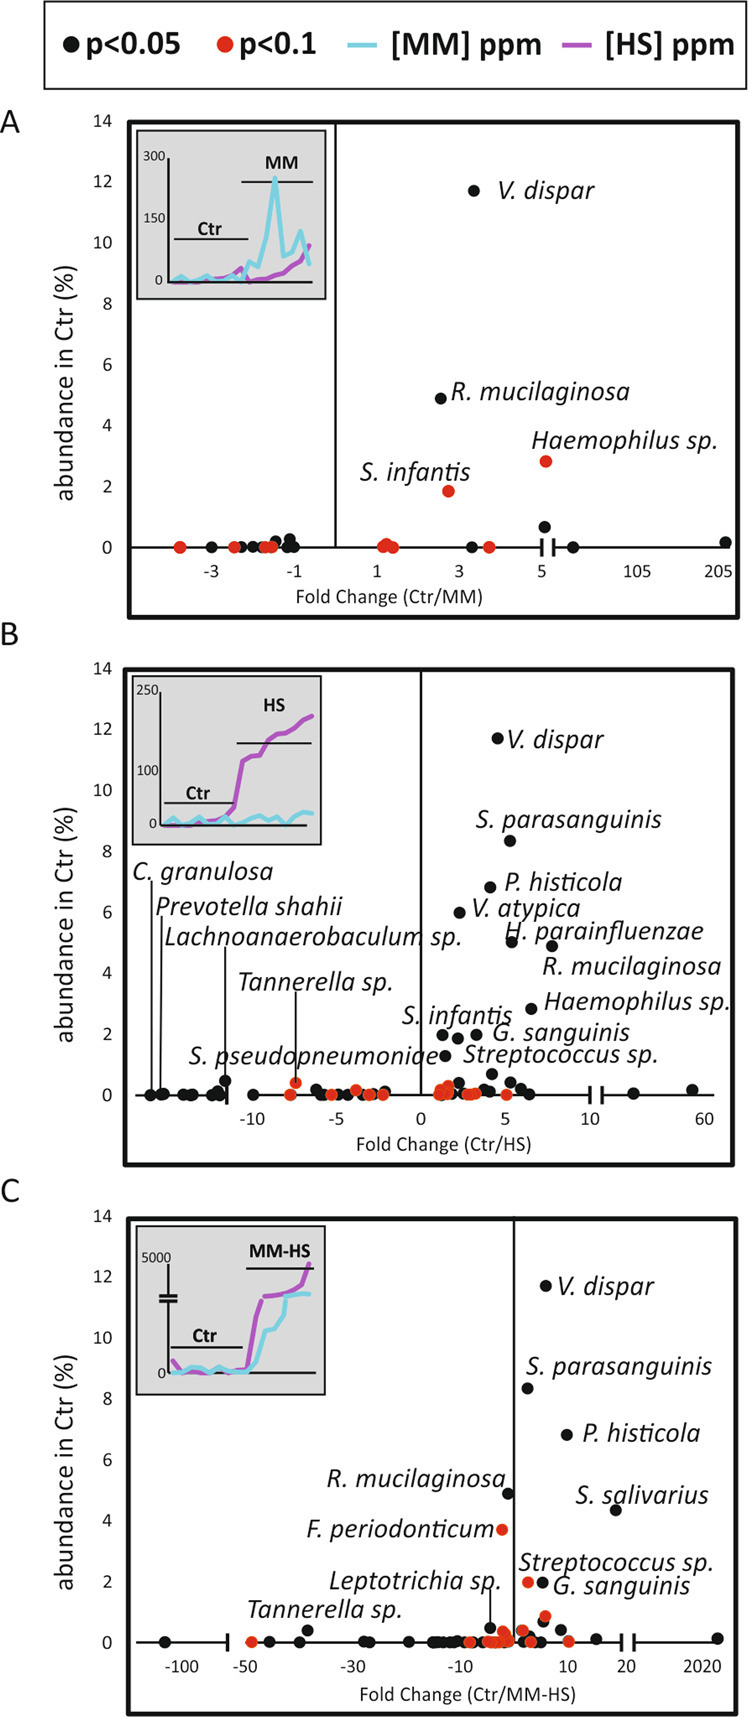
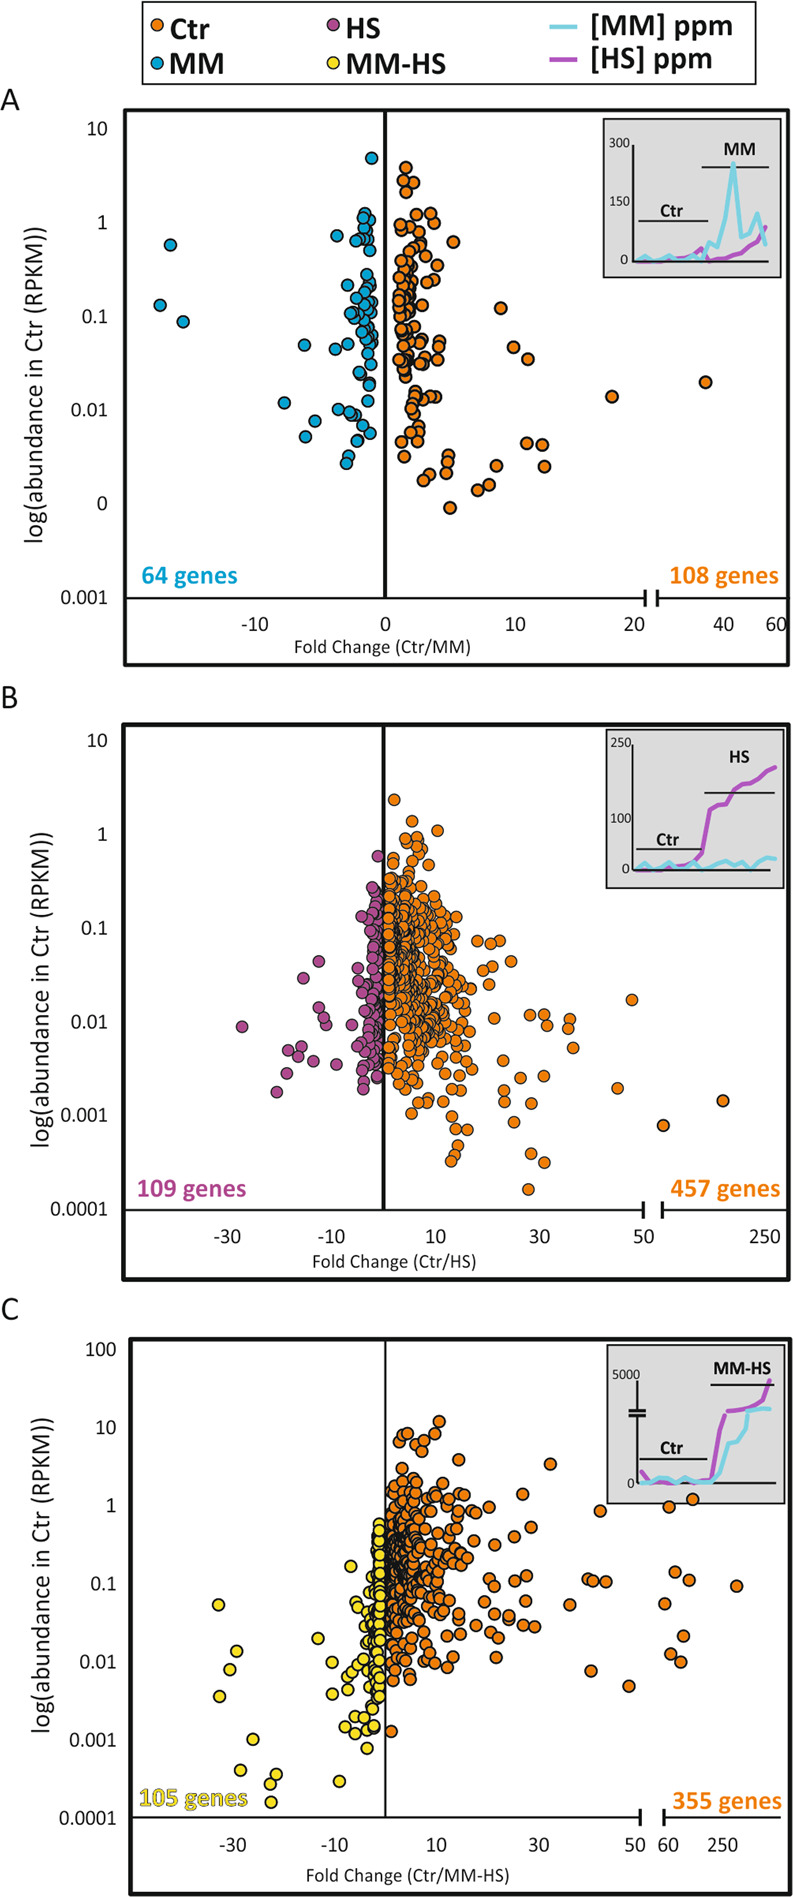
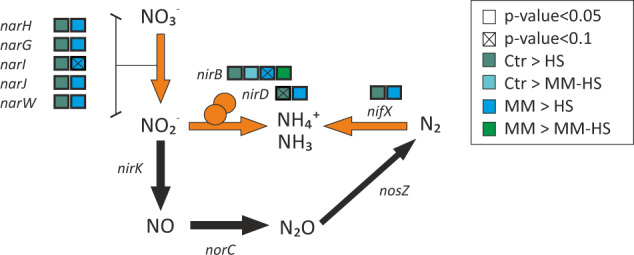
Intra-oral halitosis usually results from the production of volatile sulfur compounds, such as methyl mercaptan and hydrogen sulfide, by the tongue microbiota. There are currently no reports on the microbial gene-expression profiles of the tongue microbiota in halitosis. In this study, we performed RNAseq of tongue coating samples from individuals with and without halitosis. The activity of Streptococcus (including S. parasanguinis), Veillonella (including V. dispar) and Rothia (including R. mucilaginosa) was associated with halitosis-free individuals while Prevotella (including P. shahi), Fusobacterium (including F. nucleatum) and Leptotrichia were associated with halitosis. Interestingly, the metatranscriptome of patients that only had halitosis levels of methyl mercaptan was similar to that of halitosis-free individuals. Finally, gene expression profiles showed a significant over-expression of genes involved in L-cysteine and L-homocysteine synthesis, as well as nitrate reduction genes, in halitosis-free individuals and an over-expression of genes responsible for cysteine degradation into hydrogen sulfide in halitosis patients.


Conflict of interest statement

The authors declare no competing interests.

Figures

Fig. 1
Fig. 1. Study design for the metatranscriptomic analysis of tongue coating in halitosis.
A The concentrations of three Volatile Sulfur Compounds (VSCs) in breath samples from 83 individuals was measured by gas chromatography and based on the levels of those gases, different groups were differentiated. Tongue biofilm samples were collected, and the extracted RNA was sequenced in 10 individuals per group. B The concentrations (ppb) of the two main intra-oral VSCs, methyl mercaptan and hydrogen sulfide, are shown for the 40 individuals whose transcriptomic profile was analyzed. The dotted lines indicate the consensus threshold concentration for halitosis.
Fig. 2
Fig. 2. Profiles of active microbiota in healthy and halitosis groups.
Active microbiota composition, as determined by the metatransciptomic data, was compared between groups in a CCA plot using ADONIS test A. The pie charts represent the top-20 most abundant genera in each group B. Ctr Control group, MM methyl mercaptan group, HS hydrogen sulfide group, MM-HS methyl mercaptan+hydrogen sulfide group (both gases over the halitosis threshold). The CCA p-values (ADONIS permanova) indicated that all groups differed significantly from each other (p < 0.007), except Ctr and MM (p = 0.078).
Fig. 3
Fig. 3. Microbial differences between control and halitosis metatranscriptomes.
The graph shows bacterial species with significant differences (p < 0.05; DESeq2 test) or a statistical trend (0.05 < p < 0.1) between the control group and MM (A), HS (B) or MM-HS (C) groups. The Y-axis represents the abundance of each bacterial species in the control group, whereas the X-axis represents the difference in abundance as fold-change (Control/halitosis). The names of those species with >1% abundance are indicated. The concentrations of VSCs in the samples from the two groups compared are also shown, for reference.
Fig. 4
Fig. 4. Halitosis and halitosis-free bacterial biomarkers.
The bar graphs show bacteria with a significant difference in abundance in the metatranscriptome between control and halitosis patients, which could serve as potential biomarkers of health and halitosis in tongue biofilms. Three potential halitosis-free biomarkers (V. dispar, R. mucilaginosa and S. parasanguinis) and two potential halitosis biomarkers (P. shahii and F. periodonticum) are plotted for each identified group. RPKM: Number of mRNA reads normalized by gene length (Kbp) and by sequence coverage (Mbp). *p < 0.05 (DESeq2 test); **p < 0.1 (DESeq2 test). Standard deviation was used for error bars.
Fig. 5
Fig. 5. Microbial differences in gene expression (metatranscriptomic) profiles.
The plots show genes with significant differences (p < 0.05; DESeq2 test) in expression between the control group and MM (A), HS (B) or MM-HS (C) groups. The Y-axis indicates the abundance of each gene in the control group whereas the X-axis represents the difference in gene expression, expressed as fold change (Control/Halitosis). The concentrations of VSCs in each sample from the two groups compared are also plotted, for reference. The total number of genes significantly over-expressed in each group is indicated for each comparison in blue and red. RPKM: Number of mRNA reads normalized by gene length (Kbp) and by sequence coverage (Mbp).
Fig. 6
Fig. 6. Gene expression profiles in the metabolic route involved in VSCs formation.
The diagram represents the genes involved in the formation of HS and MM (A). The over-expression of a gene in a group is indicated with a coloured box. The expression levels (measured as RPKM) for the gene mccB are indicated for each group (B). Differences in the expression of the three subunits of the methionine membrane transporter are also shown (C). RPKM: Number of mRNA reads normalized by gene length (Kbp) and by sequence coverage (Mbp). DESeq2 test was used to calculate the p-values.
Fig. 7
Fig. 7. Nitrate metabolic pathways and halitosis.
The diagram represents the nitrate metabolism reactions that were differentially expressed (orange arrows) between the tongue metatranscriptome of halitosis-free individuals and halitosis patients, as well as additional reactions that involved nitrogen-related metabolites (black arrows). The over-expression (DESeq2 test) of a gene in a group is indicated by a coloured box.

References

    1. Nachnani, S. Oral malodor: causes, assessment, and treatment. Compend. Contin. Educ. Dent. 32, 22–4, 26–8, 30–1; quiz 32, 34 (2011) - PubMed
    1. Söder B, Johansson B, Söder PO. The relation between foetor ex ore, oral hygiene and periodontal disease. Swed. Dent. J. 2000;24:73–82. - PubMed
    1. Miyazaki H, Sakao S, Katoh Y, Takehara T. Correlation Between Volatile Sulphur Compounds and Certain Oral Health Measurements in the General Population. J. Periodontol. 1995;66:679–684. doi: 10.1902/jop.1995.66.8.679. - DOI - PubMed
    1. Silva MF, et al. Estimated prevalence of halitosis: a systematic review and meta-regression analysis. Clin. Oral. Investig. 2018;22:47–55. doi: 10.1007/s00784-017-2164-5. - DOI - PubMed
    1. Ren W, et al. Tongue Coating and the Salivary Microbial Communities Vary in Children with Halitosis. Sci. Rep. 2016;6:24481. doi: 10.1038/srep24481. - DOI - PMC - PubMed

Publication types