. 2022 Dec 19;13(1):7816.
doi: 10.1038/s41467-022-35037-3.

A comparison of the genes and genesets identified by GWAS and EWAS of fifteen complex traits

Affiliations

A comparison of the genes and genesets identified by GWAS and EWAS of fifteen complex traits

Thomas Battram et al. Nat Commun. .

Abstract

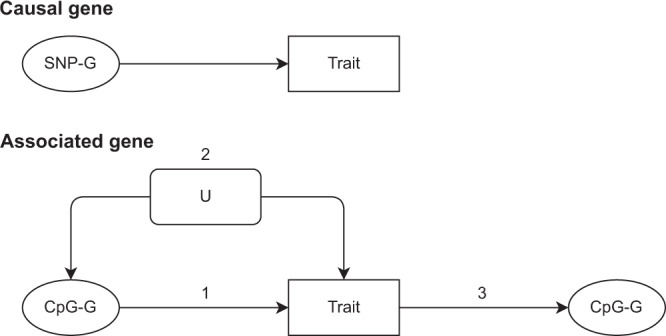
Identifying genomic regions pertinent to complex traits is a common goal of genome-wide and epigenome-wide association studies (GWAS and EWAS). GWAS identify causal genetic variants, directly or via linkage disequilibrium, and EWAS identify variation in DNA methylation associated with a trait. While GWAS in principle will only detect variants due to causal genes, EWAS can also identify genes via confounding, or reverse causation. We systematically compare GWAS (N > 50,000) and EWAS (N > 4500) results of 15 complex traits. We evaluate if the genes or gene ontology terms flagged by GWAS and EWAS overlap, and find substantial overlap for diastolic blood pressure, (gene overlap P = 5.2 × 10⁻⁶; term overlap P = 0.001). We superimpose our empirical findings against simulated models of varying genetic and epigenetic architectures and observe that in most cases GWAS and EWAS are likely capturing distinct genesets. Our results indicate that GWAS and EWAS are capturing different aspects of the biology of complex traits.


Conflict of interest statement

The authors declare no competing interests.

Figures

Fig. 1
Fig. 1. A diagram of causal and associated genes.
A causal gene is one where the product of that gene affects the trait of interest and in this study, we are assuming that SNPs identified in relation to a trait will affect these genes or tag SNPs that do (SNP-G). An associated gene is one where the product of that gene correlates with the trait of interest, but may not affect it. In this study, we are assuming that CpG sites identified in relation to a trait will map to these genes (CpG-G). The diagram shows how a gene product may be correlated with a trait: 1. by affecting the trait, 2. by sharing a common cause with the trait (confounding), 3. by being affected by the trait (reverse causation). A geneset may be composed of causal and associated gene products. U = confounder.
Fig. 2
Fig. 2. Overlap between genomic positions identified by corresponding GWAS and EWAS.
The genome was divided into 500kb regions. Those where no probes on the HM450 array measured DNAm were excluded from the analysis. This left 5591 regions. Regions were counted as being identified by a GWAS if one or more SNPs in that region associated with the trait and as being identified by an EWAS if one or more CpGs in that region associated with the trait. Neither = no GWAS or EWAS sites identified in the region, GWAS = GWAS sites only were identified, EWAS = EWAS sites only were identified, Both = Both GWAS and EWAS sites were identified, AC alcohol consumption per day, BW birthweight, BMI body mass index, Cog cognitive ability (digit test), CRP c-reactive protein, CsNs current smokers vs never smokers, DBP diastolic blood pressure, EA educational attainment, Gluc fasting glucose, Ins fasting insulin, FEV1 forced expiratory volume in one second, FsNs former smokers vs never smokers, SBP systolic blood pressure.
Fig. 3
Fig. 3. Power to detect overlap between genes and genesets identified by corresponding GWAS and EWAS.
Simulations were set up as illustrated in Box 1 and simulations iterated over each set of parameters 1000 times. EWAS power is equivalent to the proportion of associated genes (Assoc genes) EWAS is detecting. In the scenario where Assoc genes = 500, EWAS power = 1, and the proportion of causal EWAS genes = 0.05, the EWAS is detecting 500 genes, 25 of which are causal. Panel A show results when the proportion of causal EWAS genes = 0.05 and panel B show results when the proportion of causal EWAS genes = 1. The area under receiver operator curves (AUC) was used to estimate the ability to distinguish between results generated when GWAS and EWAS were sampling, in part, from the same set of causal genes and results generated when EWAS was sampling random genes from the genome. Error bars represent the 95% confidence intervals of the AUC estimates. The header of each set indicates the proportion of genes identified by the simulated EWAS that were set to be causal. ORg = assessing overlap of genes, ORp = assessing overlap of genesets, ρp = assessing correlation between geneset enrichment scores. GO gene ontology, PPI protein–protein interaction database from EpiGraphDB. This is a summary of the results, full results can be found in Supplementary Fig. 3.
Fig. 4
Fig. 4. Simulations to understand the likely number of genes still to identify in GWAS and EWAS of C-reactive protein and smoking (former vs. never smokers) under different trait architectures.
Simulations were set up as illustrated in Supplementary Fig. 4. Correlation of geneset enrichment scores from empirical data (Table 3), is shown as a red dashed line. Box plots show the range of enrichment score correlations from 1000 simulations using the parameters indicated. The number of causal and associated genes, as well as the number of associated genes that were causal were varied. Already discovered EWAS genes were added to the pool of associated genes and already discovered GWAS genes were added to the pool of causal genes. The proportion of simulated associated genes that were causal is shown on the X-axis. The number of causal genes and associated genes were equal in each simulation. Scenarios which lie close to the empirical result (red dashed line) are more likely to reflect the true underlying number of genes related to a trait and the true overlap between the causal and associated genes. Where there is evidence that on average the geneset enrichment scores from a simulation scenario are different to the empirical enrichment score (FDR < 0.05, z-test for difference), the box outline is grey, otherwise it is black. The centre of the box plots are the median, the bounds of the box represent the interquartile range (IQR), the upper whisker represents either the minimum of (1.5 multiplied by the IQR) + the 75% percentile and the maximum value, the lower whisker represents the maximum of 25% percentile − (1.5 multiplied by the IQR) and the maximum value. Values that fall outside the whiskers are marked as points.

References

    1. Rakyan VK, Down TA, Balding DJ, Beck S. Epigenome-wide association studies for common human diseases. Nat. Rev. Genet. 2011;12:529–541. doi: 10.1038/nrg3000. - DOI - PMC - PubMed
    1. Relton CL, Davey Smith G. Epigenetic epidemiology of common complex disease: prospects for prediction, prevention, and treatment. PLoS Med. 2010;7:e1000356. doi: 10.1371/journal.pmed.1000356. - DOI - PMC - PubMed
    1. Birney E, Smith GD, Greally JM. Epigenome-wide association studies and the interpretation of disease-omics. PLoS Genet. 2016;12:e1006105. doi: 10.1371/journal.pgen.1006105. - DOI - PMC - PubMed
    1. Sharp, G. C. et al. Maternal BMI at the start of pregnancy and offspring epigenome-wide DNA methylation: findings from the pregnancy and childhood epigenetics (PACE) consortium. Human Mol. Genet.26, 4067–4085 (2017). - PMC - PubMed
    1. Reese, S. E. et al. Epigenome-wide meta-analysis of DNA methylation and childhood asthma. J. Allergy Clin. Immunol.143, 2062–2074 (2019). - PMC - PubMed

Publication types