. 2023 Jan;30(1):107-114.
doi: 10.1038/s41594-022-00895-4. Epub 2022 Dec 19.

Polλ promotes microhomology-mediated end-joining

Affiliations

Polλ promotes microhomology-mediated end-joining

Gurushankar Chandramouly et al. Nat Struct Mol Biol. 2023 Jan.

Erratum in

  • Author Correction: Polλ promotes microhomology-mediated end-joining.
    Chandramouly G, Jamsen J, Borisonnik N, Tyagi M, Calbert ML, Tredinnick T, Ozdemir AY, Kent T, Demidova EV, Arora S, Wilson SH, Pomerantz RT. Chandramouly G, et al. Nat Struct Mol Biol. 2023 Jul;30(7):1048. doi: 10.1038/s41594-023-00993-x. Nat Struct Mol Biol. 2023. PMID: 37059901 No abstract available.

Abstract

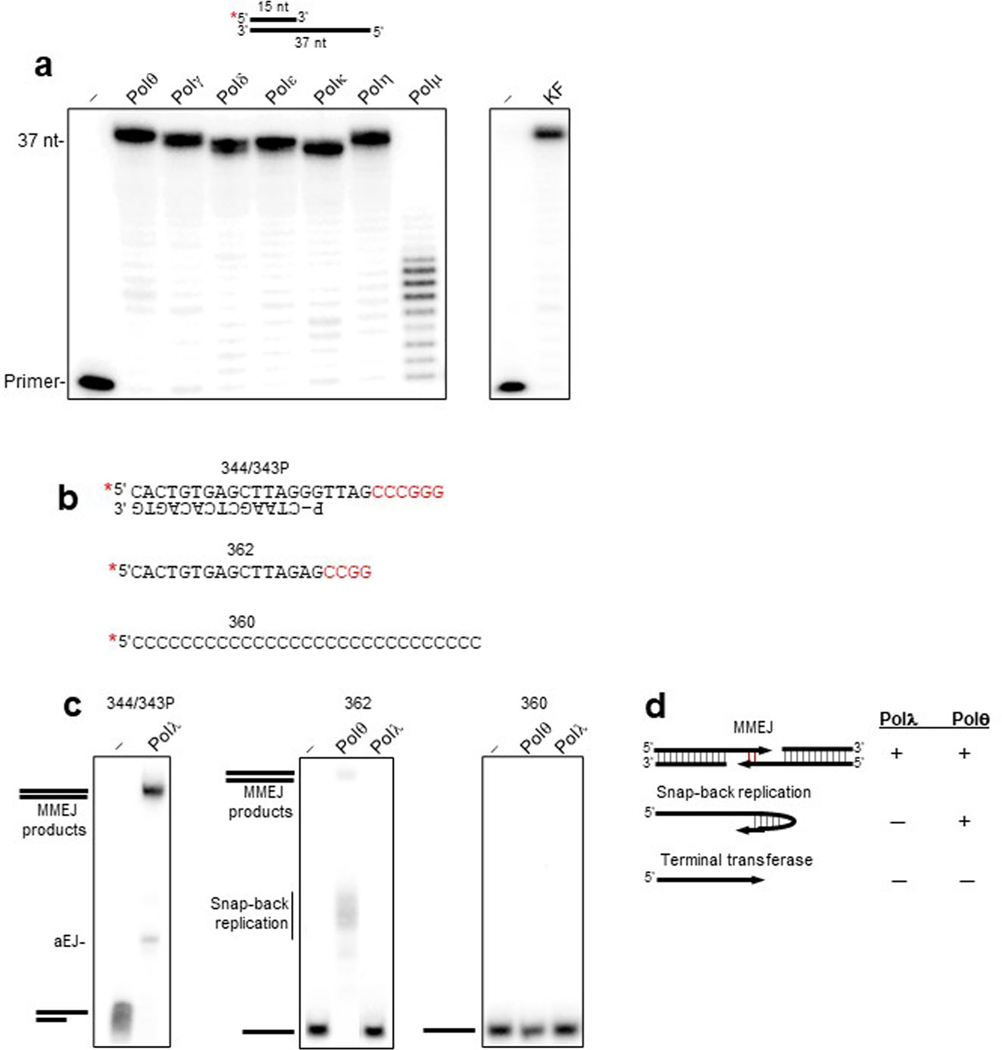
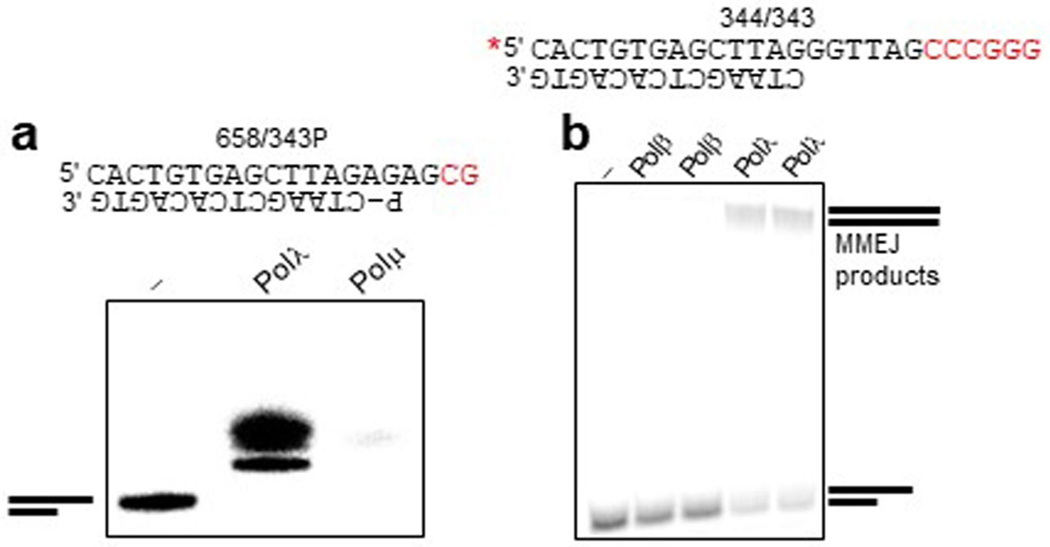
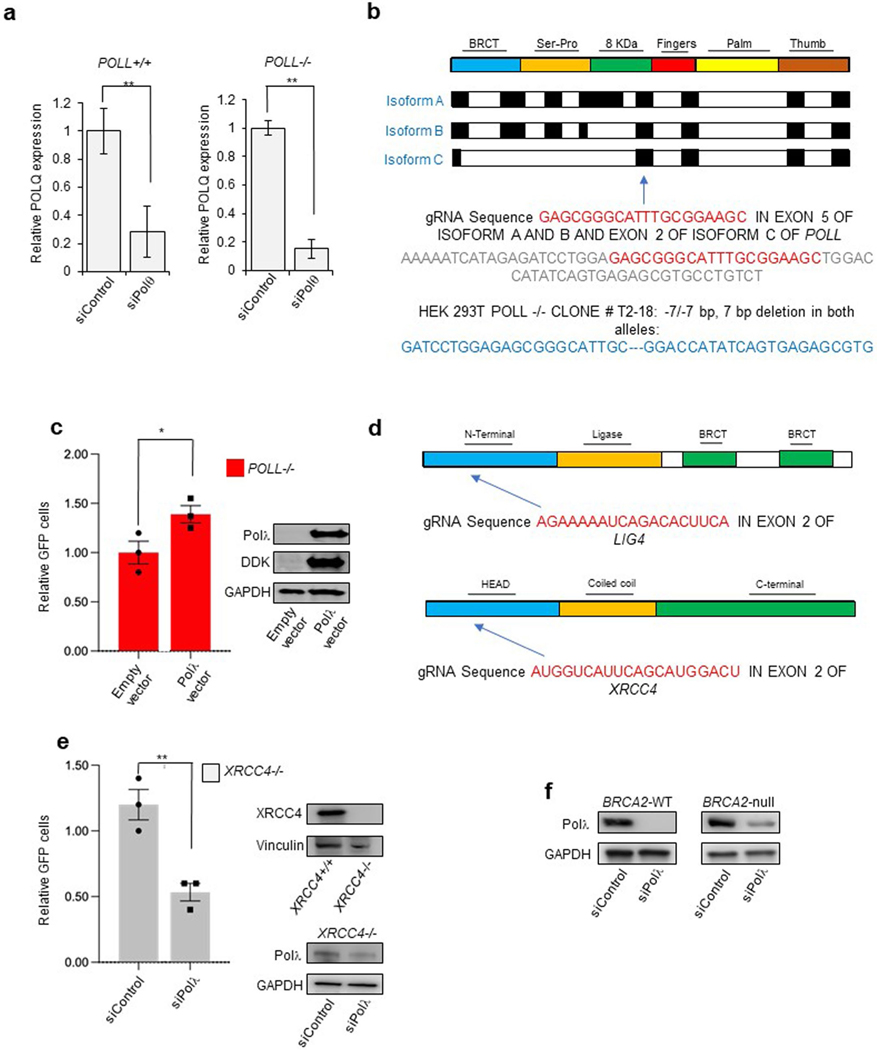
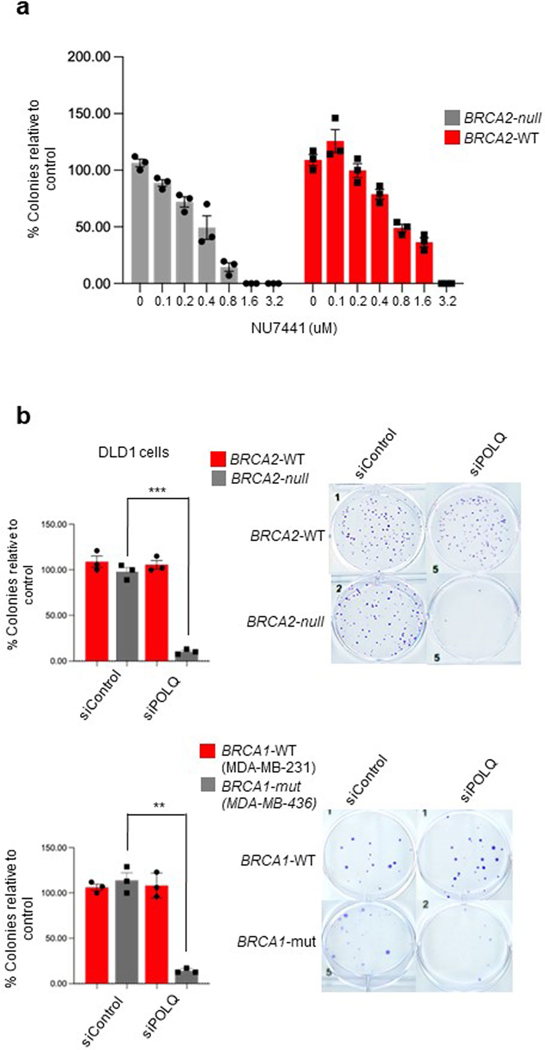
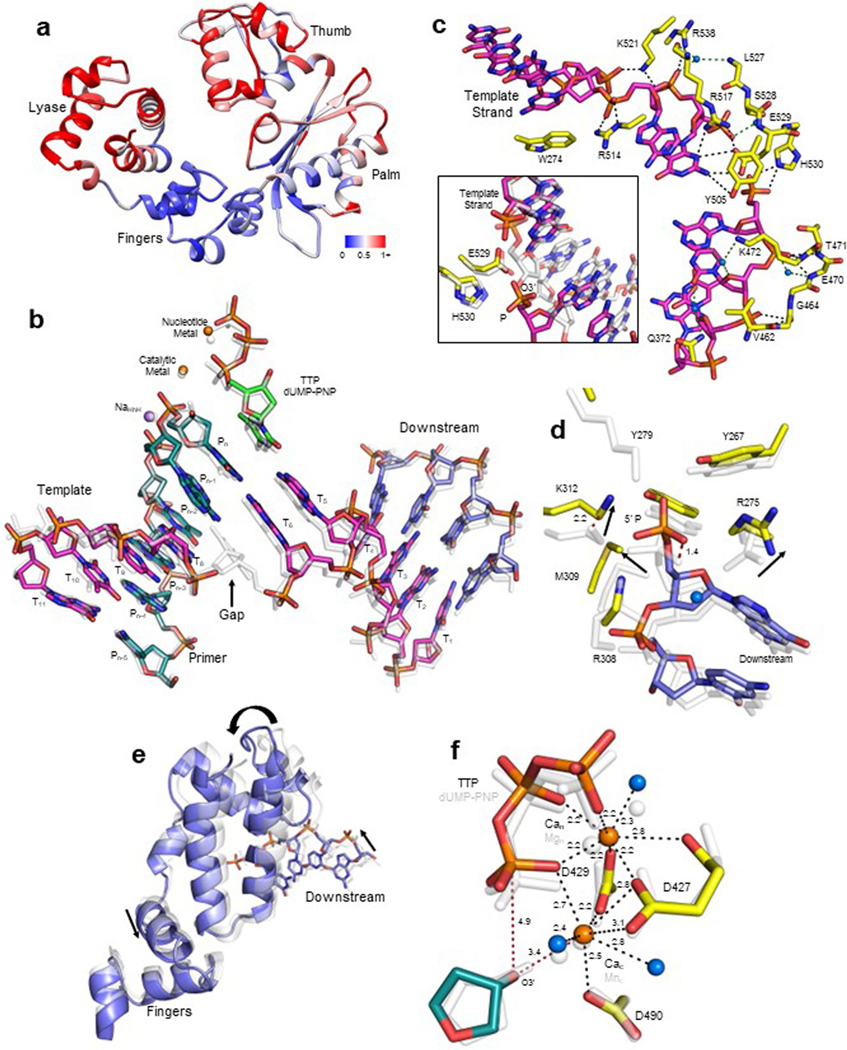
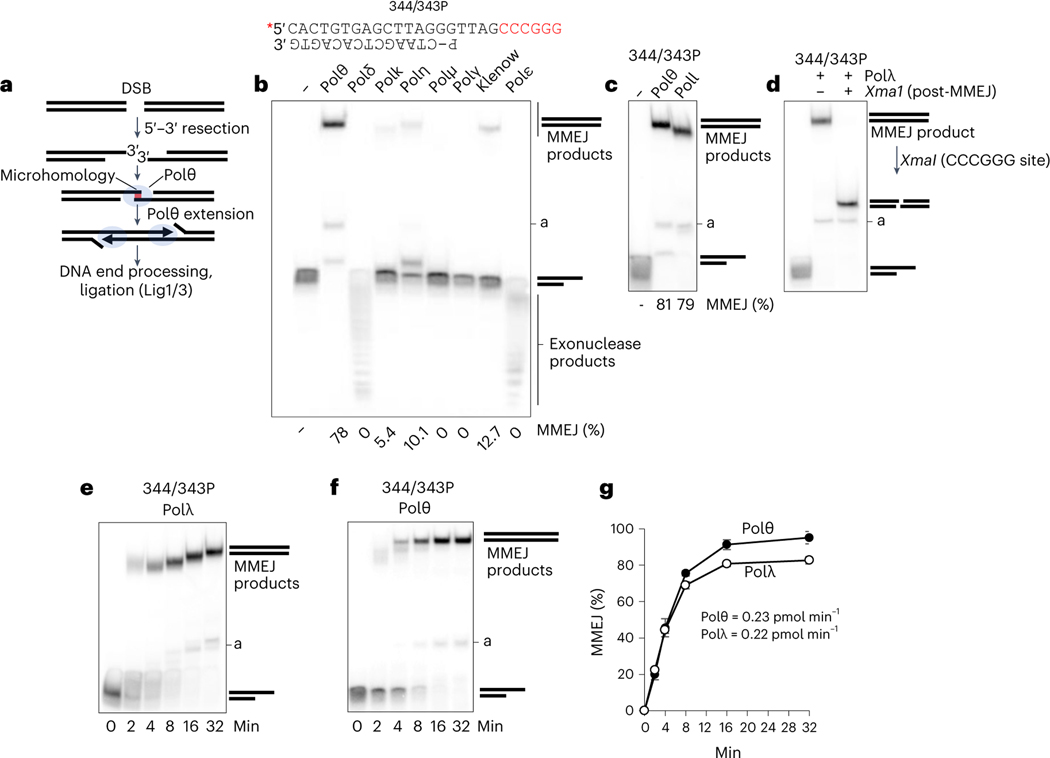
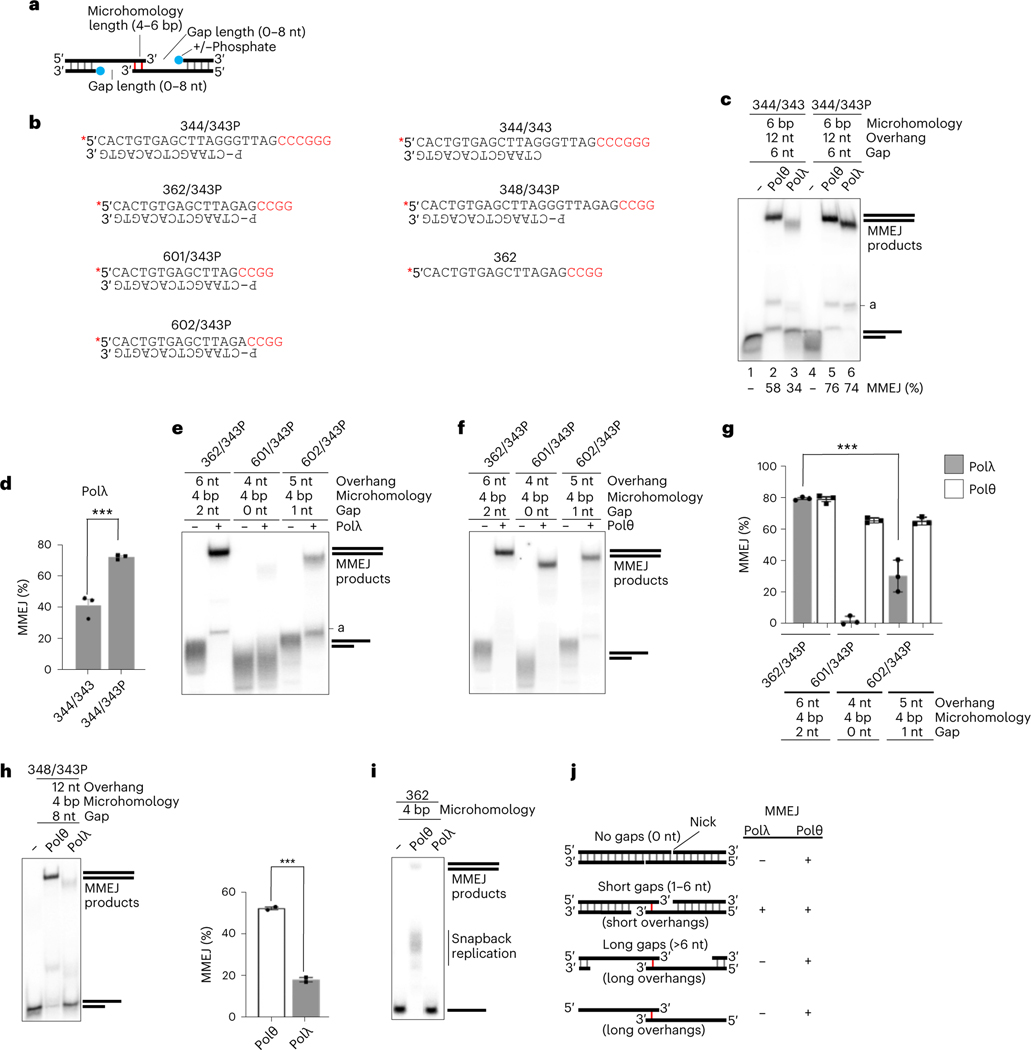
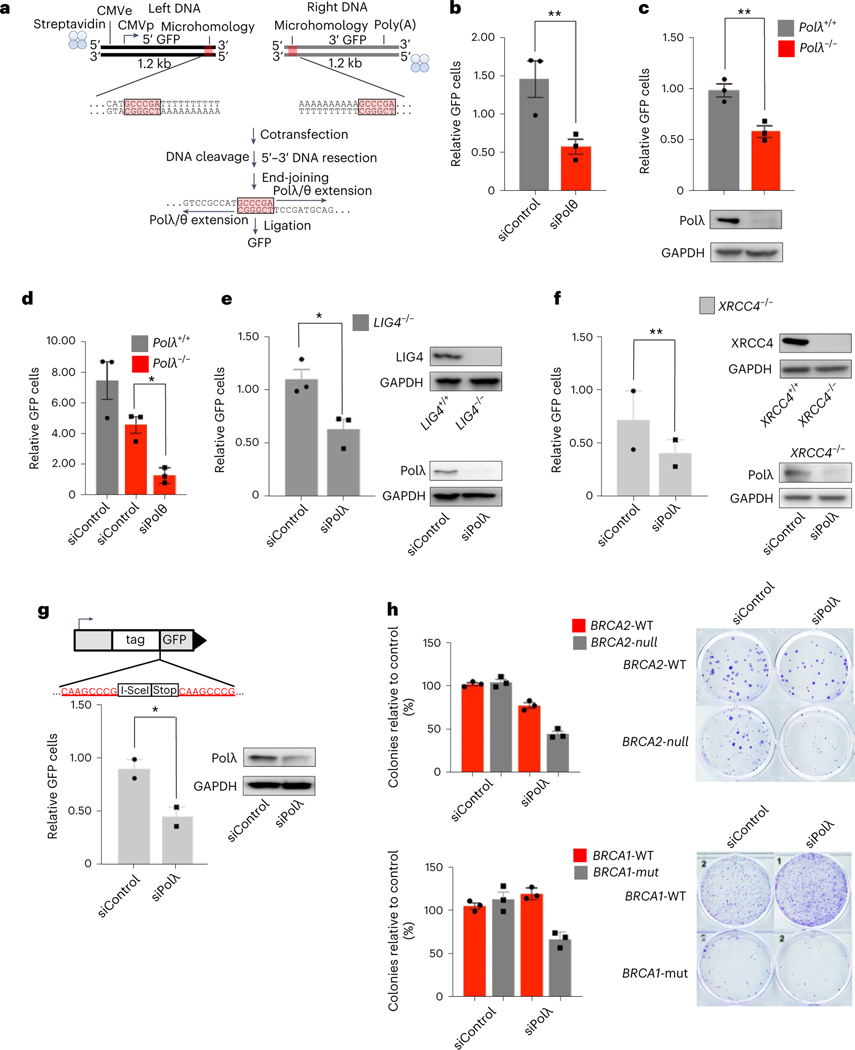
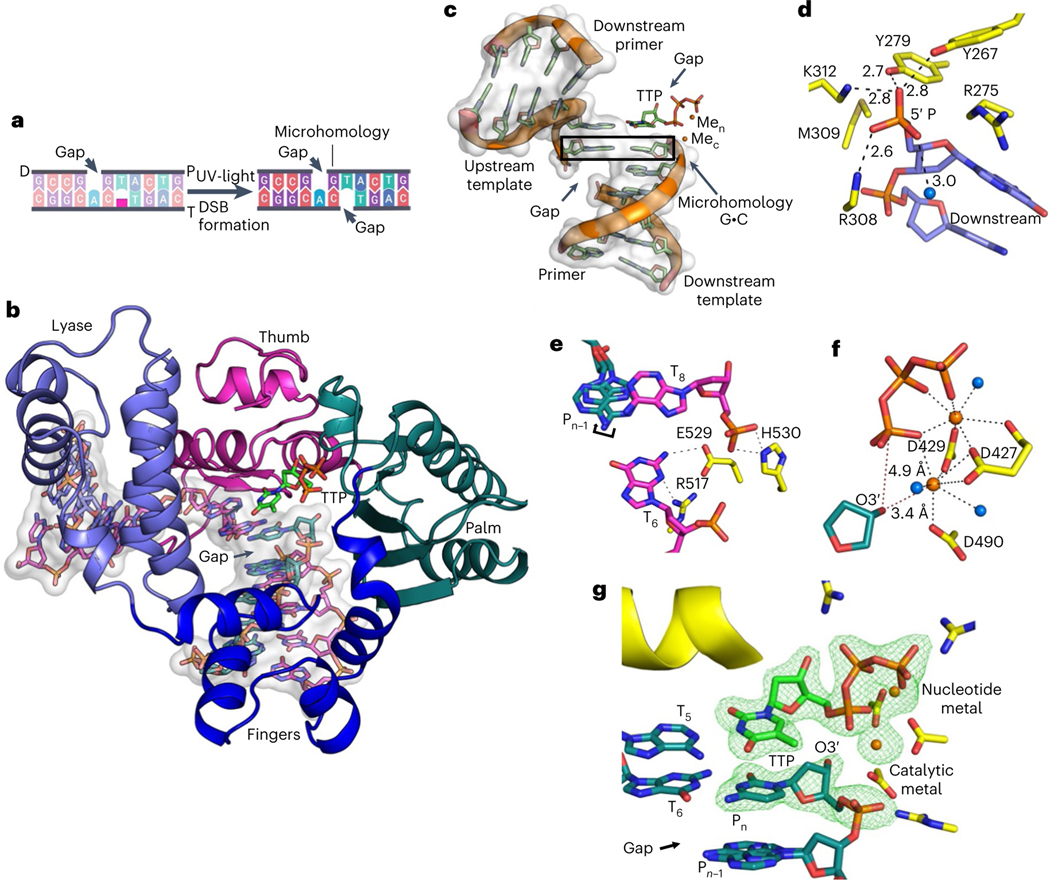
The double-strand break (DSB) repair pathway called microhomology-mediated end-joining (MMEJ) is thought to be dependent on DNA polymerase theta (Polθ) and occur independently of nonhomologous end-joining (NHEJ) factors. An unresolved question is whether MMEJ is facilitated by a single Polθ-mediated end-joining pathway or consists of additional undiscovered pathways. We find that human X-family Polλ, which functions in NHEJ, additionally exhibits robust MMEJ activity like Polθ. Polλ promotes MMEJ in mammalian cells independently of essential NHEJ factors LIG4/XRCC4 and Polθ, which reveals a distinct Polλ-dependent MMEJ mechanism. X-ray crystallography employing in situ photo-induced DSB formation captured Polλ in the act of stabilizing a microhomology-mediated DNA synapse with incoming nucleotide at 2.0 Å resolution and reveals how Polλ performs replication across a DNA synapse joined by minimal base-pairing. Last, we find that Polλ is semisynthetic lethal with BRCA1 and BRCA2. Together, these studies indicate Polλ MMEJ as a distinct DSB repair mechanism.


Figures

Extended Data Fig. 1 |
Extended Data Fig. 1 |. Controls for Pol activity on primer-templates and substrates containing 3’ ssDNA.
a, Denaturing gels showing extension of the indicated primer-template by the indicated Pols using identical conditions. Polμ is known to require a downstream ssDNA strand for optimal activity primer extension activity along a short gap. 20 nM Pol concentrations were used. b, Schematic of DNA templates. Microhomology indicated as red text. c, Non-denaturing gel showing Polλ MMEJ as a positive control for its activity (left panel). Denaturing gels showing extension of the indicated templates in the presence of all 4 dNTPs by the indicated Pols (middle and right panel). 20 nM Pol concentrations were used. d, Schematic showing the respective activities of Polθ and Polλ on the indicated templates. although both enzymes perform MMEJ (top), only Polθ exhibits ssDNA extension due to its snap-back replication activity.
Extended Data Fig. 2 |
Extended Data Fig. 2 |. Controls for Pol activity on MMEJ substrates.
a, Denaturing gel showing extension of a pssDNA substrate containing 2 bp of microhomology in the presence of dCTP. Polλ but not Polμ performs addition of dCMP on the indicated substrate. Microhomology indicated as red text. 20 nM Pol concentrations were used. b, Non-denaturing gel showing MMEJ activity by the indicated Pols on the indicated pssDNA containing 6 bp of microhomology (red text). Polλ performs MMEJ whereas Polβ does not. Reactions were performed in duplicate. 20 nM Pol concentrations were used.
Extended Data Fig. 3 |
Extended Data Fig. 3 |. Supplemental data for protein expression, genetic engineering, and MMEJ activity.
a. RT qPCR analysis of Polθ expression. mRNA levels were corrected with internal control for Actin in siRNA-treated cells used in Fig. 3b, d as well as normalized to non-targeting siRNA (siControl = 1). Data represent mean. n = 1 experiment with triplicate for each condition ±SEM. b. gRNA sequence used to generate POLL−/− HEK293T cells via CRISPR-Cas9 engineering. Schematic representation of three isoforms of human Polλ with protein domains as well as location of gRNA sequence (red) is indicated. The genome sequence flanking the gRNA sequence (red) is shown in gray. POLL −/− clone # T2 was generated by CRISPR-Cas9 engineering and carries 7 bp deletion in both alleles. Sequence of the region harboring the 7 bp deletion is indicated in blue. c. Bar plot showing relative GFP following overexpression of indicated plasmids and co- transfection of left and right MMEJ reporter DNA constructs in HEK293T cells. GFP+ frequencies are normalized to transfection efficiency. Data represent mean. n = 1 experiment with triplicates for each condition, +/− s.e.m. Bottom panel: Immunoblot showing abundance of protein. d. gRNA sequence used to generate LIG4 −/− HEK293T cells (top) and XRCC4 −/− HEK293T cells (bottom) via CRISPR-Cas9 engineering. Schematic representation of human Lig4 (top) and Xrcc4 (bottom) with protein domains as well as location of gRNA sequence is indicated (red). e. Same as in Fig. 3f in XRCC4−/− HCT116 cells. Data represent mean. n = 1 experiment with triplicate for each condition, +/− s.e.m. Bottom panel: Immunoblot showing abundance of protein. f. Western blot of Polλ (top) and Gapdh (bottom) following transfection of either Polλ siRNA or siControl in DLD1 BRCA2+/+ (left) and DLD1 BRCA2 −/− cells (right).
Extended Data Fig. 4 |
Extended Data Fig. 4 |. Analysis of synthetic lethality interactions in BRCA1/2-deficient cells.
a. Plot showing percentage of colonies relative to control after treatment with indicated concentrations of DNA-PK inhibitor (NU-7441) in DLD1 BRCA2 −/− or DLD1 Parental cells. Data represent mean. n = 1 experiment with triplicate for each condition, ± s.e.m. b. Bar plots showing percentage of colonies relative to control after siRNA transfection with either siControl or siPolθ in DLD1 BRCA2 −/− or DLD1 Parental cells (top), in MDA 436 BRCA1 mut or MDA 231 cells (bottom). Percentage of colonies are normalized to non-targeting siRNA (siControl = 100). Data represent mean. n = 1 experiment with triplicate for each condition, ± s.e.m. Colony images are on the right.
Extended Data Fig. 5 |
Extended Data Fig. 5 |. Supporting data for the structural basis of Polλ MMEJ activity.
a. Structural comparison of Polλ bound to a microhomology-mediated DNA synapse and a single nucleotide gap (PDB id 2PFO). Differences (0−4.2 Å) in backbone Cα positioning are displayed as a heatmap colored from blue (0 Å) to white (0.5 Å) to red (1+Å) mapped onto the structure of the double strand break bound pol λ in cartoon representation. b. Overlay of the microhomology substrate containing gaps in template and primer strands with a single nucleotide gap substrate (PDB id 2PFO, transparent gray). Incoming TTP (green) or dUMPNPP (transparent gray) and downstream (magenta), primer (cyan), template (purple) strands are shown in stick representation. The orange spheres are active site metal ions and the purple sphere is a sodium atom. c. Template strand interactions in DSB bound Polλ. Template strand (magenta) and sidechains (yellow) are shown in stick representation. Key interactions are shown with black (side chains) or green (water) dashes. Waters are shown as blue spheres. Inset. Comparison of template strand positioning and gap marginal nucleotide interactions in structures of Polλ with a nick in the template strand (white transparent sticks, PDB id 7M0D) and a gap in the same position (yellow sidechains, purple DNA). d. Differences in downstream 5′ phosphate coordination overlaid with the structure of a single nucleotide gap (PDB id 2PFO, transparent gray). e. Lyase domain and downstream primer shift compared to the structure with a single nucleotide gap (PDB id 2PFO). Protein backbone and DNA are shown in magenta cartoon and stick representation, respectively. f. Metal coordination in the active site. Shown is an overlay with a structure of Polλ bound to a single nucleotide gap and a non-hydrolyzable nucleotide (PDB id 2PFO, transparent gray).
Fig. 1 |
Fig. 1 |. Polλ exhibits MMEJ activity similar to that of Polθ.
a, Schematic of MMEJ. Following 5′−3′ DNA resection, Polθ promotes microhomology-mediated synapsis of 3′ ssDNA overhangs then performs strand extension. b, Schematic of pssDNA 344/343P. Red text, microhomology; P, phosphate (top). Nondenaturing gel showing MMEJ activity by the indicated Pols. MMEJ (%) is shown at the bottom; a, abortive end-joining. c, Nondenaturing gel showing MMEJ activity by the indicated Pols. d, Nondenaturing gel showing XmaI digestion of the MMEJ product formed by Polλ. e,f, Nondenaturing gels showing a time course of MMEJ by Polλ (e) and Polθ (f). Experiments in bf were all repeated with three independent samples and all yielded similar results. g, Scatter plot showing the relative rates of MMEJ by Polθ and Polλ; n = 3 independent samples, ± s.d. Relative steady-state rates of DNA joined by MMEJ are indicated.
Fig. 2 |
Fig. 2 |. Polλ specializes in MMEJ of DNA with short 3′ ssDNA overhangs.
a, Schematic showing pssDNA modifications. b, Schematic of pssDNA and ssDNA templates. Red text, microhomology; asterisk, radiolabel; P, 5′-phosphate. c, Nondenaturing gel showing MMEJ by Polθ and Polλ on the indicated templates with and without 5′-phosphate on the resected strand. MMEJ (%) indicated. Experiment was repeated with three independent samples and all yielded similar results. d, Bar plot showing MMEJ (%) by Polλ on the indicated templates. Data represent means; n = 3 independent samples, ± s.d. *P < 0.05, **P < 0.01, ***P < 0.001. Statistical significance from two-sample t-test between 344/343 and 344/343P, P = 0.0008. e,f, Nondenaturing gels showing MMEJ by Polλ (e) and Polθ (f) on the indicated templates. Experiment was repeated with three independent samples and all yielded similar results. g, Bar plot showing MMEJ (%) by Polλ and Polθ on the indicated templates. Data represent means; n = 3 independent samples, ± s.d. *P < 0.05, **P < 0.01, ***P < 0.001. Statistical significance from two-sample t-test between 362/343P and 602/343P for Polλ, P = 0.0005. h, Nondenaturing gel showing MMEJ activity by Polλ and Polθ on the indicated template. Bar plot showing MMEJ (%) by Polλ and Polθ on the indicated template (right). Data represent means; n = 3 independent samples, ± s.d. *P < 0.05, **P < 0.01, ***P < 0.001. Statistical significance from two-sample t-test between Polθ and Polλ, P = 0.0006. i, Nondenaturing gel showing MMEJ and snapback replication activities by Polλ and Polθ on the indicated template. j, Summary table comparing the respective MMEJ activities of Polλ and Polθ on different templates.
Fig. 3 |
Fig. 3 |. Polλ promotes MMEJ independently of Polθ and NHEJ factors.
a, Top, schematic of MMEJ reporter containing 5′-streptavidin-biotin linkages. Middle, internal termini of left and right MMEJ reporter DNA constructs. Bottom, schematic of MMEJ reporter assay. bf, Bar plots showing relative GFP frequencies following cotransfection of left and right MMEJ reporter DNA constructs, with immunoblots showing abundance of protein shown in c and eg. b, GFP+ frequencies are shown relative to nontargeting siRNA (siControl = 1) in wildtype HEK293T cells; n = 3; P = 0.01. c, GFP+ frequencies relative to POLλ+/+ 293T cells (POLλ+/+ = 1). n = 3, P = 0.01. d, Same as in b in POLλ−/− 293T cells. n = 3, P = 0.03. e, GFP+ frequencies relative to nontargeting siRNA (siControl = 1). n = 3, P = 0.04. f, GFP+ frequencies relative to nontargeting siRNA (siControl = 1) in XRCC4−/− 293T cells. Data represent means. n = 2, P = 0.04. g, MMEJ GFP reporter assay. Schematic of GFP reporter assay (top). Bar plot of percentage of GFP cells following transient expression of I-SceI and cotransfection of either Polλ siRNA or Control siRNA. n = 2, P = 0.04. h, Bar plots showing percentage of colonies relative to control after siRNA transfection in DLD1 BRCA2−/− or DLD1 Parental cells (top), in MDA-MB-436 BRCA1 mut or MDA-MB-231 cells (bottom). Percentage of colonies are normalized to nontargeting siRNA (siControl = 100). n = 1. Colony images are on the right. In b and cg, GFP+ frequencies are normalized to transfection efficiency. Data represent means. ‘n’ denotes number of independent experiments with triplicates for each condition, ± s.e.m. *P < 0.05, **P < 0.01, ***P < 0.001. Statistical significance was measured from two-sample t-test and P values are indicated.
Fig. 4 |
Fig. 4 |. Structural basis for Polλ MMEJ activity.
a, A photocleavable nucleotide (pink) was converted into a nucleotide gap within the Polλ-DNA crystal via UV light, resulting in a MMEJ synapse bridged by a single G-C base pair. T, template strand; P, primer strand; D, downstream strand. b, Structure of Polλ:MMEJ synapse with incoming nucleotide. Polymerase subdomains, lyase (magenta), fingers (blue), palm (green) and thumb (purple), are shown as cartoon. DNA (purple, template strand; cyan, primer strand; magenta, downstream strand) and TTP are shown in stick representation. Atomic volume for the DNA is shown as a transparent white surface. c, Overall DSB substrate conformation. Microhomology is outlined with a black rectangle. TTP and DNA bases are shown in stick representation with the phosphate backbone as cartoon. Orange spheres, catalytic (Mec) and nucleotide (Nac) metals. Atomic volume is shown as white transparent surface. d, Downstream 5′-phosphate coordination of the polymerase-bound microhomology. Sidechains (yellow) and downstream DNA (magenta) are shown in stick representation. Lyase domain sidechain 5′ phosphate coordination is shown with black dashes; distances (Å) are indicated. Sidechains are shown in yellow stick representation. Blue sphere, water molecule. e, Template strand gap stabilization. Stabilizing sidechain interactions with the template marginal phosphates are shown with black dashes. A curved arrow indicates alternate conformations of the base of the primer strand nucleotide opposite the template strand gap. f, Key active site distances and metal coordination. Coordination (black) and key distances (red) are indicated with dashes. g, Active site conformation is consistent with catalysis. Simulated annealing (Fo−Fc) density is shown for TTP, primer terminal (Pn) nucleotide and active site metal atoms. Helix N that stacks with the incoming nucleotide is shown as a yellow cartoon.

References

    1. Moynahan ME & Jasin M. Mitotic homologous recombination maintains genomic stability and suppresses tumorigenesis. Nat. Rev. Mol. Cell Biol 11, 196–207 (2010). - PMC - PubMed
    1. Zhao B, Rothenberg E, Ramsden DA & Lieber MR The molecular basis and disease relevance of non-homologous DNA end joining. Nat. Rev. Mol. Cell Biol 21, 765–781 (2020). - PMC - PubMed
    1. Bennardo N, Cheng A, Huang N. & Stark JM Alternative-NHEJ is a mechanistically distinct pathway of mammalian chromosome break repair. PLoS Genet. 4, e1000110 (2008). - PMC - PubMed
    1. Yan CT et al. IgH class switching and translocations use a robust non-classical end-joining pathway. Nature 449, 478–482 (2007). - PubMed
    1. Boboila C. et al. Alternative end-joining catalyzes robust IgH locus deletions and translocations in the combined absence of ligase 4 and Ku70. Proc. Natl Acad. Sci. USA 107, 3034–3039 (2010). - PMC - PubMed

Publication types

LinkOut - more resources