. 2023 Feb;24(2):359-370.
doi: 10.1038/s41590-022-01371-3. Epub 2022 Dec 19.

Profound phenotypic and epigenetic heterogeneity of the HIV-1-infected CD4+ T cell reservoir

Affiliations

Profound phenotypic and epigenetic heterogeneity of the HIV-1-infected CD4+ T cell reservoir

Vincent H Wu et al. Nat Immunol. 2023 Feb.

Abstract

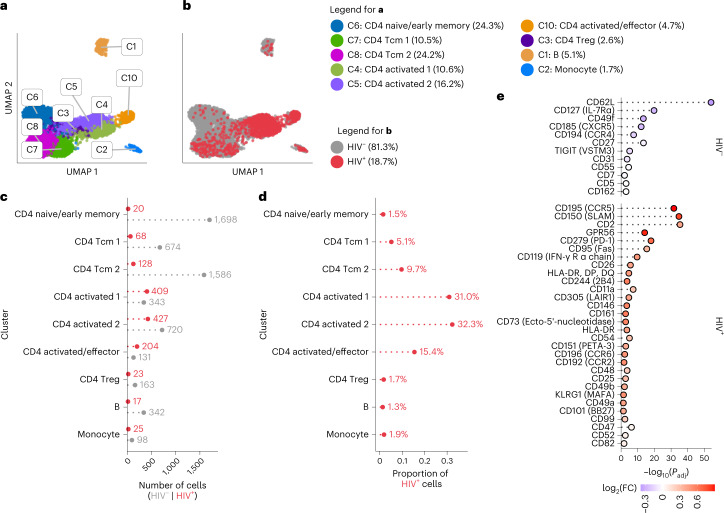
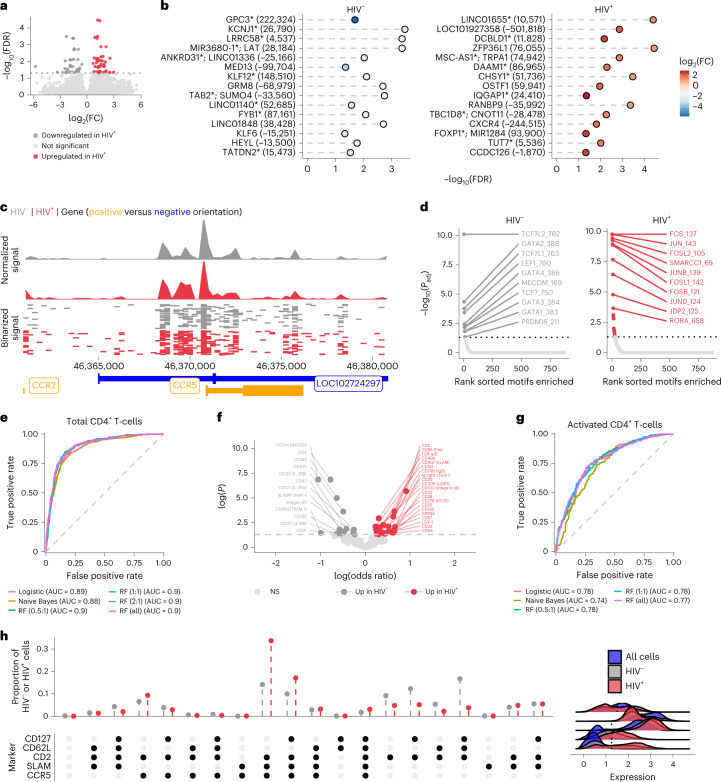
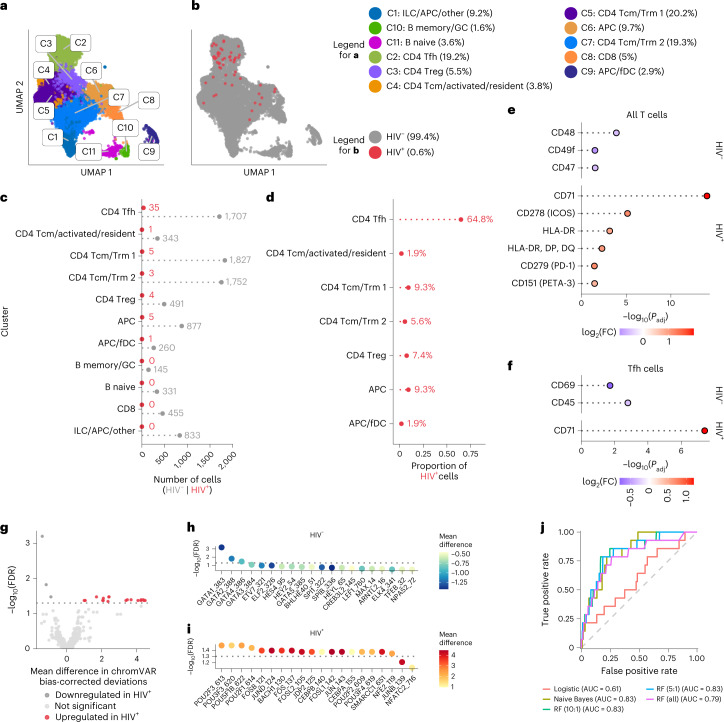
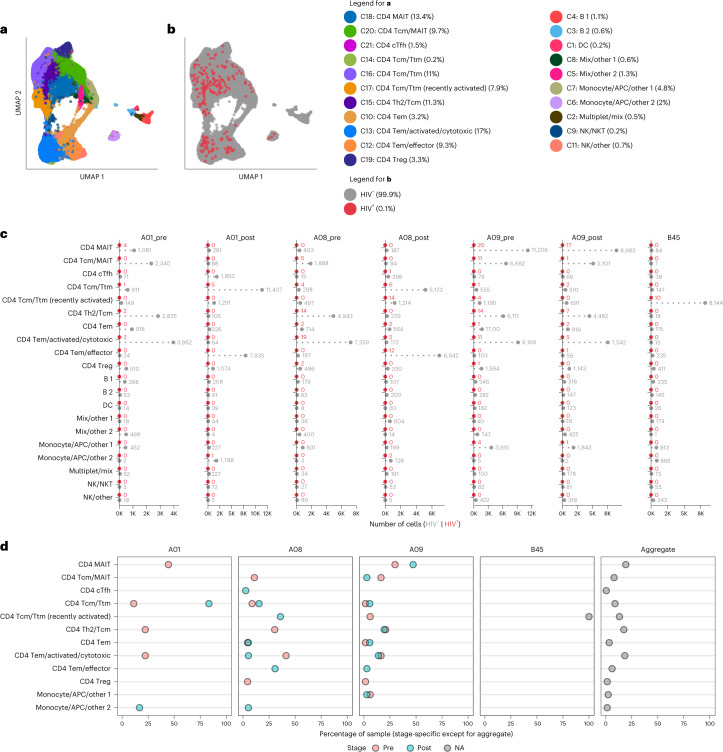
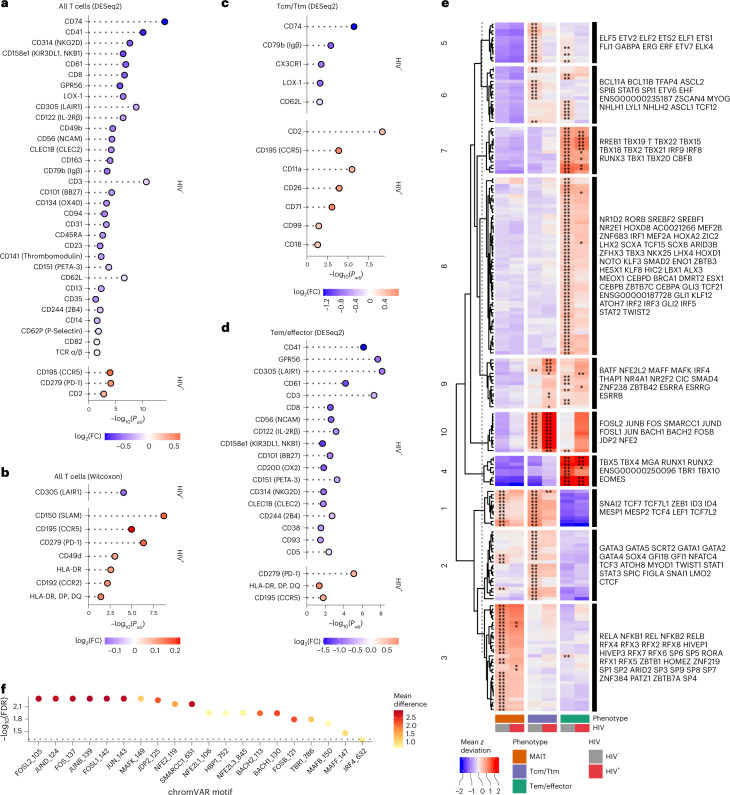
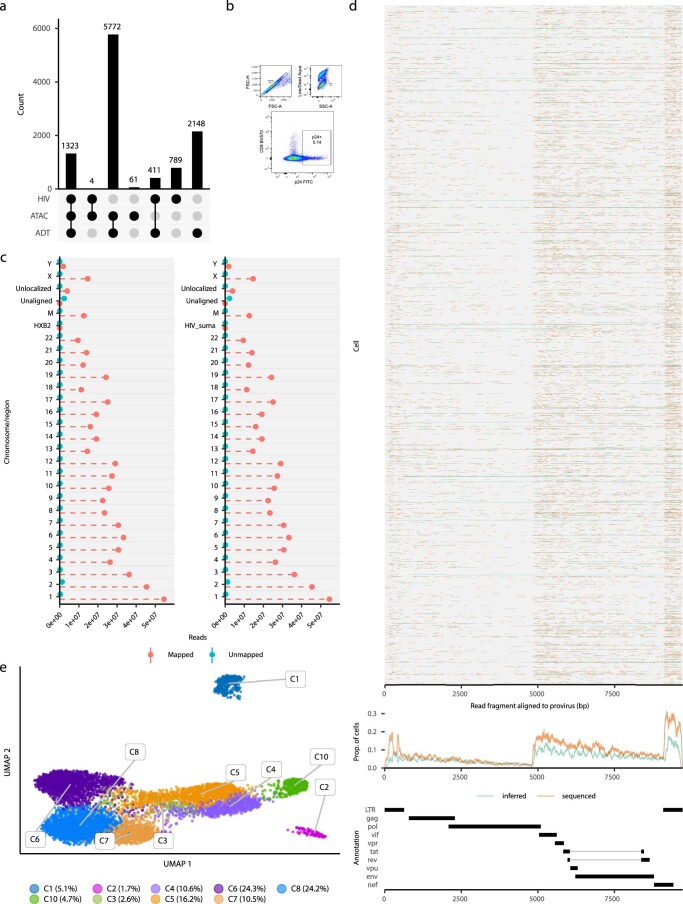
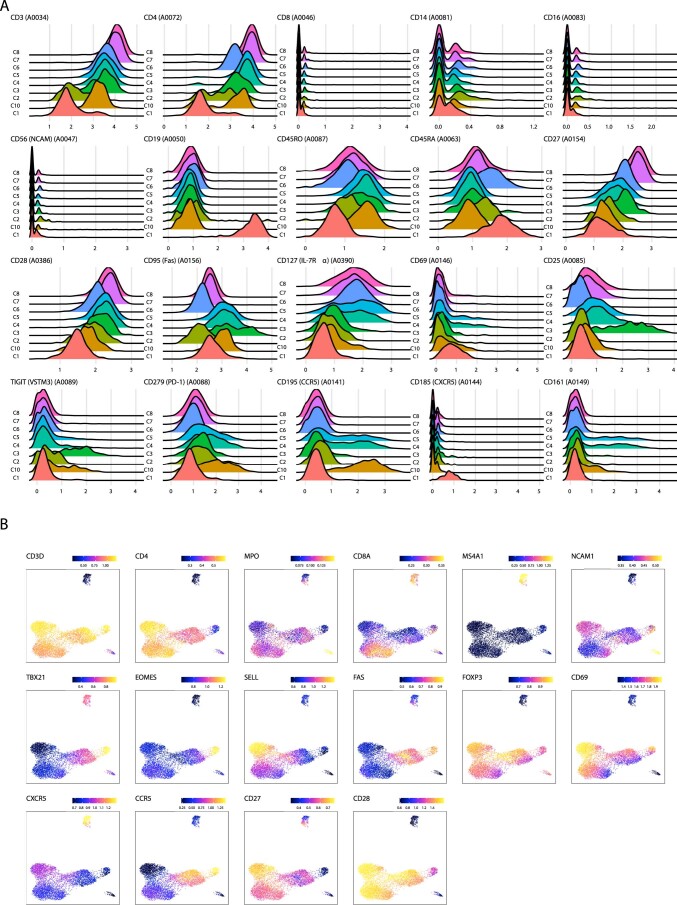
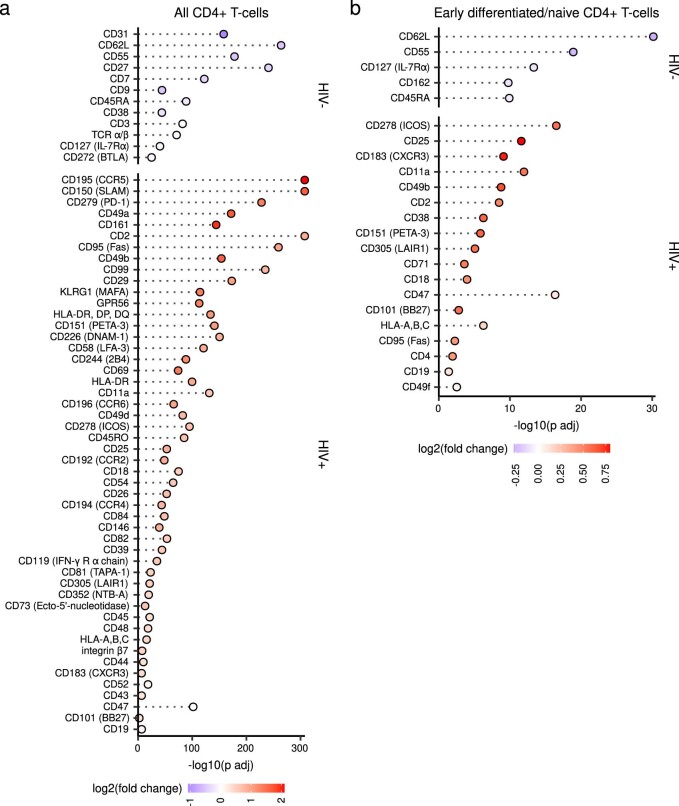
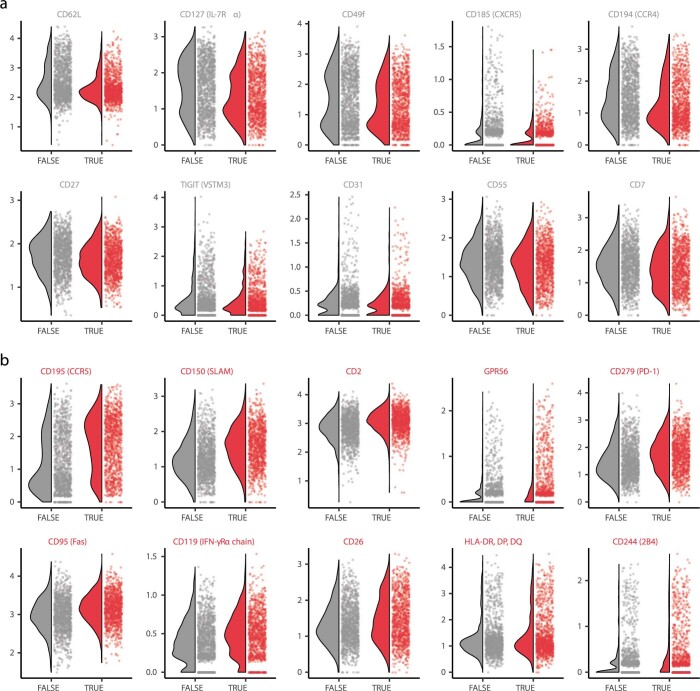
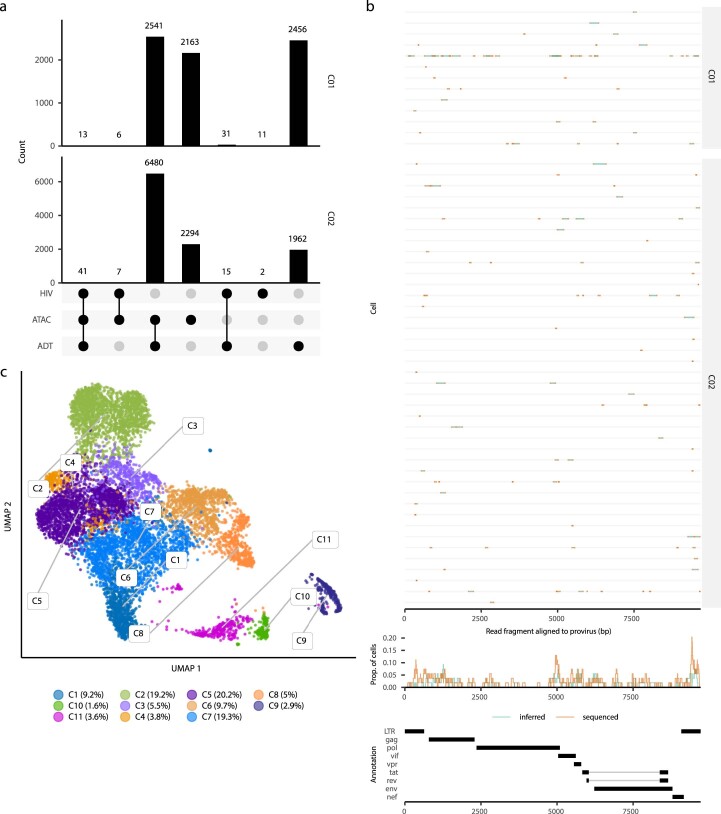
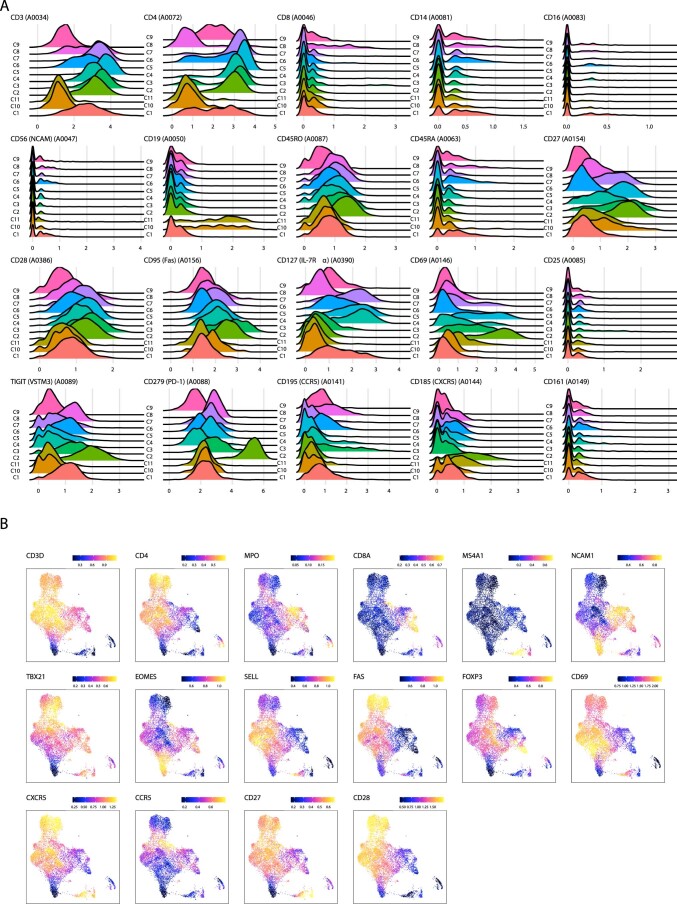
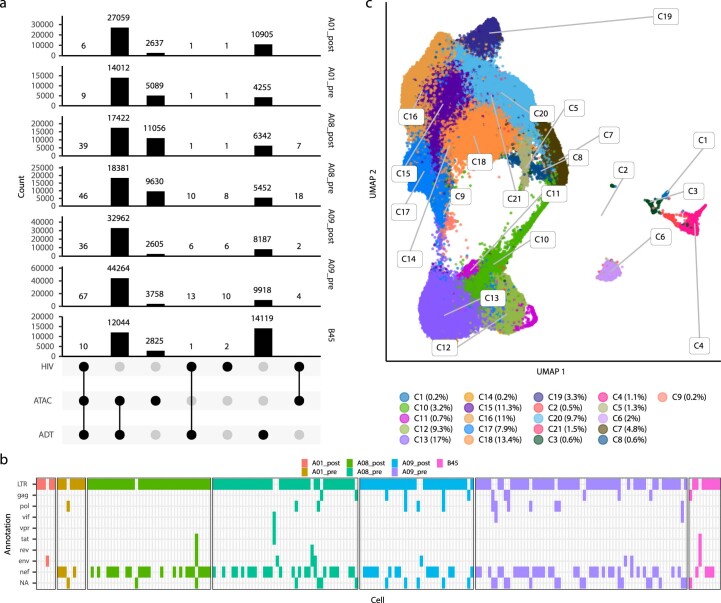
Understanding the complexity of the long-lived HIV reservoir during antiretroviral therapy (ART) remains a considerable impediment in research towards a cure for HIV. To address this, we developed a single-cell strategy to precisely define the unperturbed peripheral blood HIV-infected memory CD4+ T cell reservoir from ART-treated people living with HIV (ART-PLWH) via the presence of integrated accessible proviral DNA in concert with epigenetic and cell surface protein profiling. We identified profound reservoir heterogeneity within and between ART-PLWH, characterized by new and known surface markers within total and individual memory CD4+ T cell subsets. We further uncovered new epigenetic profiles and transcription factor motifs enriched in HIV-infected cells that suggest infected cells with accessible provirus, irrespective of reservoir distribution, are poised for reactivation during ART treatment. Together, our findings reveal the extensive inter- and intrapersonal cellular heterogeneity of the HIV reservoir, and establish an initial multiomic atlas to develop targeted reservoir elimination strategies.


Conflict of interest statement

M.R.B. is a consultant for Interius BioTherapeutics. No other conflicts are reported by the authors.

Figures

Fig. 1
Fig. 1. ASAPseq identification of HIV-infected cells in vitro.
a, UMAP representation of ATAC component colored by manually annotated cell phenotypes. b, UMAP representation of ATAC component colored by detection of HIV reads. c, Absolute count of cell numbers based on annotated clusters. d, Percentage of HIV+ cells found in each annotated cluster. e, Differential expression of surface antigens was assessed (DESeq2 method in Seurat; two-sided with multiple comparison adjustment using the Bonferroni–Hochberg method) between activated HIV+ cells (n = 1,040) and activated HIV cells (n = 1,194). Positive fold change (FC) values indicate higher expression in HIV+ cells, whereas negative FC values indicate higher expression in HIV cells. Activated cells are defined as the combination of CD4 activated/effector, CD4 activated 1, and CD4 activated 2 clusters. Markers are arranged from top to bottom by π-score, which is defined as (–log10(FDR) × log2(FC)). All markers shown have an adjusted P value (Padj) <0.05.
Fig. 2
Fig. 2. Differential chromatin accessibility in HIV-infected cells and surface marker based supervised machine learning in vitro.
a, Volcano plot showing differentially accessible peaks between activated HIV+ (n = 1,040) versus activated HIV (n = 1,194) cells. b, Top 15 significant peaks in activated HIV versus activated HIV+ cells from a. Peaks are ranked by π-score (–log10(FDR) × log2(FC)); y axis labels denote nearest TSS and/or whether the peak is in a gene (marked by an asterisk) and numbers in parentheses indicate distance to the nearest TSS. Negative numbers indicate that the nearest TSS is upstream of the peak. c, Top, Aggregated and normalized ATAC signal between activated HIV and activated HIV+ cells at the CCR5 locus. Middle, Binarized ATAC signal at a single-cell resolution (showing random 750 cells for each group). Bottom, Gene map for the genomic region shown: chr3:46360853–46380854 (centered on CCR5). d, Significant motif enrichments found in the differential peaks (ordered by significance) are shown in activated HIV cells or activated HIV+ cells (two-sided Wilcoxon rank sum test with multiple comparison correction using Benjamini–Hochberg method in getMarkerFeatures function of ArchR). e, AUC plots for multiple supervised machine learning models for all CD4+ T cells. Ratios for different RF models indicate the number of HIV cells used for each HIV+ cell (that is, 5:1 ratio meant that the HIV- cells in the training dataset were randomly downsampled to get only five times the number of HIV+ cells in the training dataset). f, Significant (two-sided z test) coefficients for the logistic regression model shown in e. Positive odds ratio indicates a marker has more weight for HIV+ cells while negative odds ratio indicates a marker has more weight for HIV cells. NS, nonsignificant. g, AUC plots for multiple supervised machine learning models for activated CD4+ T cells. h, Proportion of HIV and HIV+ activated CD4+ T cells with different surface marker combinations. Bottom dot plot indicates the combination of positive markers, which was determined by the thresholds indicated with the dotted line on the ridge plots. These ridge plots display the expression distribution of activated HIV+ CD4+ T cells, activated HIV CD4+ T cells and total cells in the in vitro dataset to help with gating.
Fig. 3
Fig. 3. ASAPseq identification of HIV-infected cells predominantly in Tfh cells from lymph nodes of untreated PLWH.
a, UMAP representation of ATAC component colored by manually annotated cell phenotypes. b, UMAP representation of ATAC component colored by detection of HIV reads. fDC, follicular dendritic cells. c, Absolute count of cell numbers based on annotated clusters. d, Percentage of HIV+ cells found in each annotated cluster. e, Differential expression of surface antigens was assessed (DESeq2 method in Seurat; two-sided with multiple comparison adjustment using Bonferroni–Hochberg method) between HIV+ CD4+ T cells versus HIV CD4 + T cells. f, Same as in e but for HIV+ Tfh cells versus HIV Tfh cells. Markers are ranked in ef by π-score (see Fig. 1e legend). All markers shown have a Padj value < 0.05. g, Comparison of motifs associated with accessible chromatin regions of HIV+ CD4+ T cells versus HIV CD4+ T cells. The volcano plot displays the differentially enriched motifs from chromVAR and ArchR, with a threshold of FDR <0.05 indicating statistical significance. Mean difference values greater than zero indicate an enrichment in HIV+ cells, while negative mean difference values indicate enrichment in HIV cells. h,i, The top 20 motifs (ordered by FDR) are shown for CD4+ HIV T cells (h) and CD4+ HIV+ T cells (i). j, AUC plots for various supervised machine learning methods. Numbering format for RF models is explained in Fig. 2.
Fig. 4
Fig. 4. ASAPseq identification of heterogeneous HIV-infected cells from peripheral blood of ART-suppressed PLWH.
a, UMAP representation of ATAC component colored by manually annotated cell phenotypes. b, UMAP representation of ATAC component colored by detection of HIV reads. c, Absolute count of cell numbers based on annotated clusters. d, Percentage of HIV+ cells found by cluster separated by donor and whether the sample was collected before or after ATI or not applicable (B45 only); x axis represents the percent of HIV+ cells in each specific sample that were found in each annotated cluster. The right panel indicates the aggregate values across the entire ART-treated dataset.
Fig. 5
Fig. 5. High degree of heterogeneity in HIV-infected cells from peripheral blood of ART-suppressed PLWH.
a, Differential expression of surface antigens was assessed between all HIV+ CD4+ T cells (n = 205) versus HIV CD4+ T cells (n = 146,016). Test performed using the DESeq2 pseudobulk method in Seurat (two-tailed with multiple comparison adjustment using the Bonferroni–Hochberg method). b, Same comparison and cells as in a but using the Wilcoxon statistical test in Seurat (two-sided with multiple comparison adjustment using the Bonferroni method). c, Differential expression of surface antigens was assessed between Tcm/Ttm HIV+ (n = 57) versus Tcm/Ttm HIV cells (n = 39,954) using the DESeq2 method in Seurat (two-tailed with multiple comparison adjustment using the Bonferroni–Hochberg method). Tcm/Ttm cells are defined by the combination of all clusters containing the terms ‘Tcm’ or ‘Ttm’ or ‘cTfh’ (but not MAIT or recently activated Tcm/Ttm cells) in Fig. 4a. d, Differential expression of surface antigens was assessed between Tem/effector HIV+ (n = 59) versus Tem/effector HIV (n = 48,928) cells using the DESeq2 method in Seurat (two-tailed with multiple comparison adjustment using the Bonferroni–Hochberg method). Tem cells are defined by the combination of all clusters containing the term ‘Tem’ in Fig. 4a. Markers in ad are ranked by π-score (see Fig. 1e legend). All markers shown have an adjusted P value < 0.05. e, Comparison of motifs associated with accessible chromatin regions of cells grouped by phenotype (MAIT (n = 58 for HIV+; n  =  38,405 for HIV), Tcm/Ttm (n = 85 for HIV+; n = 53,135 for HIV; includes recently activated Tcm/Ttm cells) and Tem/effector (n = 59 for HIV+; n = 48,928 for HIV)) and infection status (HIV versus HIV+) as assessed through chromVAR and ArchR. Heatmap displays the mean chromVAR deviations (z score) of transcription factor motifs from CISBP database (displayed by row) that define each aggregate group (displayed by column). Motifs were selected by FDR < 0.05 and a mean difference > 0.5, indicating a significant accessibility of regions that contain a given transcription factor motif for cells in the cluster (indicated by asterisks) as compared with all other cells (getMarkerFeatures function in ArchR). Each cell is colored by the mean deviation (z score) where values greater than zero indicate positive enrichment of a motif. Motifs were clustered using k-means clustering and the motifs are labeled to the right of the heatmap in order from top to bottom for each cluster. Asterisks indicate that the motif was significantly enriched in the specific group (column). *P < 0.05; **P < 0.01. f, Differential chromVAR motif profiles were assessed between HIV+ Tcm/Ttm cells and HIV Tcm/Ttm cells. The top 20 most significant motifs for HIV+ cells are shown. The dotted line indicates a –log10 transformed FDR value of 0.05. Color indicates the mean difference in chromVAR deviations (value greater than zero indicates enrichment in HIV+ cells).
Extended Data Fig. 1
Extended Data Fig. 1. Properties of ASAPseq library for in vitro model.
(A) UpSet plot of unique cell barcodes that were collected from each modality (ATAC versus ADT) and whether or not the barcode was associated with proviral reads (HIV). Barcodes that passed ATAC and ADT quality checks (see Methods) were used for downstream analyses. (B) Flow cytometry plot of cell culture before conducting ASAPseq analysis. Top two plots (from left to right) indicate gating strategy. Value in the highlighted box for the bottom plot is the percent of total live singlets that are p24 + . (C) Reported mapped and unmapped read-segments by chromosome (as determined by samtools idxstats) from alignment of ASAPseq dataset of uninfected PBMC (Mimitou et al., 2021) to chimeric reference genomes with HXB2 (left) or SUMA (right). HIV genomes were added as a separate chromosome during creation of the chimeric reference genome. (D) (top) Sequenced regions that are aligned by bwa mem to the proviral genome (SUMA) and recovered by hiv-haystack. Each row is a cell and each column is a base pair spanning the proviral genome. Regions in orange indicate actual reported coverage while regions in blue indicate inferred coverage if provirus was intact as paired-end sequencing can only obtain at most 50 bp from either end of the genomic/transposed fragment if the genomic fragment is > 50 bp. Many LTR alignments can be ambiguous and it is unclear whether the actual read is in the 3’ LTR or 5’ LTR. The primary alignment from bwa-mem is recorded here. (middle) Proportion of coverage is reported across all cells spanning the entire proviral genome. (bottom) Genome map of SUMA. (E) UMAP representation of the ATAC component with numeric labeling prior to manual annotation.
Extended Data Fig. 2
Extended Data Fig. 2. Cluster annotation panels for in vitro model.
(A) Each subplot shows the ADT signal for a specific surface antigen for each cluster as seen in Extended Data Fig. 1E. X-axis values are normalized count values as processed via Seurat. (B) Each subplot shows the imputed gene activity score overlaid on the UMAP coordinate space as seen in Extended Data Fig. 1E. Gene activity score was calculated by ArchR and imputed using MAGIC to aid in visual interpretation as recommended by ArchR. Color scale indicates log2(normalized counts + 1).
Extended Data Fig. 3
Extended Data Fig. 3. Differential expression of select antigens for in vitro model.
Differential expression of surface antigens was assessed (DESeq2 method in Seurat; two-sided with multiple comparison adjustment using Bonferroni-Hochberg method) to compare between HIV- or HIV + cells in specific cell groupings: (A) all CD4 + T-cells (n = 1279 cells for HIV + and n = 5315 cells for HIV-) and (B) early differentiated CD4 + T-cells (n = 216 cells for HIV + and n = 3958 cells for HIV-). Markers are ranked in (A-B) by π-score (see Fig. 1E legend). All markers shown have an adjusted p-value < 0.05.
Extended Data Fig. 4
Extended Data Fig. 4. Differential expression of select antigens in activated T-cells for in vitro model.
Violin-scatter plots are shown for the top 10 surface markers from Fig. 1E that are enriched in (A) activated HIV- cells and (B) activated HIV + cells. FALSE indicates HIV- cells while TRUE indicates HIV + cells. Markers are ordered from left to right; top to bottom by order of decreasing |π-score| as seen in Fig. 1E.
Extended Data Fig. 5
Extended Data Fig. 5. Properties of ASAPseq library during chronic infection.
(A) UpSet plot of unique cell barcodes that were collected from each modality (ATAC versus ADT) and detection of proviral reads (HIV) separated by individual. (B) (top) Sequenced regions that are aligned by bwa mem to the proviral genome (HXB2) and recovered by hiv-haystack. Each row is a cell and each column is a base pair spanning the proviral genome. Refer to Extended Data Fig. 1 legend for more detailed information. (C) UMAP representation of the ATAC component with numeric labeling prior to manual annotation.
Extended Data Fig. 6
Extended Data Fig. 6. Cluster annotation panels during chronic infection.
(A) Each subplot shows the ADT signal for a specific surface antigen for each cluster as seen in Extended Data Fig. 5C. X-axis values are normalized count values as processed via Seurat. (B) Each subplot shows the imputed gene activity score overlaid on the UMAP coordinate space as seen in Extended Data Fig. 5C. Gene activity score was calculated by ArchR and imputed using MAGIC to aid in visual interpretation as recommended by ArchR.
Extended Data Fig. 7
Extended Data Fig. 7. Properties of ASAPseq library during treated infection.
(A) UpSet plot of unique cell barcodes that were collected from each modality (ATAC versus ADT) and detection of proviral reads (HIV) separated by individual. (B) Sequenced regions that are aligned by bwa mem to the proviral genome (autologous + HXB2) and recovered by hiv-haystack. Each column represents an unique infected cell, separated by the individual. The annotated HIV genomic region (as determined from Gene Cutter) is displayed per infected cell. (C) UMAP representation of the ATAC component with numeric labeling prior to manual annotation.
Extended Data Fig. 8
Extended Data Fig. 8. Cluster annotation panels during treated infection.
(A) Each subplot shows the ADT signal for a specific surface antigen for each cluster as seen in Extended Data Figure 7C. X-axis values are normalized count values as processed via Seurat. (B) Each subplot shows the imputed gene activity score overlaid on the UMAP coordinate space as seen in Extended Data Figure 7C. Gene activity score was calculated by ArchR and imputed using MAGIC to aid in visual interpretation as recommended by ArchR.
Extended Data Fig. 9
Extended Data Fig. 9. Differential expression of select antigens during treated infection.
Violin-scatter plots are shown for all significantly expressed (adjusted p value < 0.05; two-sided Wilcoxon with multiple comparison adjustment using Bonferroni method) surface markers (see Fig. 5B for significance and fold change values) that are enriched in (A) all CD4 + HIV + T-cells and (B) all CD4 + HIV- T-cells. FALSE indicates HIV- cells while TRUE indicates HIV + cells. Markers are ordered from left to right; top to bottom by order of decreasing |π-score| as seen in Fig. 5B. Cells are separated by individual and the aggregate data (across individuals) is also shown.

References

    1. Chun TW, et al. In vivo fate of HIV-1-infected T cells: quantitative analysis of the transition to stable latency. Nat. Med. 1995;1:1284–1290. - PubMed
    1. Finzi D, et al. Identification of a reservoir for HIV-1 in patients on highly active antiretroviral therapy. Science. 1997;278:1295–1300. - PubMed
    1. Chun TW, et al. Quantification of latent tissue reservoirs and total body viral load in HIV-1 infection. Nature. 1997;387:183–188. - PubMed
    1. Deleage C, et al. Defining HIV and SIV reservoirs in lymphoid tissues. Pathog. Immun. 2016;1:68–106. - PMC - PubMed
    1. Estes JD, et al. Defining total-body AIDS-virus burden with implications for curative strategies. Nat. Med. 2017;23:1271–1276. - PMC - PubMed

Publication types

Substances