. 2023 Jan;24(1):186-199.
doi: 10.1038/s41590-022-01367-z. Epub 2022 Dec 19.

Adaptive immune responses to SARS-CoV-2 persist in the pharyngeal lymphoid tissue of children

Affiliations

Adaptive immune responses to SARS-CoV-2 persist in the pharyngeal lymphoid tissue of children

Qin Xu et al. Nat Immunol. 2023 Jan.

Abstract

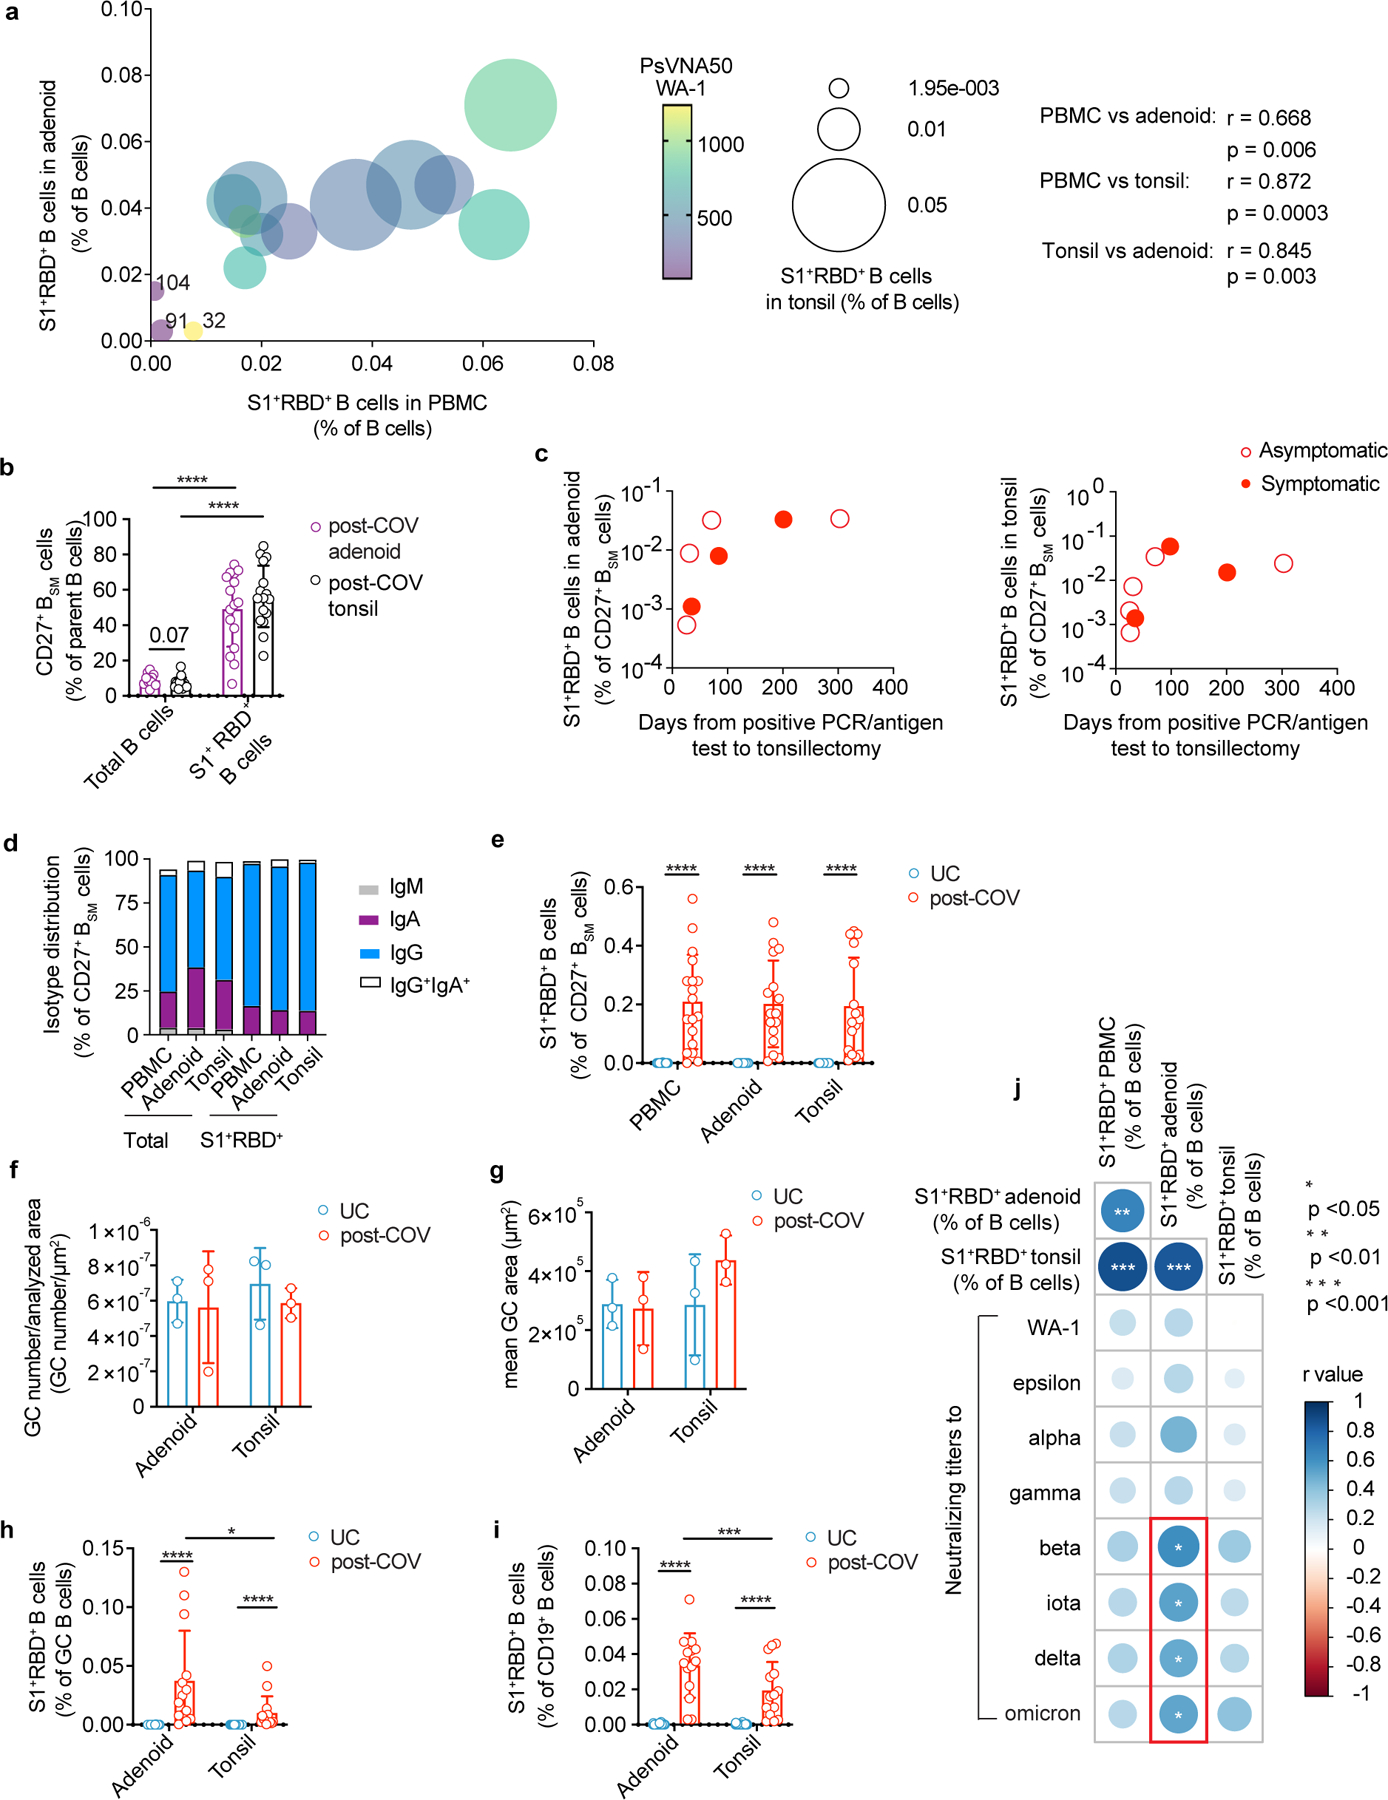
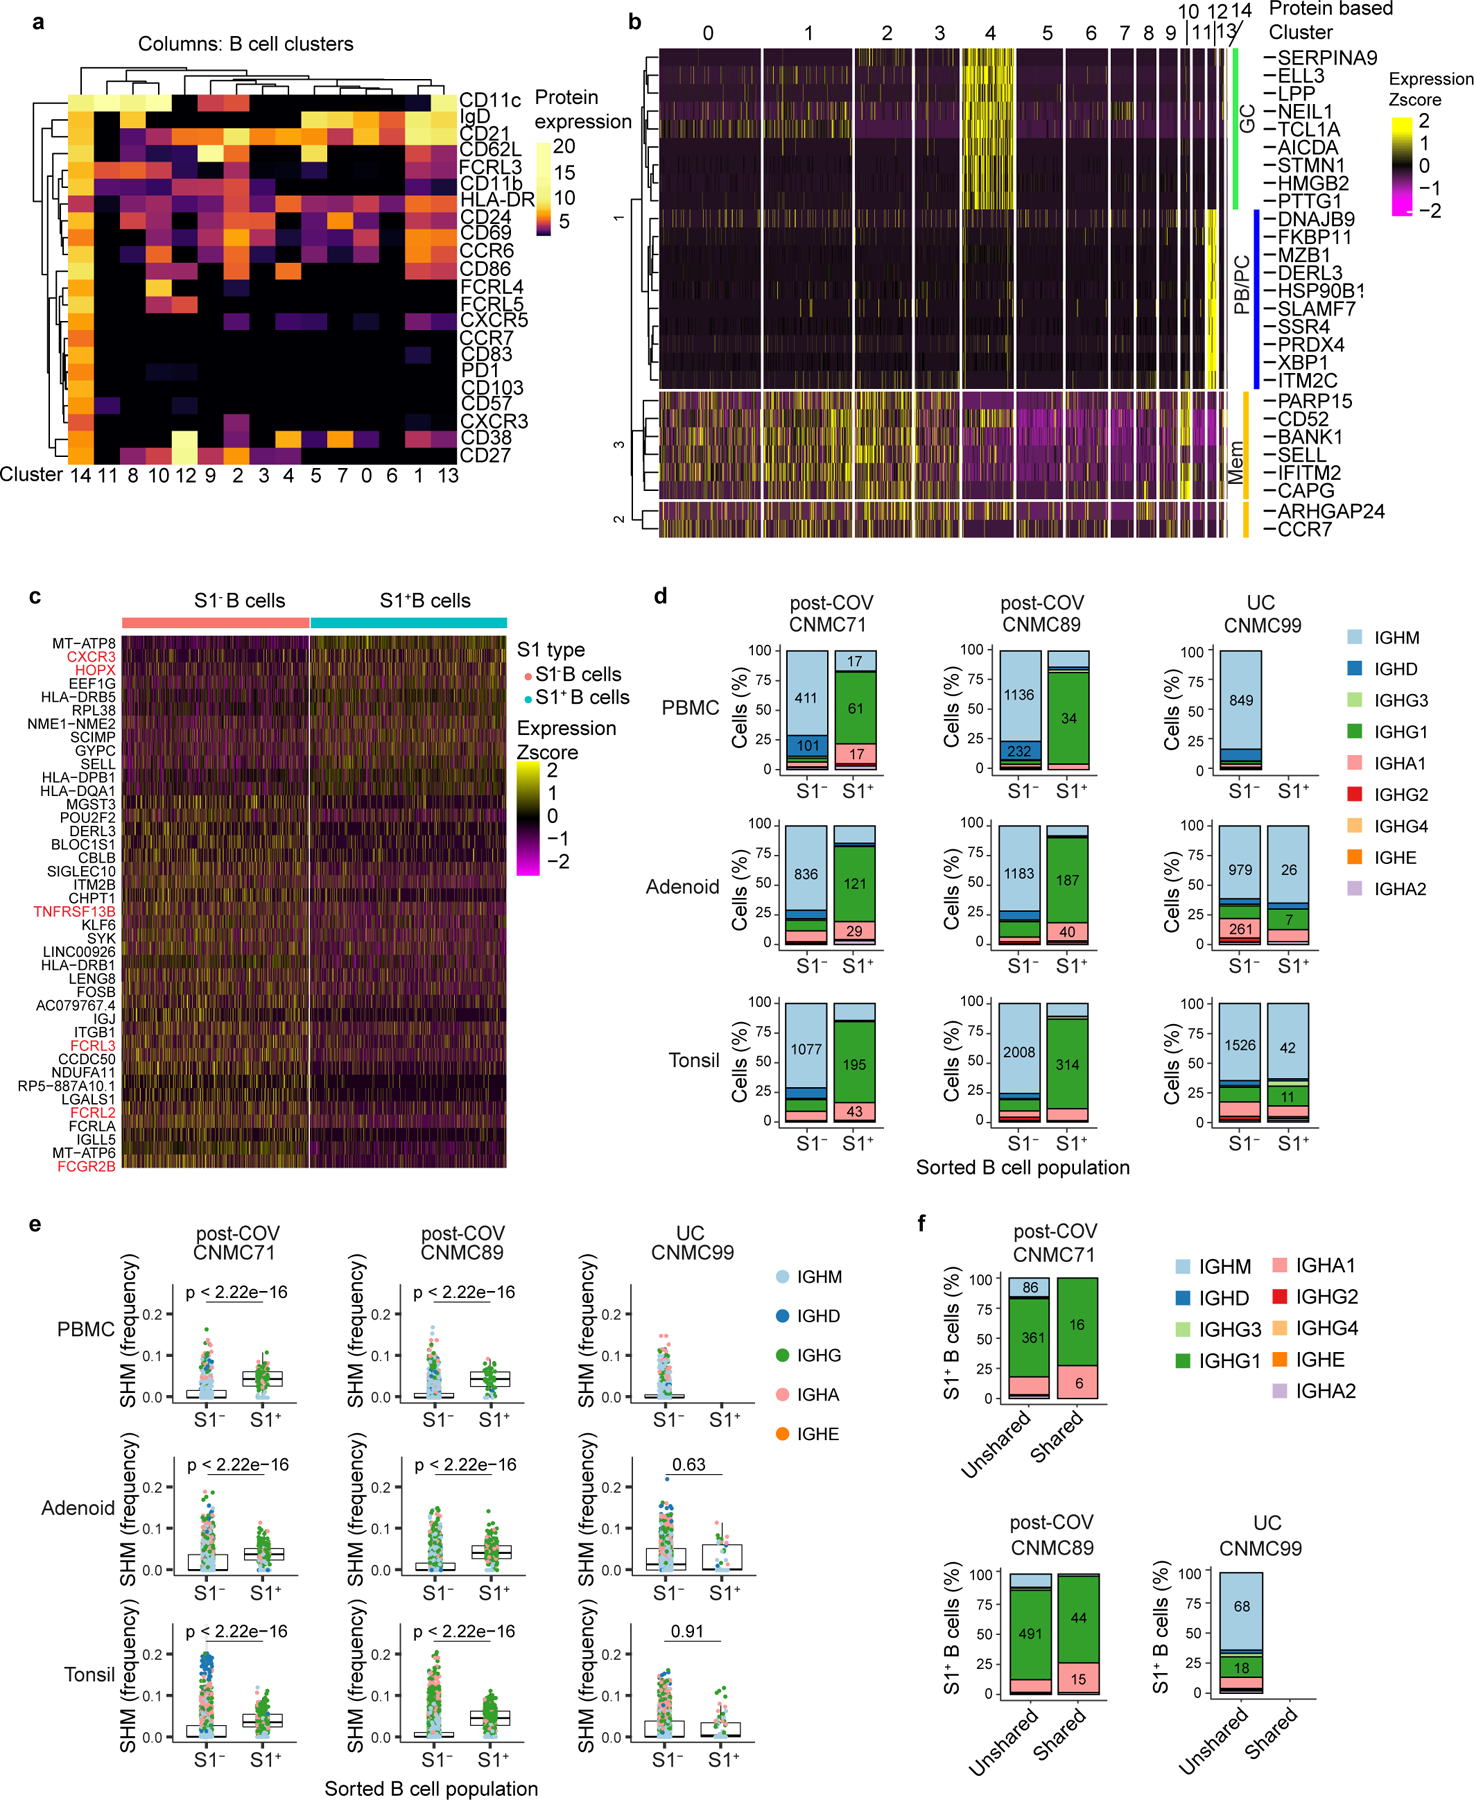
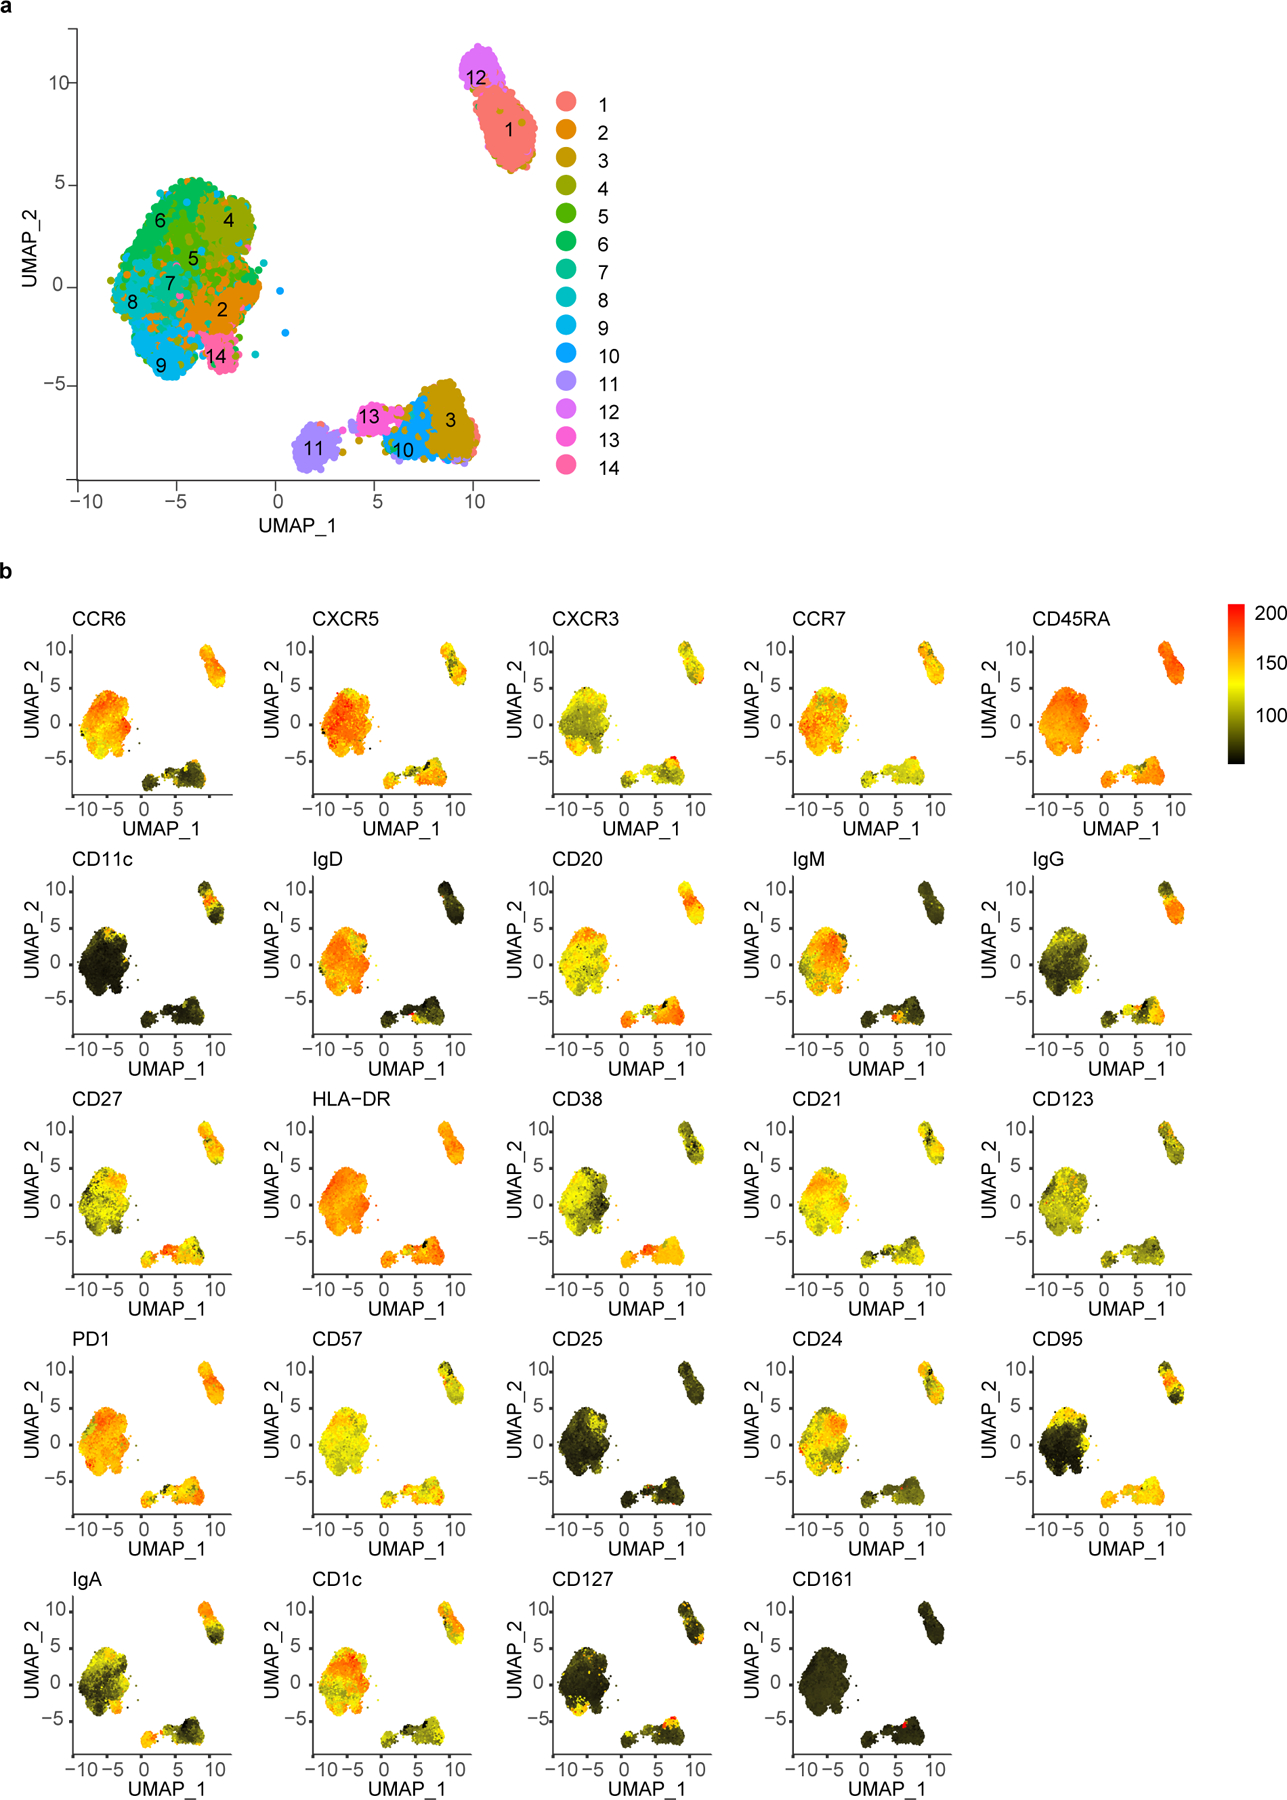
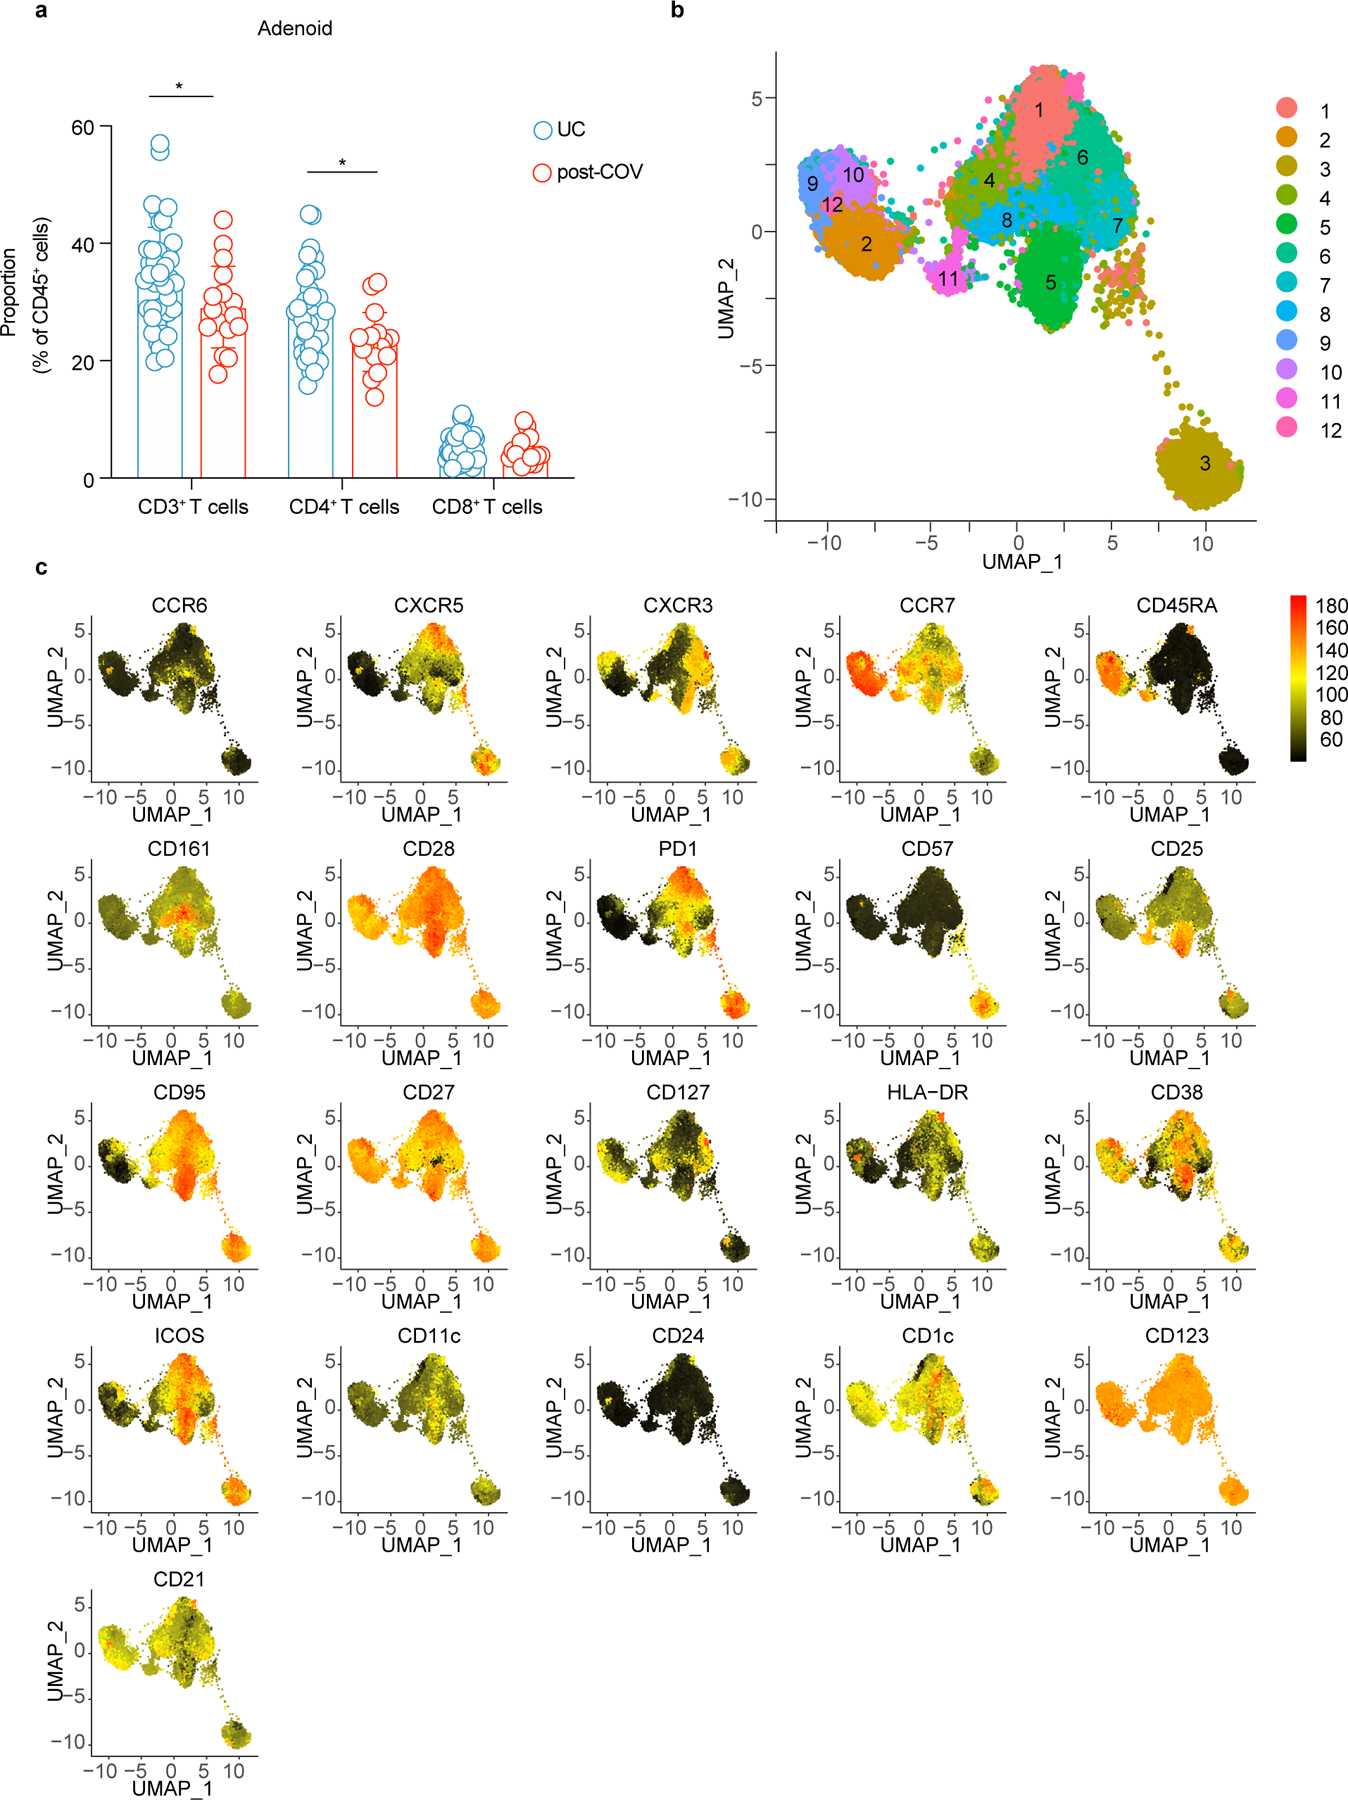
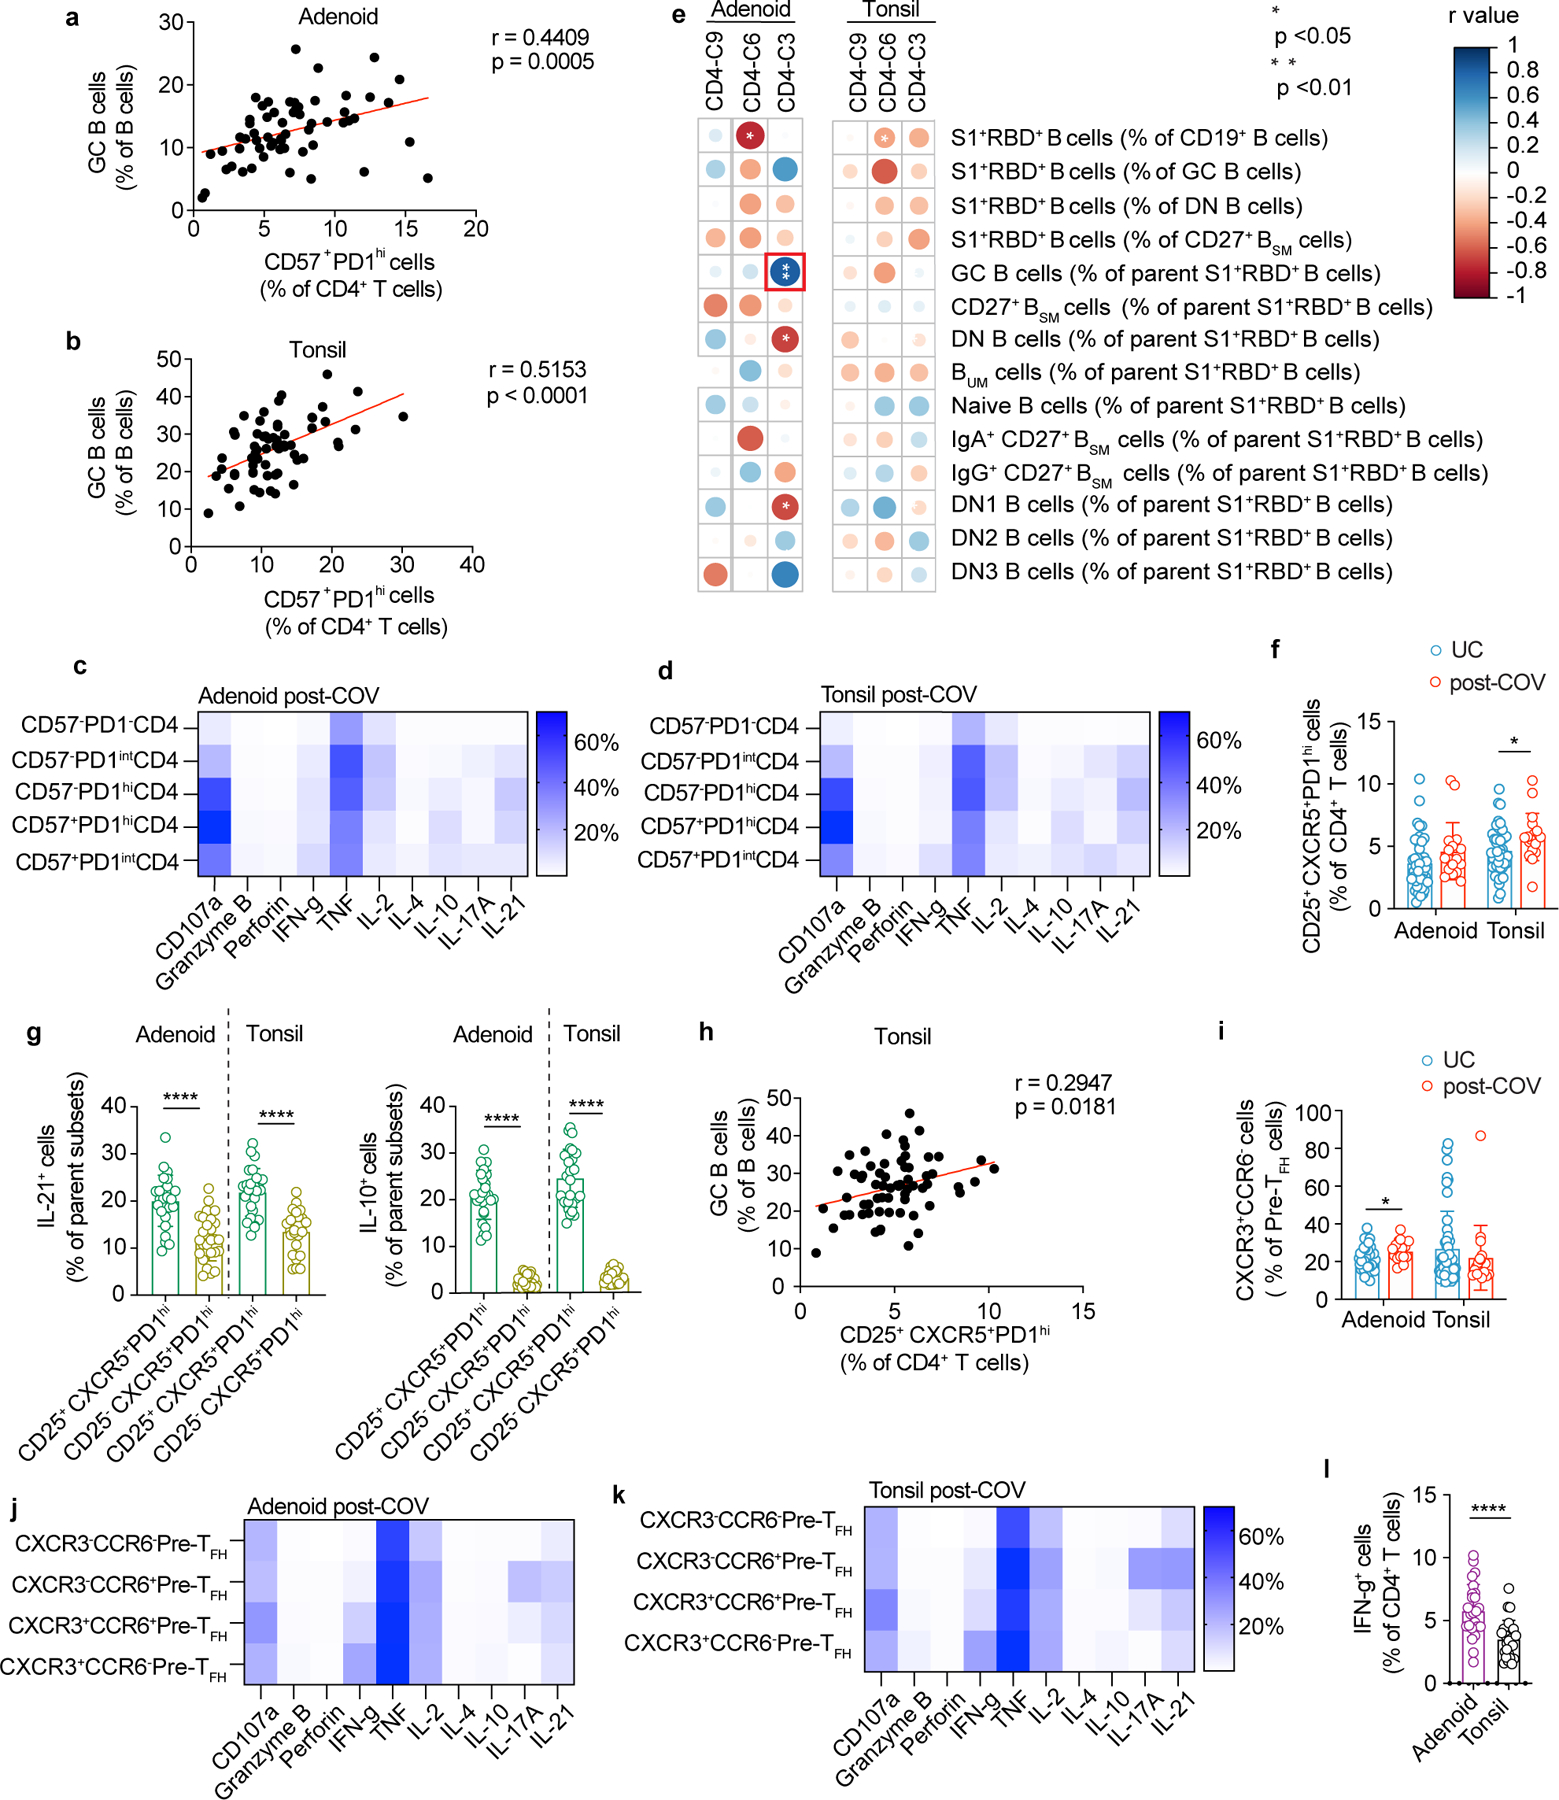
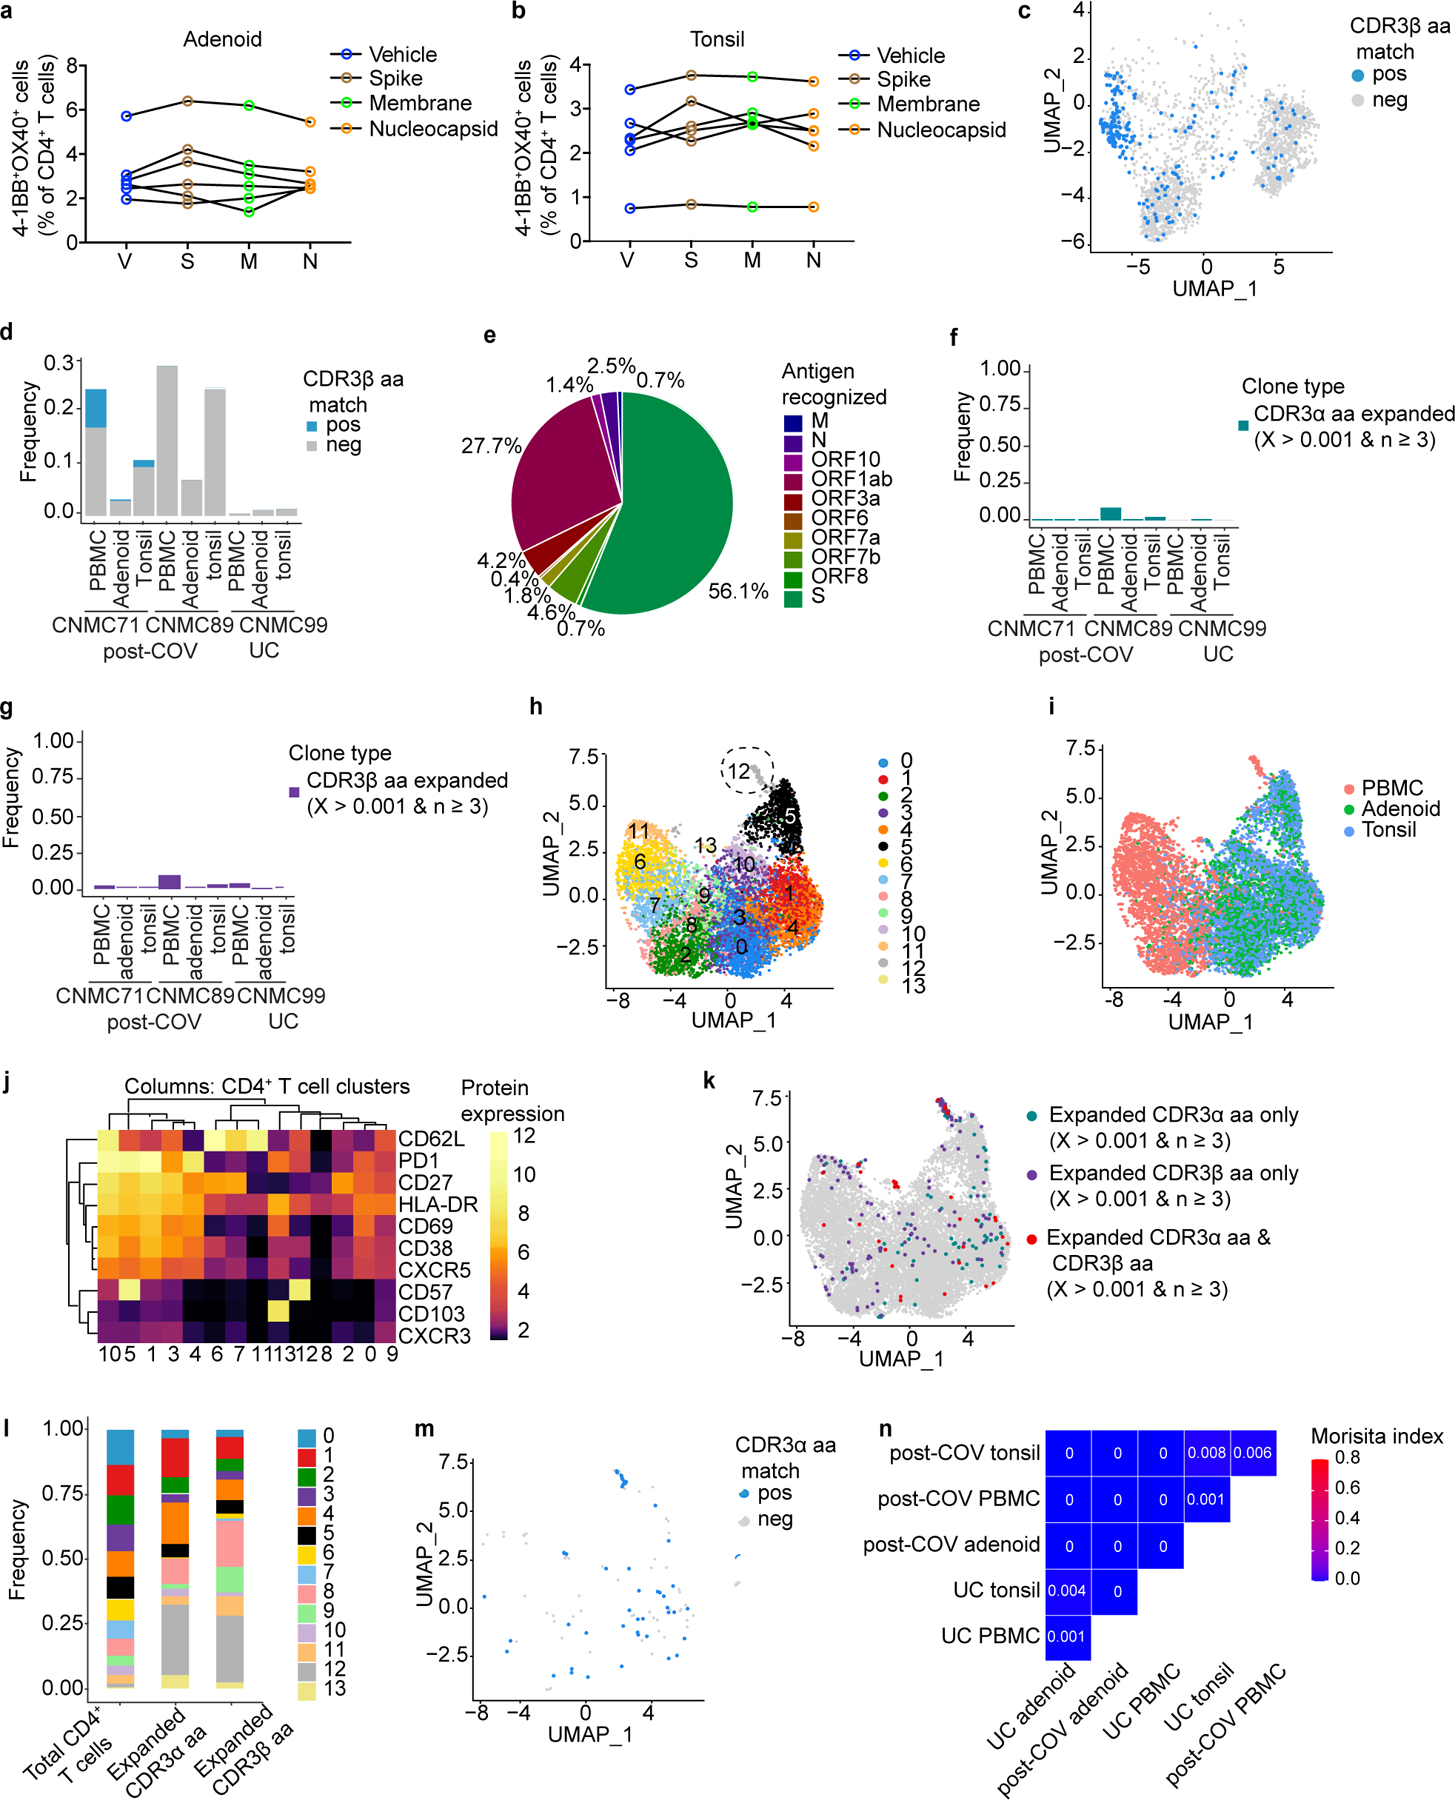
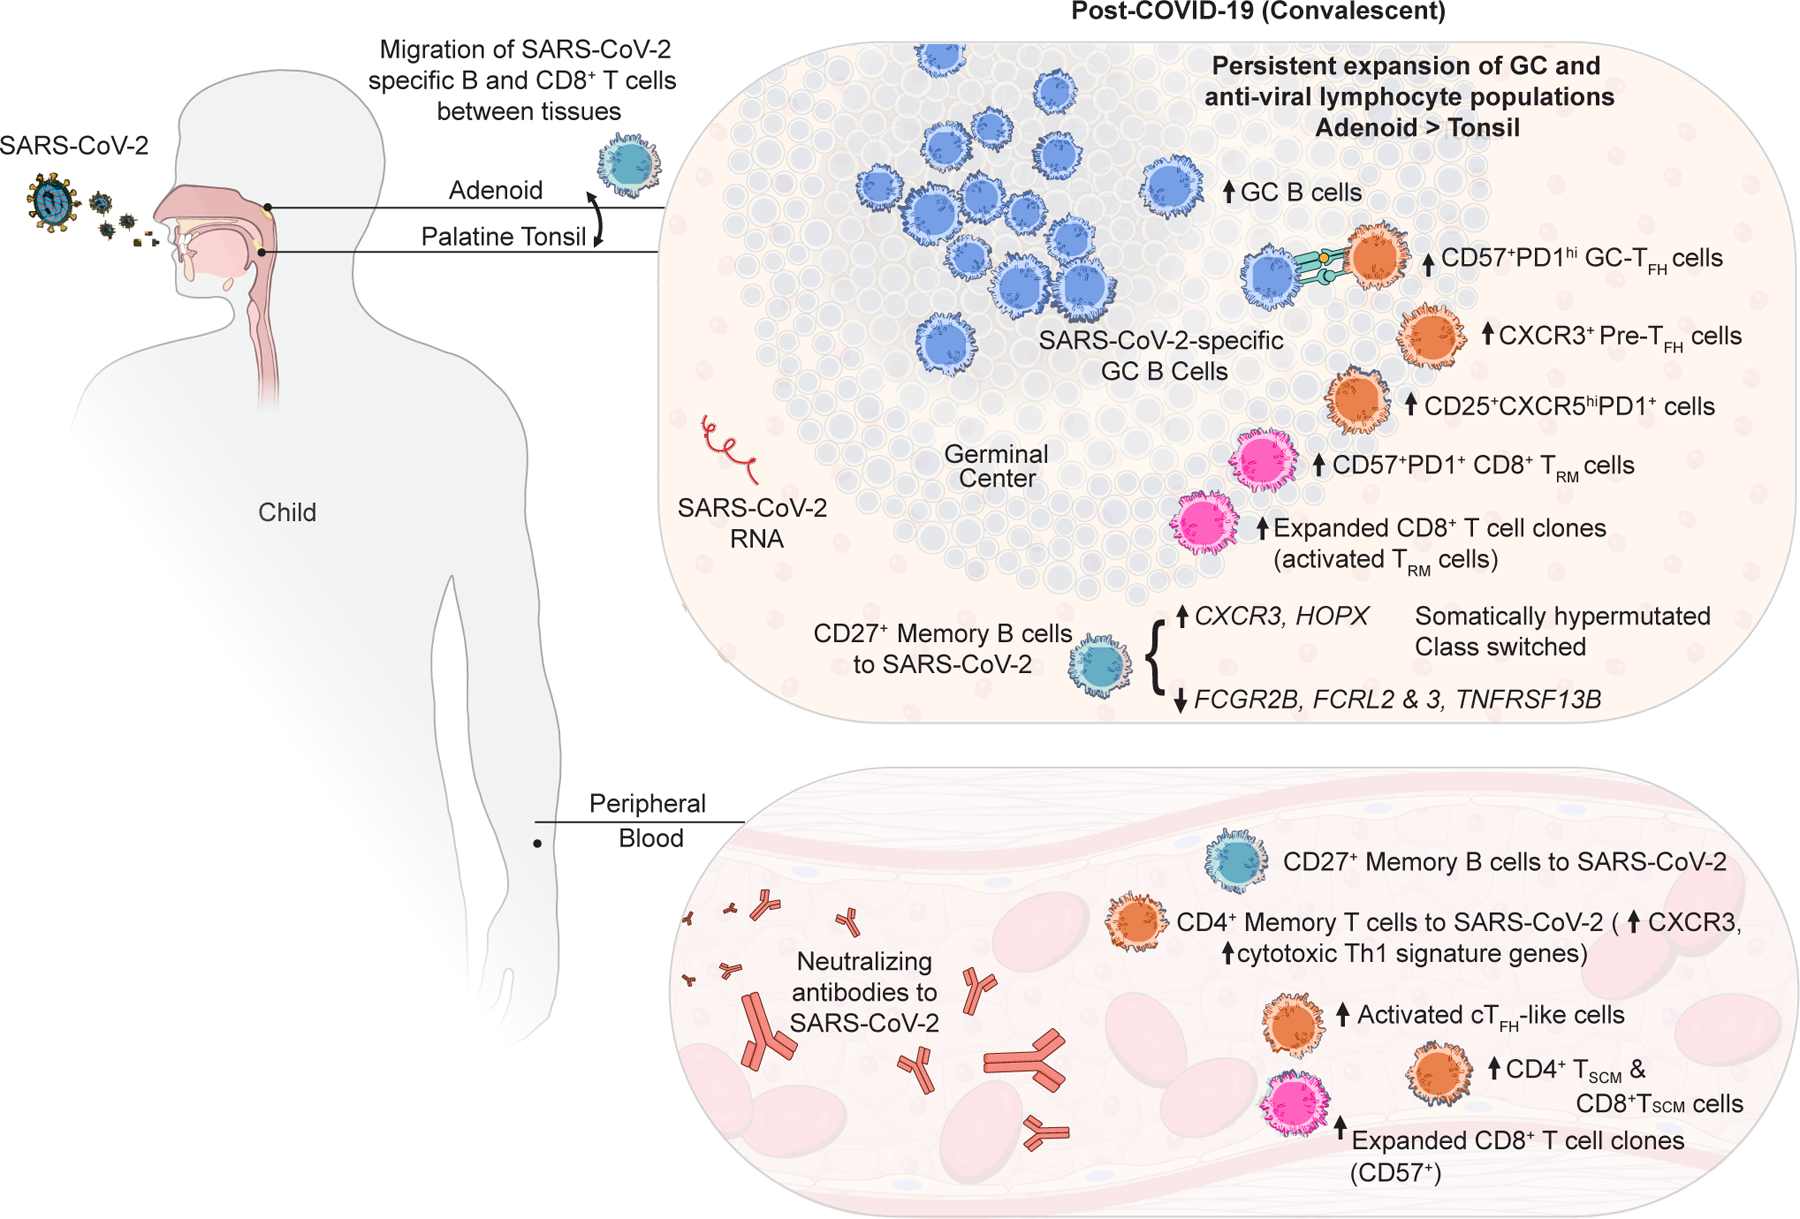
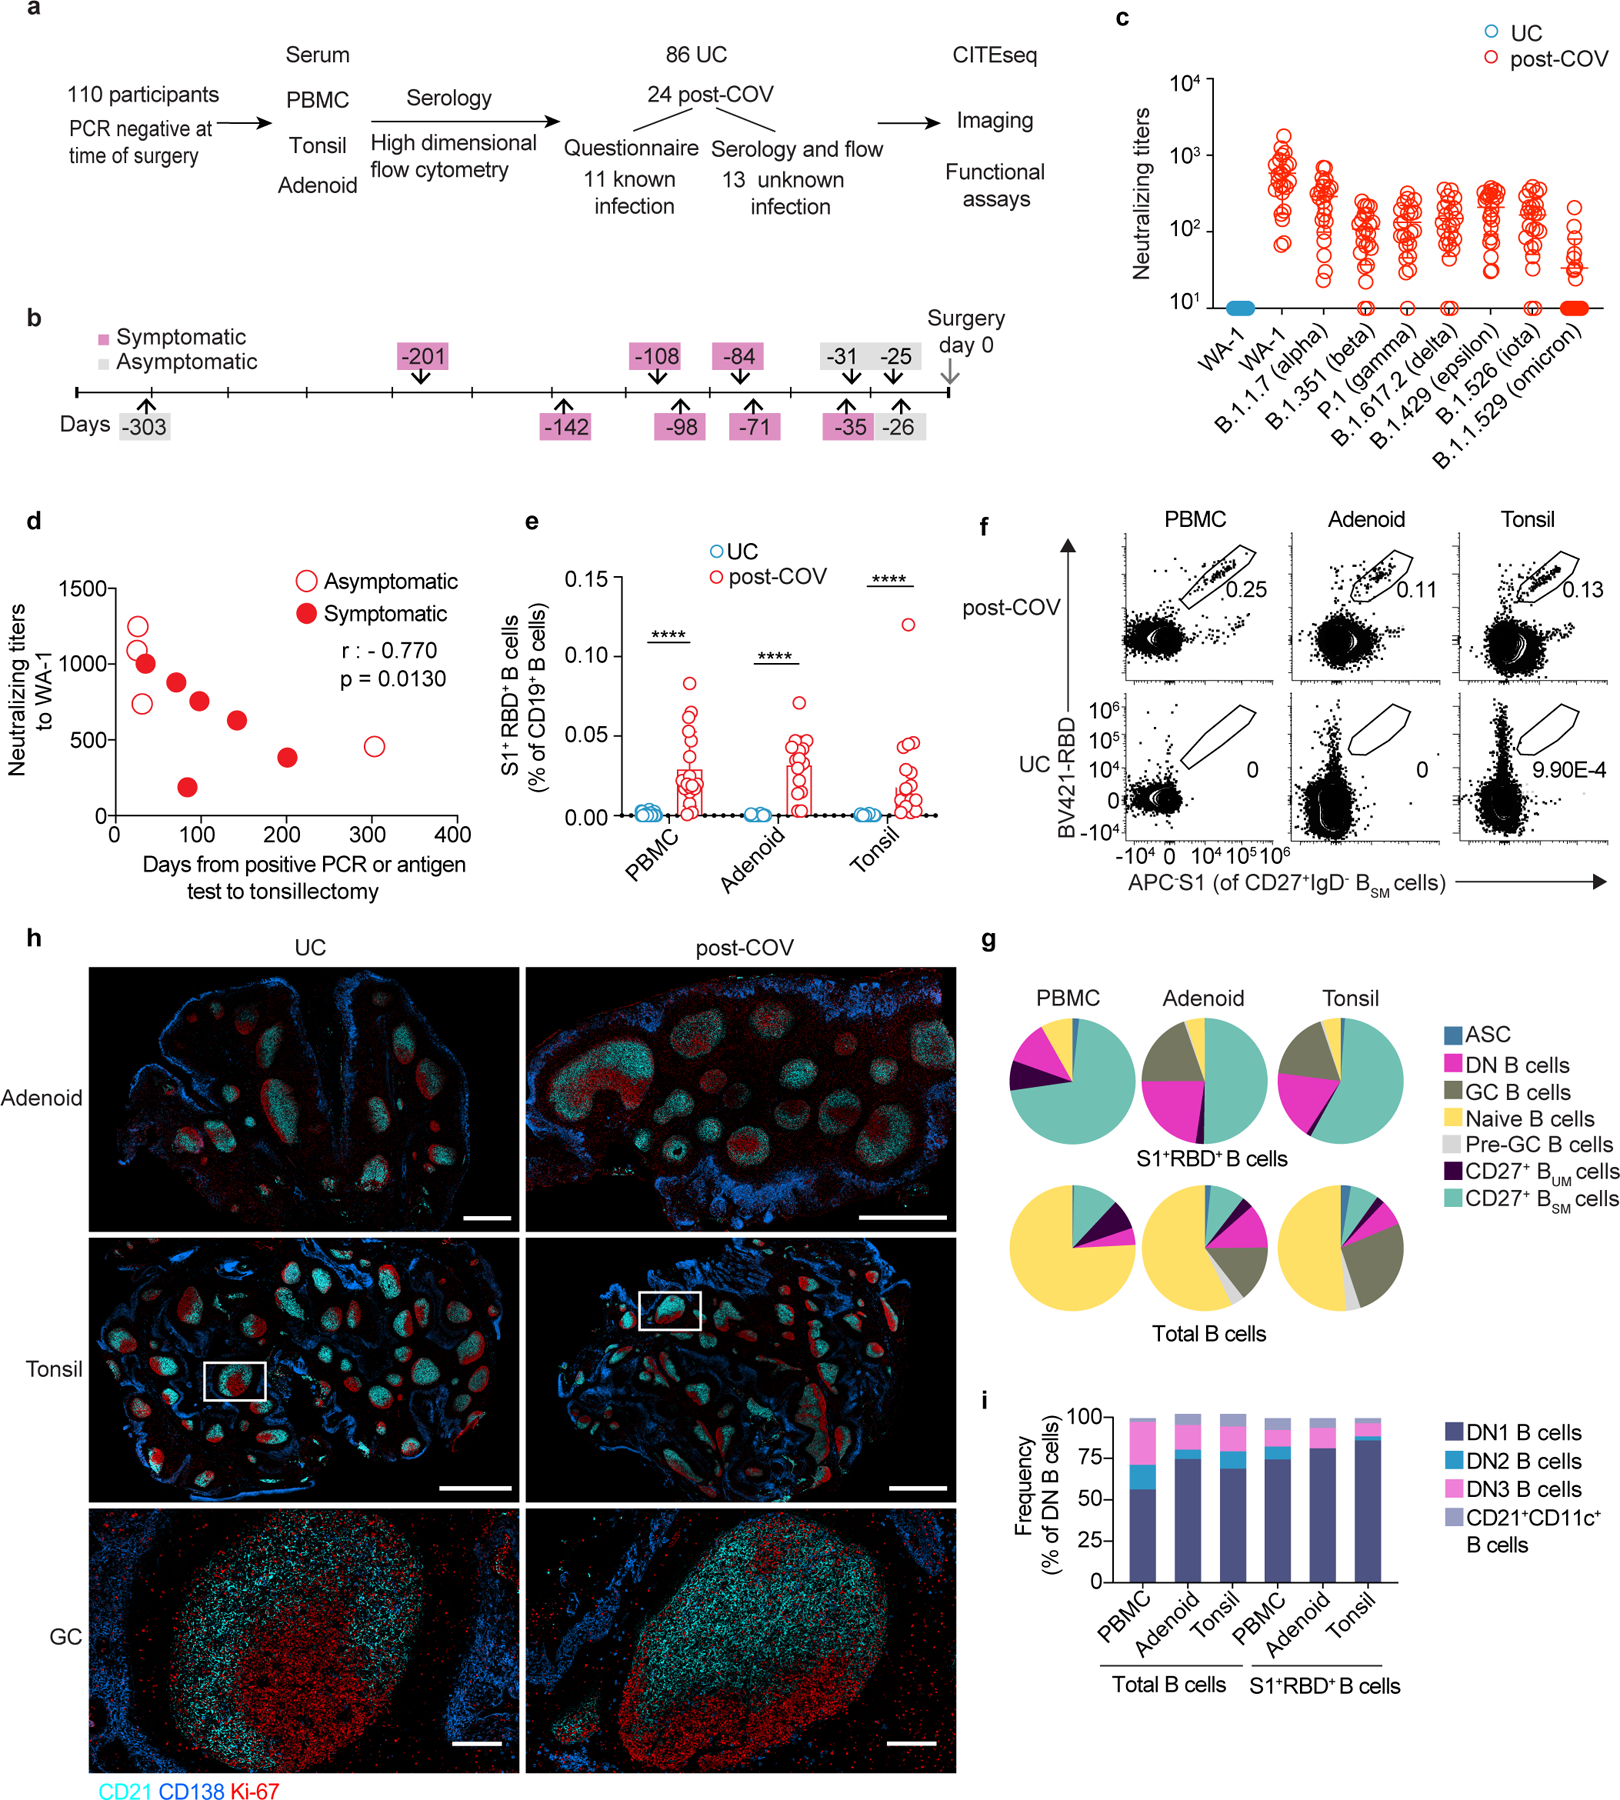
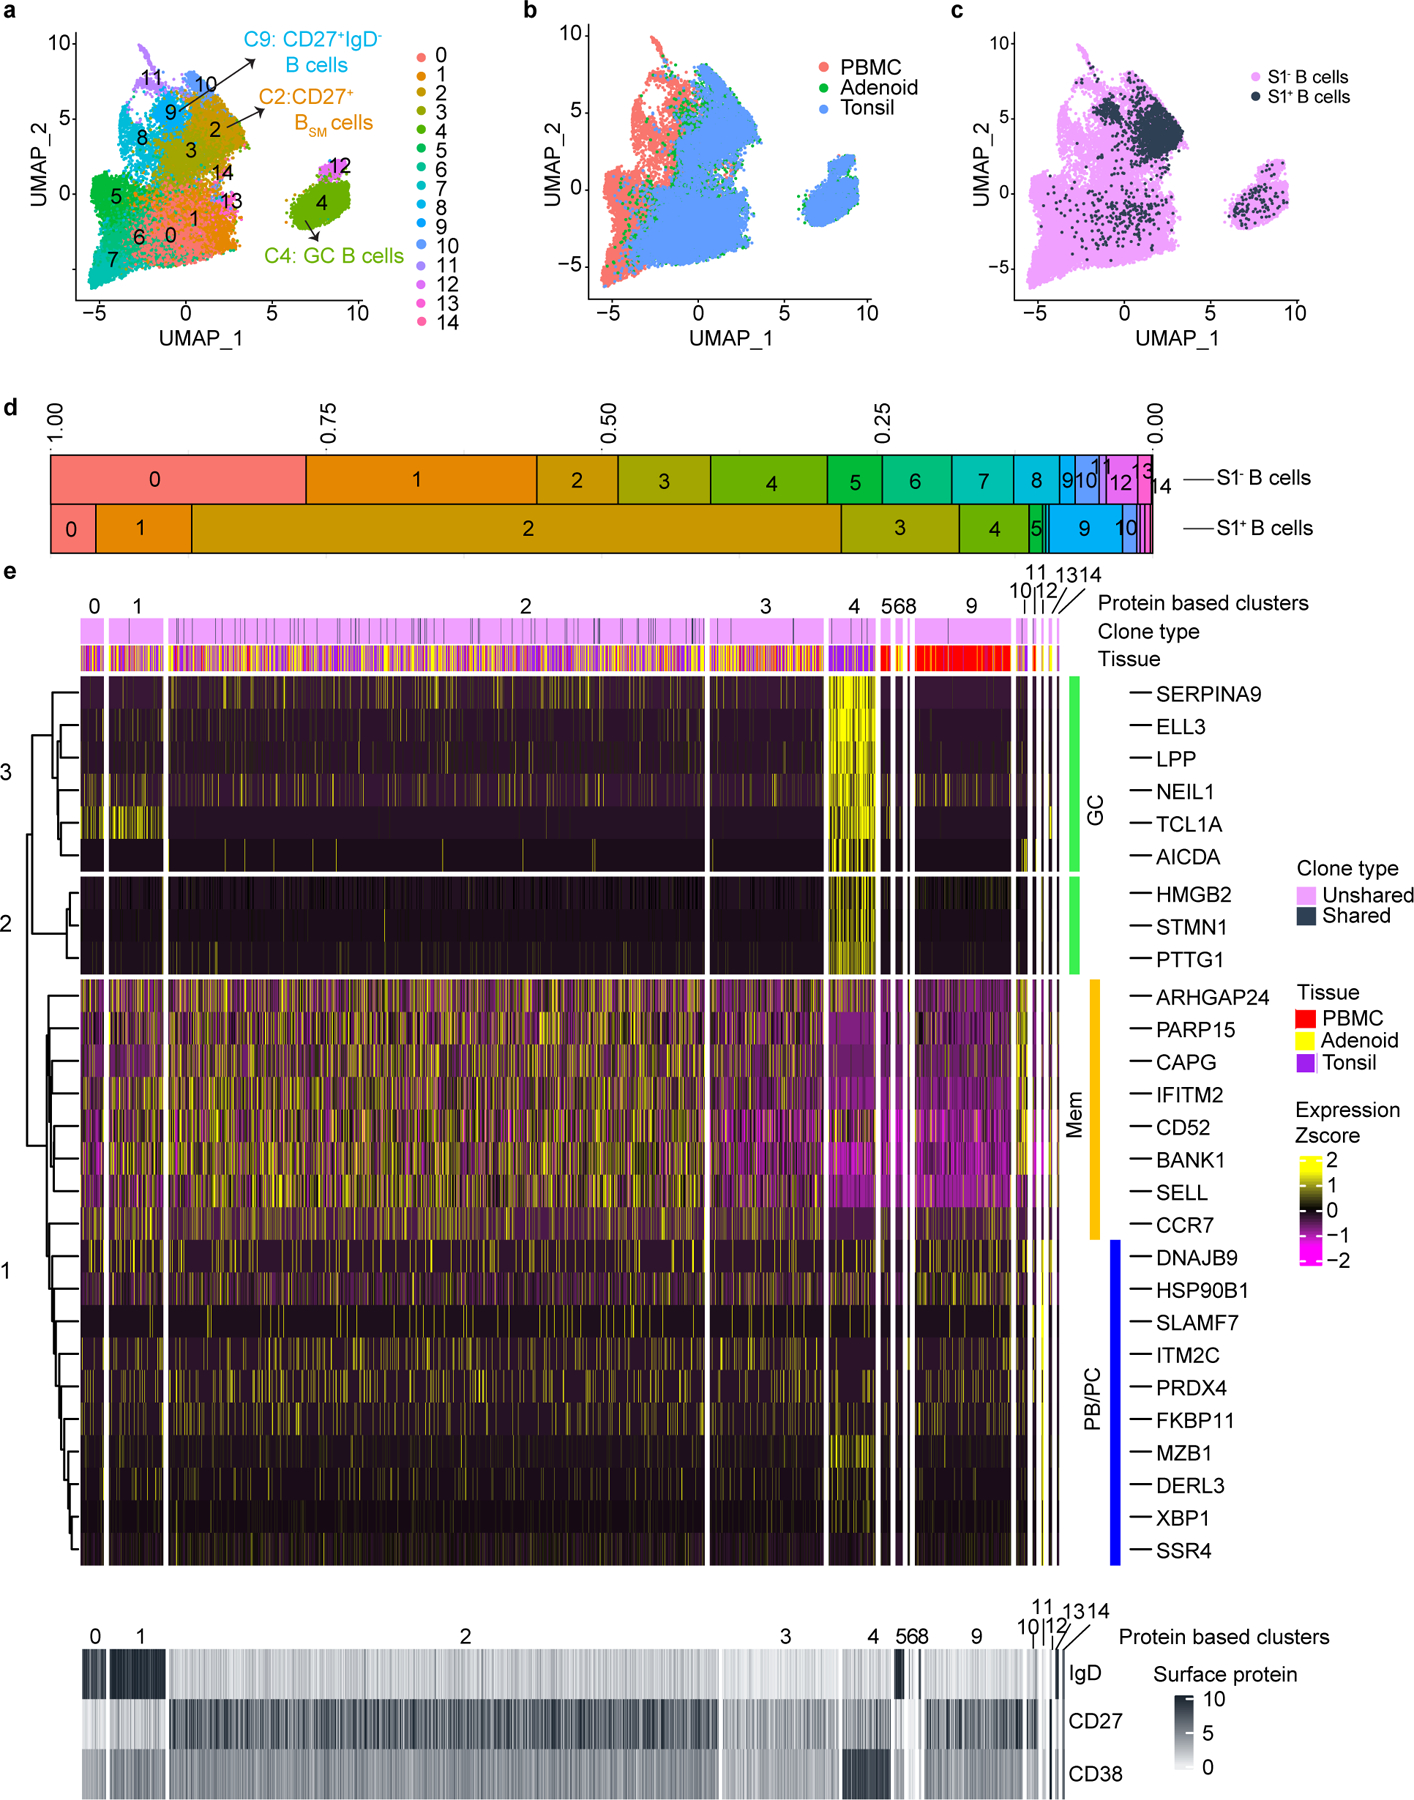
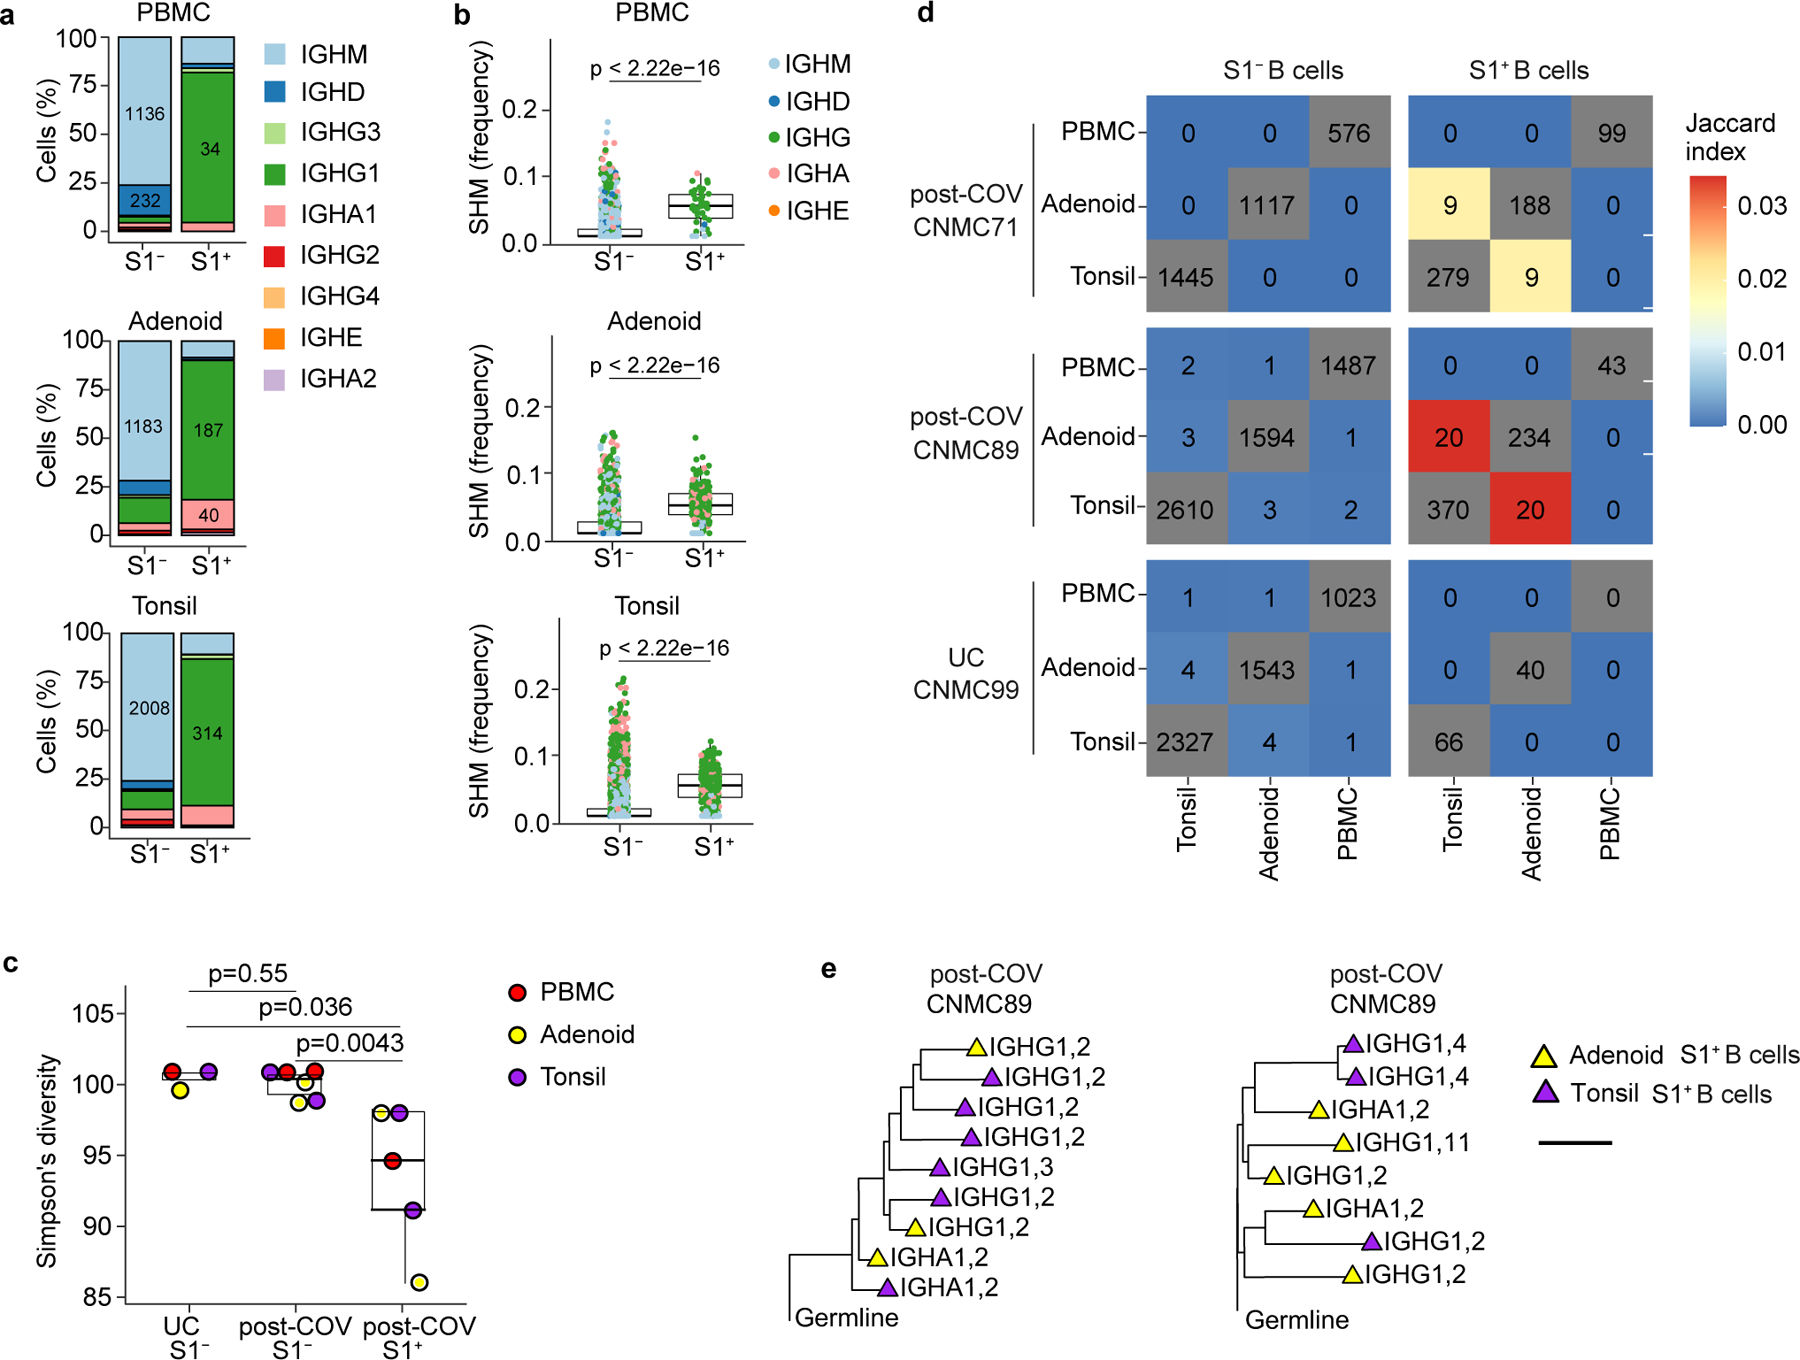
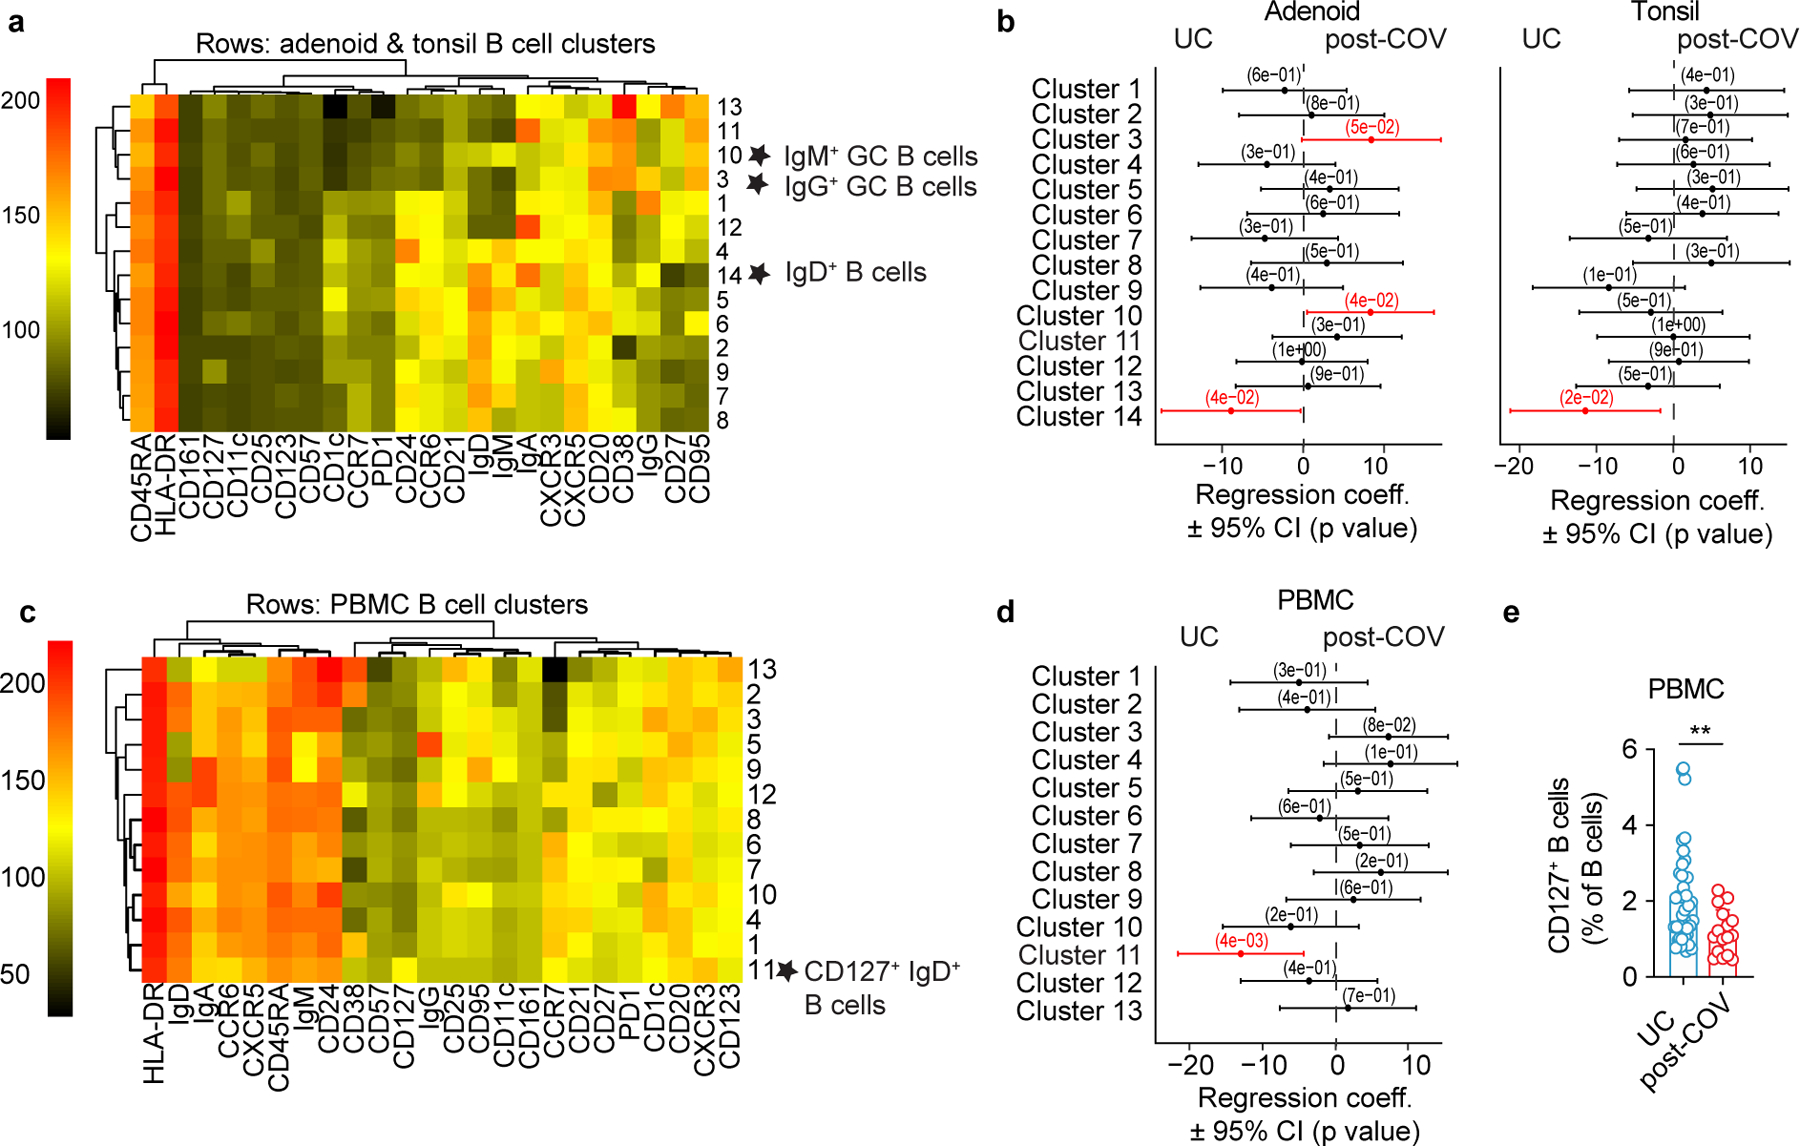
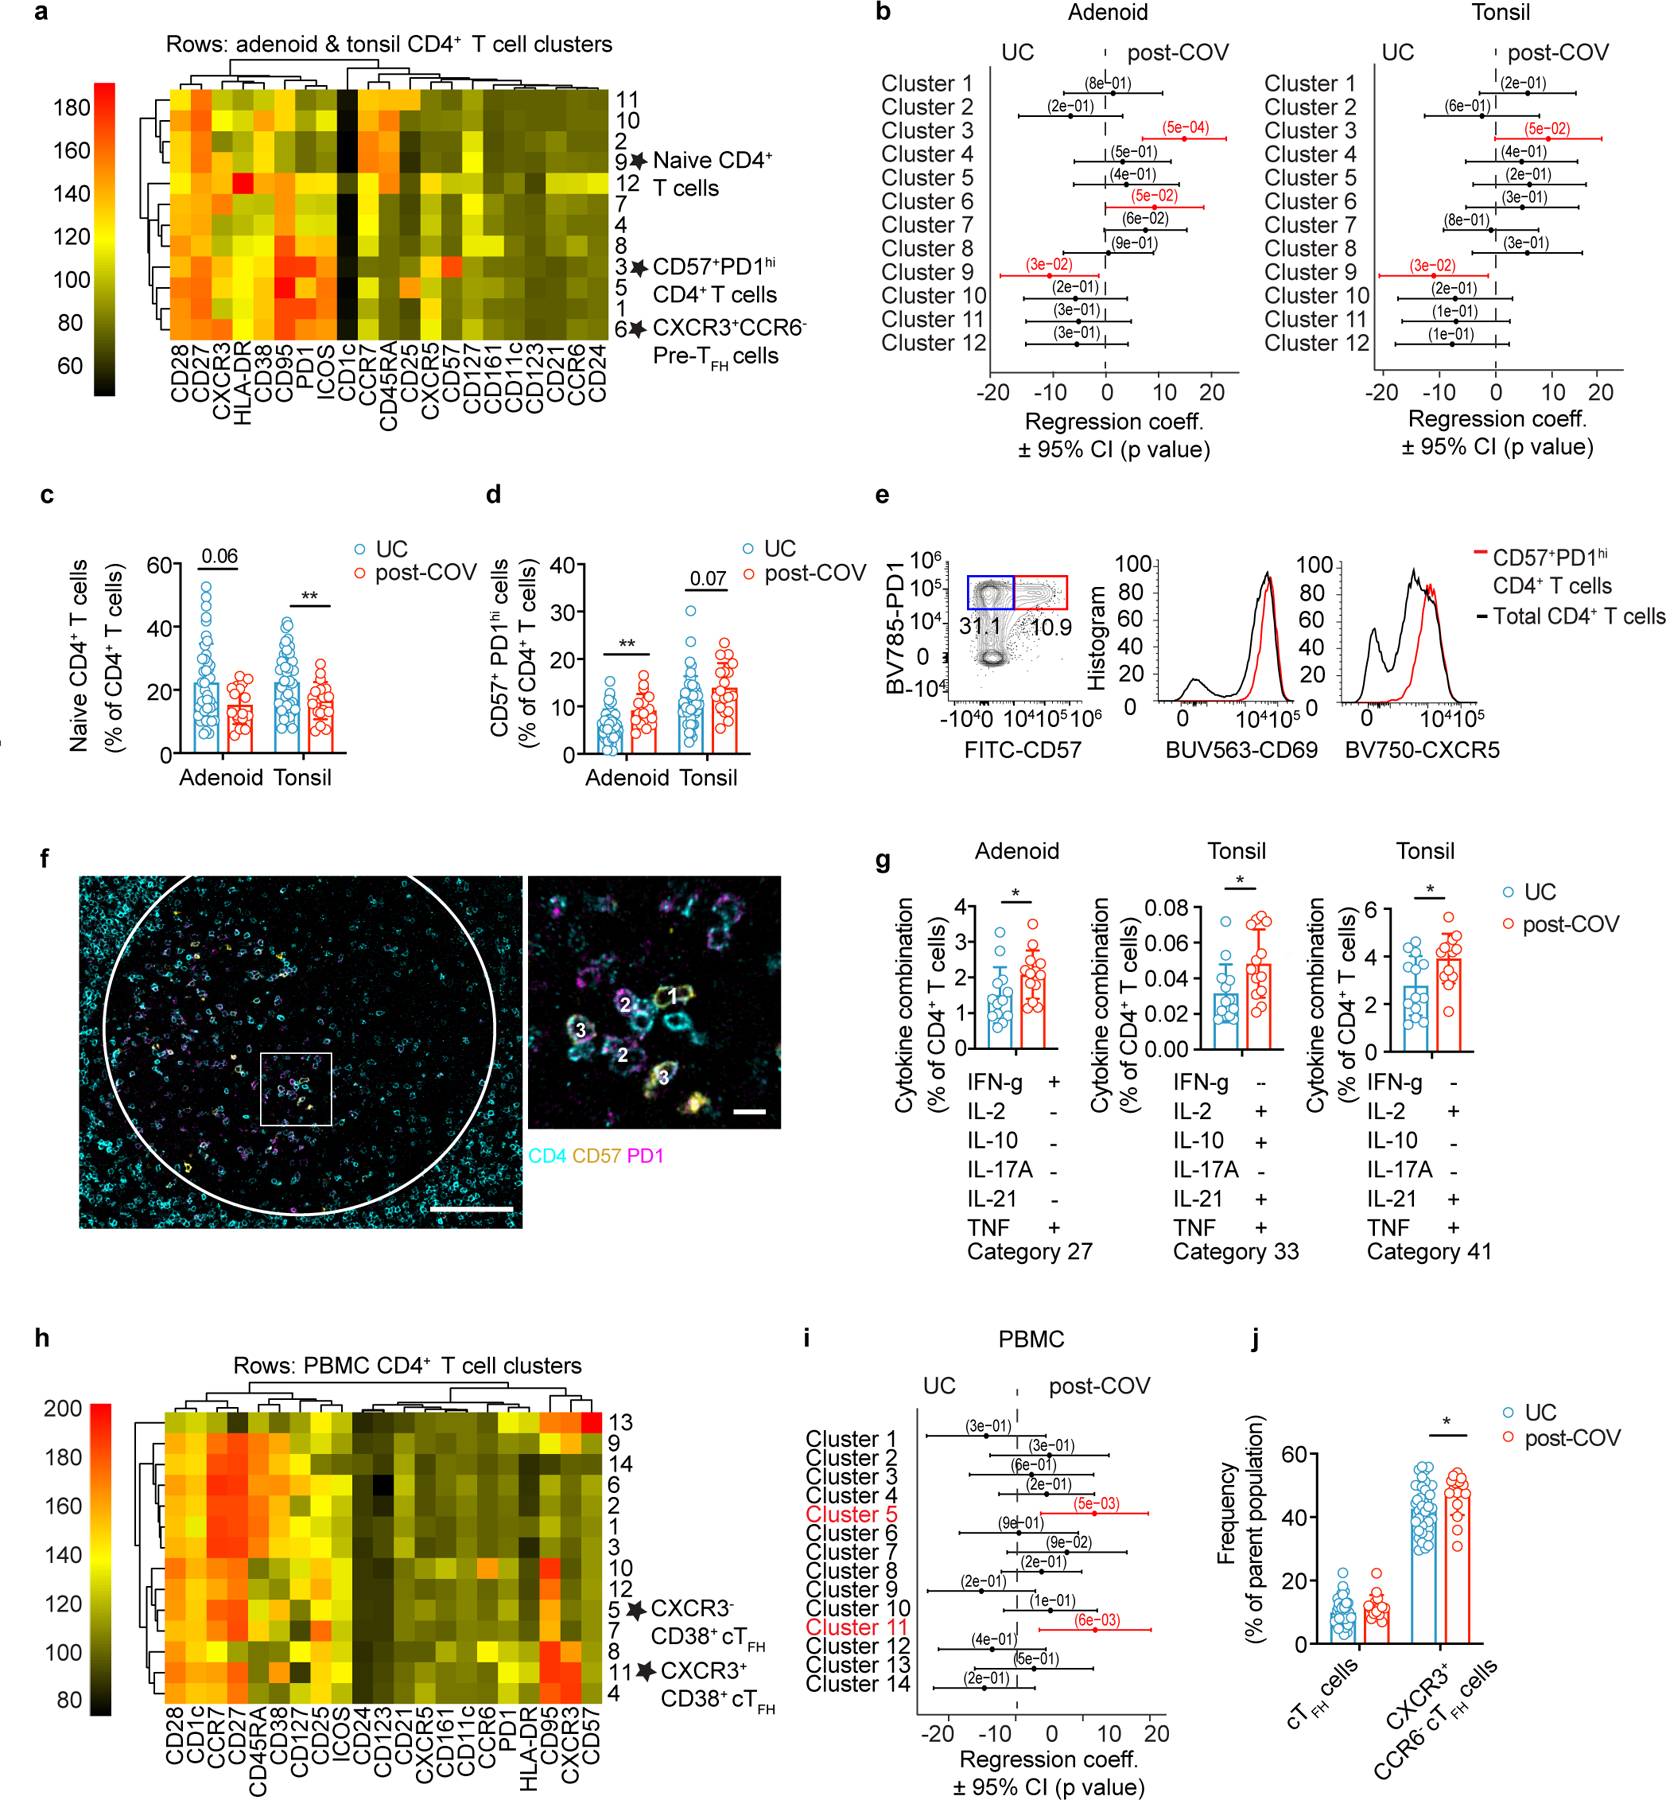
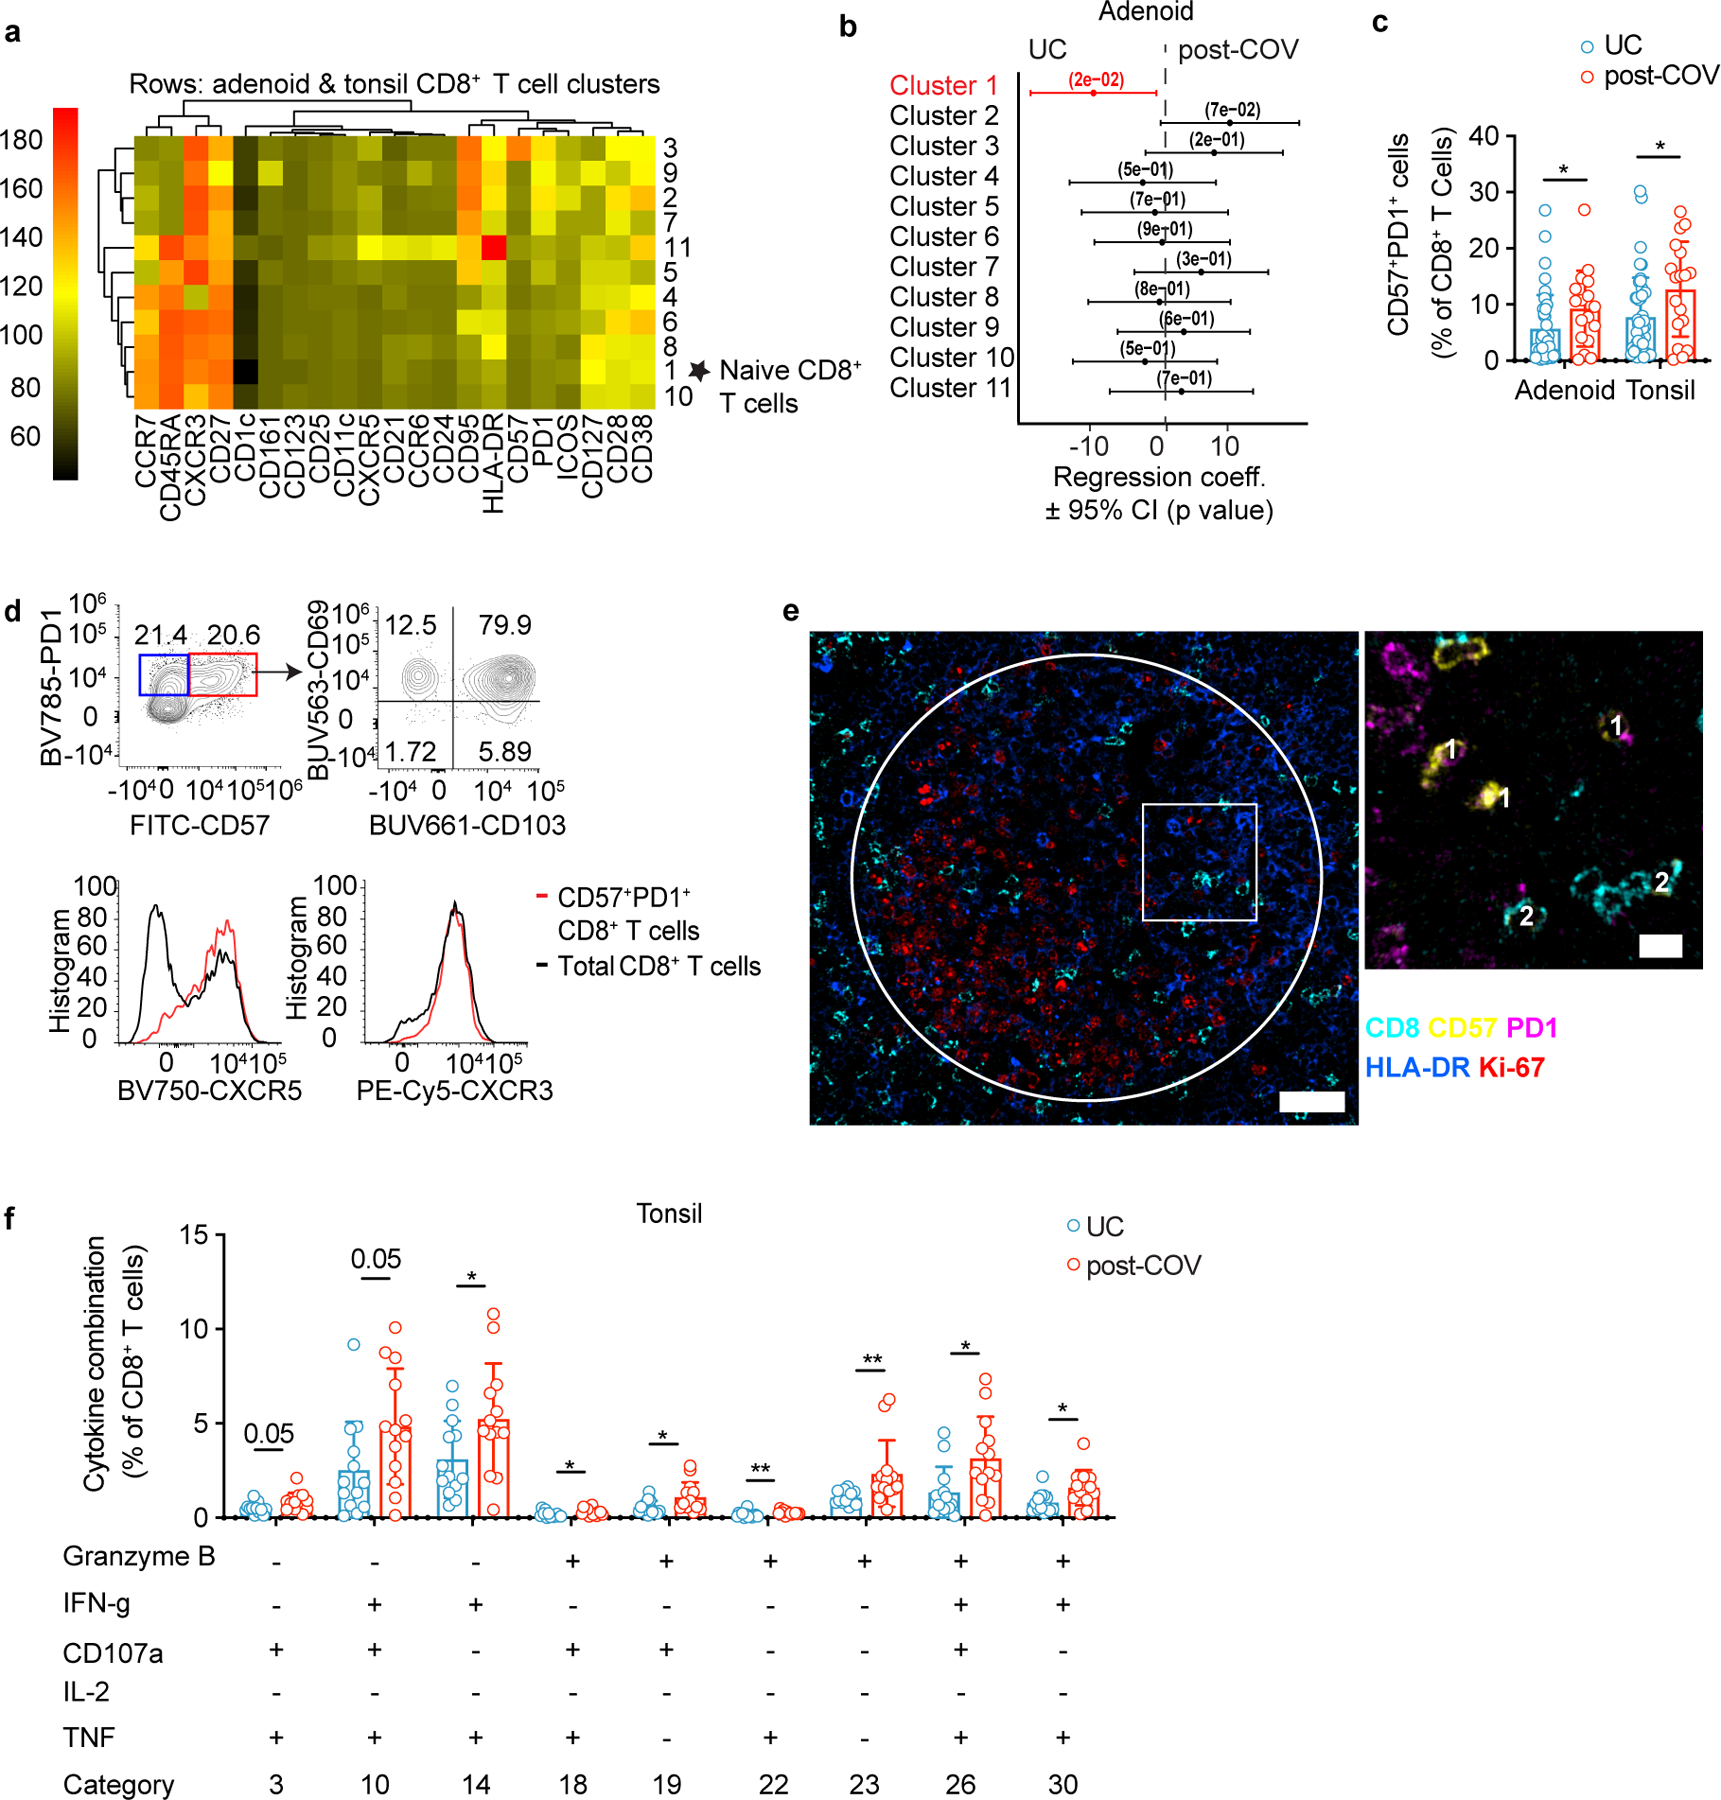
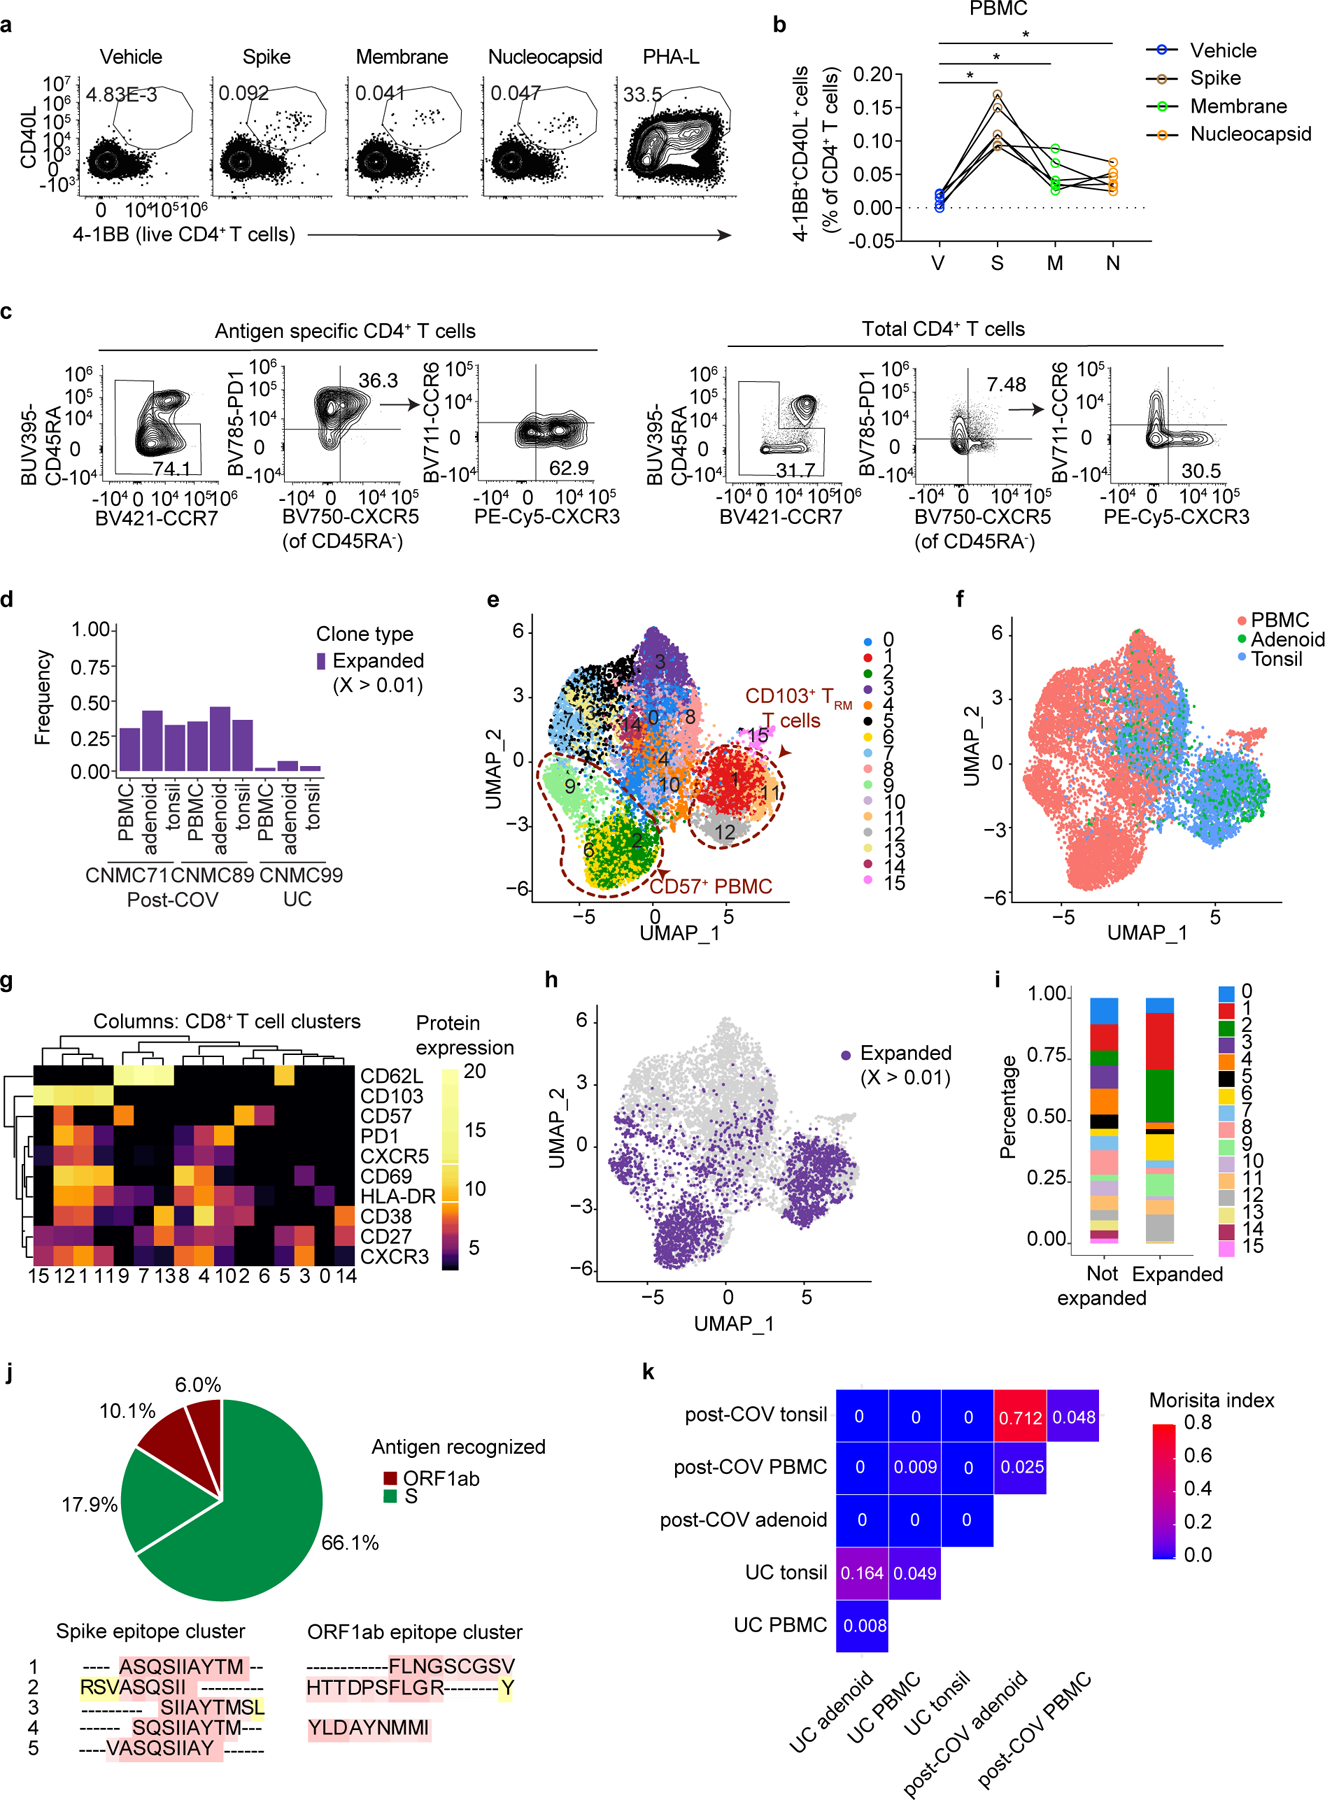
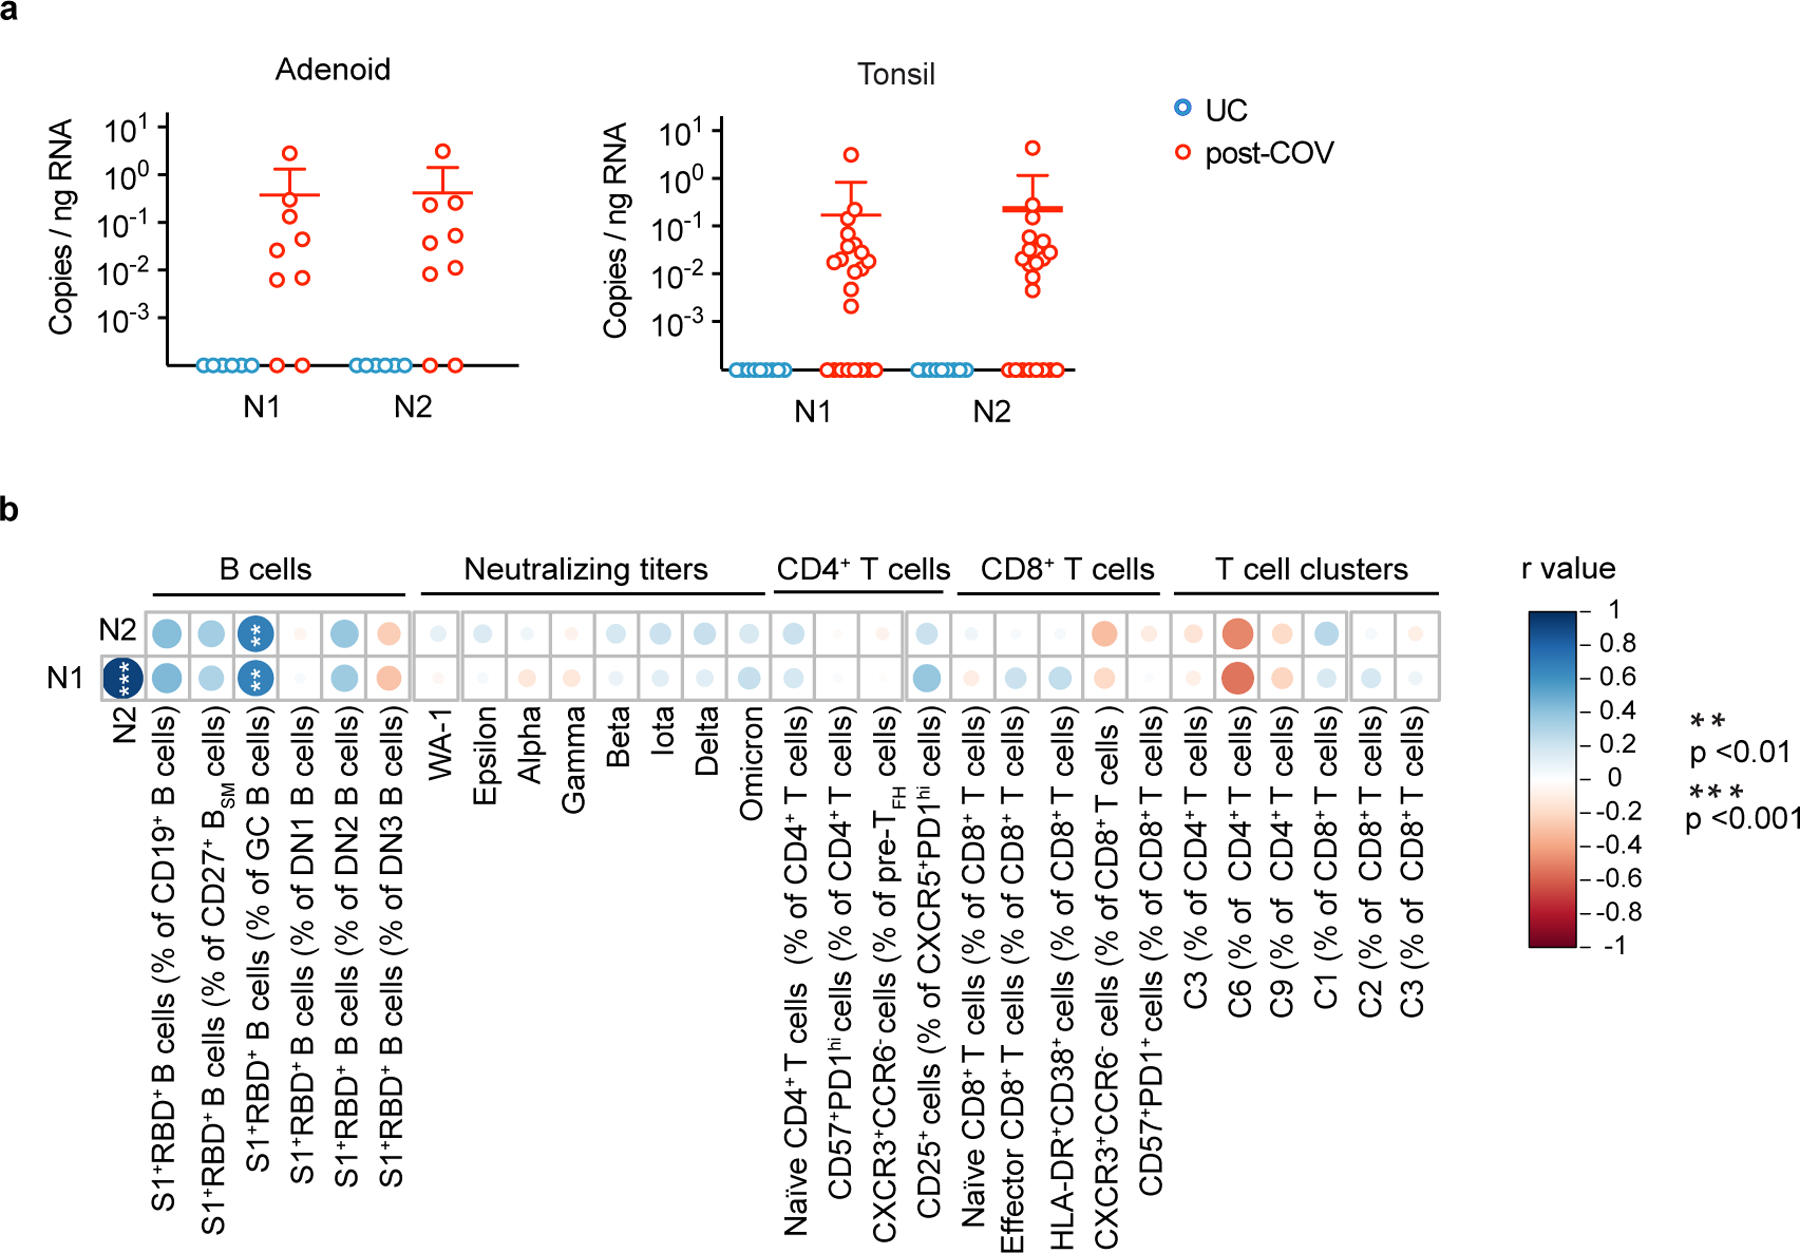
Most studies of adaptive immunity to SARS-CoV-2 infection focus on peripheral blood, which may not fully reflect immune responses at the site of infection. Using samples from 110 children undergoing tonsillectomy and adenoidectomy during the COVID-19 pandemic, we identified 24 samples with evidence of previous SARS-CoV-2 infection, including neutralizing antibodies in serum and SARS-CoV-2-specific germinal center and memory B cells in the tonsils and adenoids. Single-cell B cell receptor (BCR) sequencing indicated virus-specific BCRs were class-switched and somatically hypermutated, with overlapping clones in the two tissues. Expanded T cell clonotypes were found in tonsils, adenoids and blood post-COVID-19, some with CDR3 sequences identical to previously reported SARS-CoV-2-reactive T cell receptors (TCRs). Pharyngeal tissues from COVID-19-convalescent children showed persistent expansion of germinal center and antiviral lymphocyte populations associated with interferon (IFN)-γ-type responses, particularly in the adenoids, and viral RNA in both tissues. Our results provide evidence for persistent tissue-specific immunity to SARS-CoV-2 in the upper respiratory tract of children after infection.


Conflict of interest statement

Competing interests: P.M-A. is currently an employee of Novartis, and S. Preite and A.S. are currently employees of AstraZeneca; they may own stock or stock options. S.H.K. receives consulting fees from Peraton. K.B.H. receives consulting fees from Prellis Biologics. The remaining authors have no competing interests.

Figures

Extended Figure Data 1.
Extended Figure Data 1.. Characterization of neutralization titers and S1+RBD+ B cells
a. Correlation among S1+RBD+ cells frequency among B cells in post-COV PBMCs, tonsils, and adenoids. Data point color indicates neutralizing titers (PsVNA50) to WA-1. Donors with the lowest frequencies of S1+RBD+ B cells are labeled. Spearman’s coefficient (r) noted. b. CD27+BSM cell frequency among total B cells and among S1+RBD+ B cells from post-COV adenoids (p<0.0001) and tonsils (p<0.0001). c. S1+RBD+ B cell frequency among CD27+BSM cells in post-COV adenoids and tonsils according to time from positive PCR/antigen test to surgery. d. Proportion of each isotype among S1+RBD+ CD27+BSM cells and total CD27+BSM cells in post-COV PBMCs, adenoids, and tonsils. e. Percentage of S1+RBD+ B cells among CD27+BSM cells from post-COV and UC PBMCs, adenoids, and tonsils (all post-COV vs. UC p<10−6). f, g Mean number of GCs per total scanned tissue area (f) and mean GC area (total GC area/number of GCs in section) (g) from adenoids and tonsils from post-COV and UC donors (n=3 each). h, i. Percentage of S1+RBD+ B cells among total B cells (h) and GC B cells (i) from 14 pairs of post-COV adenoids and tonsils (total B p=0.007, GC B p=0.030) and UC (UC adenoid n=27; tonsil n=30). All post-COV vs. UC comparisons p<10−6. j. Summary of correlations between frequencies of S1+RBD+ cells among CD19+ B cells PBMCs, adenoids, and tonsils and PsVNA50 to multiple variants. Spearman’s correlation noted in color. % S1+RBD+ B in post-COV adenoid vs. PBMC p=0.006, tonsil vs. PBMC p=0.00003, tonsil vs. adenoid p=0.0003; % S1+RBD+ B in post-COV adenoid vs. PsVNA50 beta p=0.01, iota p=0.04, delta p=0.05, omicron p=0.04). Panels a-g, j: PBMC post-COV n=18, UC n=33; adenoid post-COV n=16, UC n=27; and tonsil post-COV n=16, UC n=30. Each symbol represents one donor. Means ± S.D. displayed in bar plots. Significance calculated with two-sided Mann-Whitney U test (unpaired) or Wilcoxon signed ranks test (paired). *p<0.05, ***p<0.001, ****p<0.0001
Extended Data Figure 2.
Extended Data Figure 2.. CITE-seq analysis of SARS-CoV-2 antigen-specific B cells
a,b. Heatmap of unsupervised clustering by CITE-seq antibody expression of S1+ and S1 B cells from tonsils, adenoids, and PBMCs from three donors (2 post-COV and 1 UC) yielding 15 clusters (a). Expression of signature gene sets for GC B cells, memory B (Mem) cells, and plasma cells/plasmablasts (PC/PB) among all B cells (S1+ and S1) organized by cluster (b). c. Heatmap showing differentially expressed (DE) genes in S1+ vs. S1 B cells from tonsils and adenoids from cluster 2 (which are CD27+BSM cells), see Supplementary Table 5. d. Sub-isotype percentages among sorted S1+ and S1 B cells from adenoids, tonsils and PBMCs of 2 post-COV donors (CNMC71 and 89) and one UC (CNMC99). Raw number of cells with a given sub-isotype are labelled only for sub-isotypes that make up >10% of a given category. e. Somatic hypermutation (SHM) frequency (calculated in V gene) among sorted S1+ and S1 B cells of all isotypes from PBMCs, adenoids, and tonsils of each donor. Median ± quartiles and p values shown in plots. Significance calculated with two-sided Mann Whitney U test. CNMC71 PBMC S1+ n=101, S1 n=577 cells; CNMC89 PBMC S1+ n=44, S1 n=1491 cells; CNMC99 PBMC S1 n=1026 cells; CNMC71 adenoid S1+ n=191, S1 n=1177 cells; CNMC89 adenoid S1+ n=261, S1 n=1647 cells; CNMC99 adenoid S1+ n=40, S1 n=1593 cells; CNMC71 tonsil S1+ n=286, S1 n=1514 cells; CNMC89 tonsil S1+ n=416, S1 n=2644 cells; CNMC99 tonsil S1+ n=66, S1 n=2346 cells. f. Sub-isotype frequencies among S1+ B cells from clones shared between tonsil and adenoid and unshared clones. Raw number of cells with a given sub-isotype are labelled only for sub-isotypes that make up >10% of a given category.
Extended Data Figure 3.
Extended Data Figure 3.. UMAP of unsupervised clustering of B cells from tonsil and adenoid
a. Uniform manifold approximation and projection (UMAP) of unsupervised clustering of surface markers from flow cytometric analysis of CD19+ B cells from adenoids and tonsils. b. Heatmaps of marker/antibody expression overlayed on UMAP.
Extended Data Figure 4.
Extended Data Figure 4.. UMAP of unsupervised clustering of CD4+ T cells from tonsil and adenoid
a. Comparison of CD3+, CD4+, and CD8+ T cell frequency in adenoid of post-COV (n = 17) and UC donors (n = 42), CD3+ p value = 0.043, CD4+ p = 0.017. b, c. UMAP of unsupervised clustering of surface markers from flow cytometric analysis of CD4+ T cells from adenoid and tonsil (b) with heatmaps of marker/antibody expression overlayed (c).
Extended Data Figure 5.
Extended Data Figure 5.. Phenotyping of expanded CD4+ T cell populations
a,b. Correlation between frequency of CD57+PD-1hi CD4+ T cells and frequency of GC B cells in adenoids (a, n=59) and tonsils (b, n=64). c,d. Intracellular cytokine and cytotoxic factor expression in various CD4+ T cell subsets gated on CD57 and PD-1 from post-COV adenoids (c, n=13) and tonsils (d, n=13) after PMA/ionomycin stimulation. Mean cell frequency shown in heatmap. e. Correlations among various subsets of SARS-CoV-2-specific B cells (defined in Supplementary Fig.1-2) and significantly different tissue CD4+ T cell clusters (clusters 3, 6, 9 shown as % of CD4+ T cells) from unsupervised analysis. f. Percentage of CD25+CXCR5+PD-1hi cells among CD4+ T cells in post-COV and UC adenoids and tonsils (p=0.031). g. Cytokine production by CD25+ and CD25 CXCR5+PD-1hi CD4+ T cells in tonsils (n=26) and adenoids (n=26) following PMA/ionomycin stimulation, all p < 0.0001. h. Correlation between frequency of CD25+CXCR5+PD-1hi CD4+ T cell and GC B cell frequencies in tonsils (n=64). i. Frequency of CXCR3+CCR6 cells among pre-TFH cells (PD-1intCXCR5+ conventional CD4+ T) in post-COV and UC adenoids (p=0.042) and tonsils. j, k. Intracellular cytokine/cytotoxic factor expression in different pre-TFH cell subsets gated on CXCR3 and CCR6 from post-COV adenoids (j, n=13) and tonsils (k, n=13) after PMA/ionomycin stimulation. Mean cell frequency shown in heatmap. l. Comparison of IFN- γ production by CD4+ T cells in adenoids and tonsils following PMA/ionomycin stimulation (n=26 including 13 post-COV and 13 UC samples of each tissue, p<0.0001). For panels c, f, and i: adenoids post-COV n=17, UC n=42; tonsils post-COV n=18, UC n=46. Each symbol represents one donor. Means ± S.D. displayed on bar plots. Significance calculated with two-sided Mann-Whitney U test to compare two groups and Spearman’s rank test for correlations (r is Spearman’s coefficient). *p<0.05, ****p<0.0001
Extended Data Figure 6.
Extended Data Figure 6.. cTFH cell populations are expanded post-COVID-19 in PBMC
a, b. UMAP of unsupervised clustering of surface markers from flow cytometric analysis of CD4+ T cells from PBMCs (a) with heatmaps of marker/antibody expression overlayed (b). c. Intracellular cytokine and cytotoxic factor production by various circulating TFH cell (cTFH) subsets in PBMC gated by CXCR3 and CCR6 from post-COV donors (n=4) following PMA/ionomycin stimulation. Mean cell frequency shown in heatmap. d. Frequency of CD45RA+CCR7+CD28+CD27+CD95+ CD4+ T stem cell-like memory (TSCM) cells in PBMC of post-COV (n=16) and UC (n=41), p=0.007. Each symbol represents one donor. Means ± S.D. displayed on bar plots. Significance calculated with two-sided Mann-Whitney U test. **p<0.01
Extended Data Figure 7.
Extended Data Figure 7.. UMAP of unsupervised clustering of CD8+ T cells from tonsil and adenoid
a. UMAP of unsupervised clustering of surface markers from flow cytometric analysis of CD8+ T cells from adenoids and tonsils. b. Heatmaps of marker/antibody expression overlayed on UMAP.
Extended Data Figure 8.
Extended Data Figure 8.. Expanded CD8+ T cell populations after COVID-19
a. Quantification of the effect of prior SARS-CoV-2 infection on CD8+ T cell clusters in tonsil showing regression coefficients ± 95% confidence intervals (CI) and p values, estimated with a linear model controlling for age and sex (post-COV n=15, UC n=42). b, c. Frequencies of CD45RA+CCR7+CD8+ naïve T (TN) and CD45RACCR7CD8+ effector memory T (TEM) cells in post-COV and UC adenoids (b) and tonsils (c, p=0.035 for TEM). d. Frequency of CXCR3+CCR6 cells among CD8+ T cells in post-COV and UC adenoids (p=0.022) and tonsils. e. Comparison of IFN-γ production by CD8+ T cells in adenoids and tonsils following PMA/ionomycin stimulation (n=26 for each tissue, p=0.003). f, g. Intracellular cytokine/cytotoxic factor production by different CD8+ T cell subsets gated by CD57 and PD-1 from post-COV adenoids (f, n=13) and tonsils (g, n=13). Mean cell frequency shown in heatmap. h. Unsupervised clustering of CD8+ T cells from PBMCs according to surface antibodies from flow cytometric analysis. No clusters showed significant differences (p<0.05) in post-COV (n=13) and UC (n=34) samples. i. Quantification of the effect of prior SARS-CoV-2 infection on CD8+ T cell clusters in PBMCs showing regression coefficients ± 95% CI and p values, estimated with a linear model controlling for age and sex. j. Frequency of CD45RA+CCR7+CD28+CD27+CD95+ CD8+ T stem cell-like memory (TSCM) in post-COV (n=16) and UC (n=41) PBMCs (p=0.002). For panels b-e, adenoids post-COV n=17, UC n=42, tonsils post-COV n=18, UC n=46. Each symbol represents one donor. Means ± S.D. displayed on bar plots. Significance calculated with two-sided Mann-Whitney U test. *p<0.05, **p<0.01.
Extended Data Figure 9.
Extended Data Figure 9.. SARS-CoV-2 antigen-specific T cells and TCR repertoire
a, b. Frequencies of AIM+ (OX40+4–1BB+) CD4+ T cells from adenoid (a) and tonsil (b) of post-COV tonsils (n=6) and adenoids (n=6) following SARS-CoV-2 spike (S), membrane (M), and nucleocapsid (N) peptide pool stimulation. DMSO (vehicle, V) is negative control. Significance calculated with two-sided Wilcoxon signed rank test for paired samples from the same donor. c. Among expanded CD8+ T cell clones, those with TCRβ CDR3 amino acid (aa) sequences that match those publicly reported to be SARS-CoV-2-reactive are highlighted in the UMAP (clustering shown in Fig. 7h). d. Frequency of matches among expanded CD8+ T cells from two post-COV donors (CNMC71 and 89) and one UC (CNMC99). More PBMCs were sorted than tonsil or adenoid cells in order to sort similar numbers of S1+ B cells from each sample; therefore, more T cells were analyzed from PBMCs than tonsil or adenoid. e. Antigens recognized by CD8+ T cells in post-COV samples with CDR3β aa sequences publicly reported to be SARS-CoV-2 reactive; proportion of cells recognizing each antigen is shown in the pie chart. f-g. Frequency of CD4+ T cells that are part of expanded clonotypes (frequency > 0.001 and absolute count ≥3) in tonsils, adenoids, and PBMCs. Clones were defined by identical CDR3⍺ (f) or CDR3β (g) aa sequences. h-m. UMAP (h), tissue distribution (i) and CITEseq surface antibody expression (j) of 14 clusters of sorted CD95+CD4+ T cells from tonsils, adenoids, and PBMCs of 2 post-COV donors and one UC. Expanded TCR⍺ or β clonotypes (k) and distribution of expanded clones across clusters (l). Expanded TCR⍺ clones with CDR3 sequences that match publicly-reported SARS-CoV-2-specific sequences (m). n. Overlap of CD4+ T cell clones among PBMCs, tonsils, and adenoids from 2 post-COV donors and one UC; degree of overlap between TCR⍺/β CDR3 aa sequences was calculated with the Morisita index (shown in plot), ranging from 0 to 1, with 0 indicating no sharing and 1 indicating full overlap.
Extended Data Fig. 10.
Extended Data Fig. 10.. Summary of findings
Schematic illustrating the immunologic profile of the pharyngeal lymphoid tissues and peripheral blood of COVID-19-convalescent children including (1) SARS-CoV-2-specific GC B, memory B, and T cells with overlapping B and CD8+ T cell clones in the tonsils and adenoids, (2) persistent changes in lymphocyte populations involved in GC and anti-viral responses, which were most prominent in the adenoid, with type 1 (IFN-γ-associated) skewing of several T lymphocyte populations, and (3) persistence of viral RNA in the tissue.
Figure 1.
Figure 1.. SARS-CoV-2 elicits robust humoral immune responses in children
a. Enrollment of post-COVID-19 (post-COV) and uninfected control (UC) subjects and study design. b. Time from previous positive SARS-CoV-2 PCR/antigen test to tonsillectomy and/or adenoidectomy in 11 subjects with known prior infection. c. Neutralizing antibody titers (PsVNA50) against the early isolate WA-1 and seven other SARS-CoV-2 variants of interest (post-COV n=23, UC n=14). d. Correlation between neutralizing antibody titers to WA-1 and days from positive SARS-CoV-2 test to surgery (n=10). Spearman’s rank correlation (r) and p values are noted. e. Frequency of SARS-CoV-2-specific (S1+RBD+) cells among total CD19+ B cells from PBMCs, adenoids and tonsils from post-COV and UC donors (PBMC post-COV n=18, UC n=33; adenoid post-COV n=16, UC n=27; and tonsil post-COV n=16, UC n=30; all p<10−6). f. Representative flow cytometry plots showing the percentage of S1+RBD+ cells among IgDCD38CD27+CD19+ switched memory B cells (CD27+BSM) in post-COV PBMCs, adenoids and tonsils. g. Composition of S1+RBD+ B cells and total B cells from post-COV PBMCs (n=18), adenoids (n=16), and tonsils (n=16). Mean frequency of each B cell subset (defined in Supplementary Fig. 1-2) shown in pie chart. ASC: antibody secreting cells equivalent to plasma cells and plasmablasts, CD27+ BUM: CD27+IgD+ unswitched memory B, GC: germinal center, DN: double negative. h. Images of adenoids and tonsils showing GCs from one post-COV donor and one UC, representative of 3 post-COV and 3 UC donors. Inset shows close-up of GC and light (CD21, follicular dendritic cells, cyan) and dark zones (Ki-67, dividing cells, red). CD138 (plasma cell and epithelial cell marker) in blue. Bar represents 1mm in upper row, 2mm in middle, and 200μm in lower. i. Composition of S1+RBD+ IgDCD27CD38CD19+ DN B cells and total DN B cells from post-COV PBMC (n=18), adenoids (n=16) and tonsils (n=16). Mean frequency of each DN subset shown in bar chart. Means ± S.D. are displayed in bar and scatter plots. Each dot represents one donor. Significance calculated with two-sided Mann-Whitney U test. ****p<0.0001.
Figure 2.
Figure 2.. CITE-seq analysis of SARS-CoV-2 antigen-specific B cells
a. Uniform manifold approximation and projection (UMAP) showing 15 clusters of sorted S1+ and S1 B cells (see Supplementary Fig. 3) from tonsils, adenoids, and PBMCs from 2 post-COV (CNMC71 and CNMC89) and one UC (CNMC99) donors clustered according to CITE-seq surface antibody expression. b. Tissue distribution of S1+ and S1 B cells in a. c. Distribution of S1+ B cells among clusters in a. d. Proportion of each of the 15 clusters among S1 and S1+ B cells in a. e. Heat map showing expression of signature gene sets for GC B cells, memory B cells (Mem), and plasma cells/plasmablasts (PB/PC) among S1+ B cells organized by cluster. IgD, CD38, and CD27 CITE-seq antibody expression are shown in lower heat map in grey. Tissue origin is shown in purple (tonsil), yellow (adenoid), and red (PBMC). Clones shared between tonsil and adenoid are marked in black in the top bar.
Figure 3.
Figure 3.. Single cell BCR sequencing of SARS-CoV-2 antigen-specific B cells
a. Sub-isotype percentages among sorted S1+ and S1 B cells from PBMC, adenoid and tonsil of one post-COV donor (CNMC89). Labels show the raw number of cells with a given sub-isotype and are only included for sub-isotypes that make up at least 10% of a given category. b. Somatic hypermutation (SHM) frequency among sorted S1+ and S1 B cells from PBMC, adenoid and tonsil of CNMC 89 (PBMC S1+ n= 44, S1 n=1491 cells; adenoid S1+ n=261, S1 n=1647 cells; tonsil S1+ n=416, S1 n=2644 cells). Mutation frequency calculated in V gene. Medians ± quartiles and p values are shown in the box plots. c. Simpson’s diversity of S1+ and S1 B cells from PBMCs, adenoids and tonsils from 2 post-COV donors (CNMC71 and 89) and S1 B cells from one UC (CNMC99). Lower Simpson’s diversity values indicate a greater frequency of large clones. d. Overlap of B cell clones among PBMCs, tonsils and adenoids from post-COV and UC donors. Off-diagonal elements are colored by the Jaccard index of clonal overlap between the two tissues and are labelled by the raw number of overlapping clones. Diagonal elements are labelled by the total number of clones within a particular tissue. e. Clonal lineage trees from two of the largest S1+ B cell clones shared between tonsil and adenoid from CNMC89. Triangles indicate S1+ cells, and tip color indicates tissue of origin (purple: tonsil; yellow: adenoid). Isotype and CITE-seq cluster of each cell are listed next to the symbol. Branch lengths represent SHM frequency/codon in VDJ sequence according to the scale bar. Significance calculated with two-sided Mann Whitney U test.
Figure 4.
Figure 4.. GC B cells are expanded in adenoids after COVID-19
a- d. Unsupervised clustering of CD19+ B cells from adenoids and tonsils (a) and PBMCs (c) according to flow cytometric surface markers. Quantification of the effect of prior SARS-CoV-2 infection on CD19+ B cell clusters in adenoids and tonsils (b) and PBMCs (d) showing regression coefficients ± 95% confidence intervals (CI) and p values, estimated with a linear model controlling for age and sex. Significantly different clusters (p<0.05) between post-COV and UC groups are indicated with a star or highlighted in red. Adenoids: post-COV n=11, UC n=33; tonsils: post-COV n=15, UC n=42; PBMC: post-COV n=14, UC n=36. e. Frequency of CD127+ B cells in post-COV (n=16) and UC (n=41) PBMCs, p=0.006. Significance calculated with two-sided Mann-Whitney U test. Each symbol represents one donor. Means ± S.D. are displayed. **p<0.01.
Figure 5.
Figure 5.. CD4+ TFH cells are expanded post-COVID-19
a, b. Unsupervised clustering of CD4+ T cells from adenoids and tonsils according to flow cytometric surface markers (a). Quantification of the effect of prior SARS-CoV-2 infection on CD4+ T cell clusters showing regression coefficients ± 95% confidence intervals (CI) and p values, estimated with a linear model controlling for age and sex (b). Significantly different clusters (p<0.05) between post-COV and UC groups are indicated with a star or highlighted in red. Adenoids: post-COV n=12, UC n=38; tonsils: post-COV n=15, UC n=43. c, d. Frequencies of manually-gated CD45RA+CCR7+ naïve CD4+ T cells (p=0.022 for tonsils) (c) and CD57+PD-1hi CD4+ T cells (p=0.001 for adenoid) (d) in post-COV and UC adenoids and tonsils (adenoids post-COV n=17, UC n=42; tonsils post-COV n=18, UC n=46). e. Plots of CD69 and CXCR5 expression on CD57+PD-1hi CD4+ T cells and total CD4+ T cells from one tonsil, representative of tonsils and adenoids from 26 donors. f. Image of post-COV adenoid showing CD57+PD-1hi CD4+ T cells in one GC, representative of tonsils and adenoids from 6 donors. Magnification of square inset shown on the right. CD4 in cyan, CD57 in yellow, and PD-1 in magenta. GC boundaries defined using Ki-67 (see Figure 1h). 1:CD4+CD57+, 2:CD4+PD-1+, 3:CD4+CD57+PD-1+ cells. Scale bars 100μm (left) and 10μm (right). g. Cytokine combinations (IFN-γ, IL-2, IL-10, IL-17A, IL-21 and TNF, as analyzed by SPICE) produced by tonsillar or adenoid CD4+ T cells from post-COV (n=13) and UC (n=13) donors following PMA and ionomycin stimulation (category 27: p=0.04, 33: p=0.01, 41: p=0.03). h,i. Unsupervised clustering of CD4+ T cells from PBMC (h) and quantification of the effect of prior SARS-CoV-2 infection (i) as described in a, b (post-COV n=13, UC n=34). j. Frequencies of CD45RACXCR5+PD-1+ circulating TFH (cTFH) and CXCR3+CCR6 cTFH cells in post-COV (n=16) and UC (n=41) PBMCs, p=0.032 for CXCR3+CCR6 cTFH cells. Sample list for panels a-d and h-j in Supplementary Table 2 and for panel g in Supplementary Table 11. Each symbol represents one donor. Means ± S.D. displayed in bar plots. Significance calculated with two-sided Mann-Whitney U test. *p<0.05, **p<0.01.
Figure 6.
Figure 6.. Tissue-resident memory CD8+ T cells are expanded post-COVID-19
a, b. Unsupervised clustering of CD8+ T cells from adenoids and tonsils according to flow cytometric surface markers (a). Quantification of the effect of prior SARS-CoV-2 infection on CD8+ T cell clusters showing regression coefficients ± 95% confidence intervals (CI) and p values, estimated with a linear model controlling for age and sex (b). Significantly different clusters (p<0.05) between post-COV and UC groups are indicated with a star or highlighted in red. Adenoids post-COV n=12, UC n=35; tonsils post-COV n=15, UC n=42. c. Frequency of CD57+PD-1+ CD8+ T cells in post-COV and UC adenoids (post-COV n=17, UC n=42, p=0.044) and tonsils (post-COV n=18, UC n=46, p=0.030) d. Flow cytometry plots showing CD69, CD103, CXCR5 and CXCR3 expression on CD57+PD-1+ CD8+ T cells from one tonsil, representative of tonsils and adenoids from 26 donors. e. Adenoid from post-COV donor showing the location of CD57+PD-1+ CD8+ T in one GC, representative of 6 samples. GC is circled, magnification of square is in inset. CD8 is cyan, CD57 is yellow, PD-1 is pink. HLA-DR (blue) stains follicles, and Ki-67 (red) stains GC. 1:CD8+CD57+PD-1+; 2:CD8+CD57+ cells, scale bars 50μm (left), 10μm (right) f. Cytokine/cytotoxic factor combinations (involving granzyme B, IFN-γ, CD107a, IL-2 and TNF, analyzed by SPICE) produced by tonsillar CD8+ T cells from post-COV (n=13) and UC (n=13) donors following PMA and ionomycin stimulation. (Category 3: p=0.049, 10: p=0.051, 14: p=0.035, 18: p=0.020, 19: p=0.032, 22: p=0.007, 23: p=0.001, 26: p=0.017, 30: p=0.025). Sample list for panels a-c in Supplementary Table 2 and panels e-f in Supplementary Table 11. Each symbol represents one donor. Means ± S.D. are displayed in bar plots. Significance calculated using two-sided Mann-Whitney U test. *p<0.05.
Figure 7.
Figure 7.. SARS-CoV-2 antigen-specific T cells
a. Representative flow cytometry plots showing gating of antigen-specific CD4+ T cells from post-COV PBMCs expressing activation induced markers (AIM+: CD40L+4–1BB+) following stimulation with SARS-CoV-2 peptide pools of spike (S), membrane (M), and nucleocapsid (N). DMSO (vehicle, V) is the negative control, PHA-L, positive control. b. Frequencies of AIM+CD4+ T cells from 6 post-COV PBMCs as in a (V vs. S, p=0.031; V vs. M, p=0.031; V vs. N, p=0.031). Significance calculated with two-sided Wilcoxon signed rank test for paired samples from the same donor. c. Flow cytometry plots showing frequency of memory T cells (shown in box on left plots), CD45RACXCR5+PD-1+ cTFH cells, and CXCR3+CCR6 cTFH cells from concatenated antigen-specific CD4+ T cells from S, M, and N peptide pool stimulations from 6 donors compared to total CD4+ T cells in PBMC. d. Frequency of CD8+ T cells that are part of expanded clonotypes (frequency >0.01, clone defined by identical CDR3β amino acid (aa) sequence) in tonsils, adenoids and PBMCs from two post-COV donors (CNMC71 and CNMC89) and one UC (CNMC99) assessed by CITE-seq and TCR sequencing. e-g. UMAP (e), tissue distribution (f) and CITE-seq surface antibody expression (g) of 16 clusters of CD95+CD8+ T cells from tonsils, adenoids and PBMCs of the three donors in d. h-i. Expanded clonotypes (h) and the distribution of expanded and non-expanded clones across clusters (i) of CD95+CD8+ T cells in e. j. Antigens recognized by 4 expanded CD8+ T cell clones (each represented by a slice) with CDR3β sequences matching those reported to be SARS-CoV-2-specific in public databases; percentage of cells in each clone noted. Clones recognizing spike epitopes in green and ORF1ab epitopes in red. Clones reported to recognize >1 antigen not shown. Nested epitopes recognized by spike- and ORF1ab-specific TCRs are depicted below the pie chart (see Supplementary Table 8). k. Overlap of CD8+ T cell clones among PBMCs, tonsils and adenoids from 2 post-COV donors and one UC; degree of overlap between TCR⍺/β CDR3 aa sequences was calculated with the Morisita index (shown in plot), ranging from 0 to 1, with 0 indicating no sharing and 1 indicating full overlap. *p<0.05
Figure 8.
Figure 8.. Persistence of SARS-CoV-2 RNA in the pharyngeal tissues post-COVID-19
a. Quantification of SARS-CoV-2 nucleocapsid RNA by droplet digital PCR (ddPCR) from adenoid and tonsil FFPE tissue blocks (adenoids post-COV n=9 and UC=6, tonsils post-COV n=22 and UC n=9). N1 and N2 represent two regions of the gene encoding the SARS-CoV-2 nucleocapsid. Each symbol represents one donor. Means ± S.D. are displayed. Analyzed samples listed in Supplementary Table 9. b. Summary of correlations among various subsets of SARS-CoV-2 antigen-specific B cells, serum neutralizing antibody titers, and T cell populations of interest versus copies of nucleocapsid (N1 and N2) RNA in post-COV tonsils. Correlations assessed with Spearman’s rank correlation (copies N1 vs. N2 p < 10−5; percentage of S1+RBD+ B cells among GC B cells vs. N1 p=0.004, and vs. N2 p=0.005). r is Spearman’s coefficient. P values were not corrected for multiple comparisons. **p<0.01; ***p<0.001.

Update of

References

    1. Weisberg SP et al. Distinct antibody responses to SARS-CoV-2 in children and adults across the COVID-19 clinical spectrum. Nature Immunology 22, 25–31, doi:10.1038/s41590-020-00826-9 (2021). - DOI - PMC - PubMed
    1. Pierce CA et al. Immune responses to SARS-CoV-2 infection in hospitalized pediatric and adult patients. Science Translational Medicine 12, eabd5487, doi:10.1126/scitranslmed.abd5487 (2020). - DOI - PMC - PubMed
    1. Wölfel R et al. Virological assessment of hospitalized patients with COVID-2019. Nature 581, 465–469, doi:10.1038/s41586-020-2196-x (2020). - DOI - PubMed
    1. Huang N et al. SARS-CoV-2 infection of the oral cavity and saliva. Nature Medicine 27, 892–903, doi:10.1038/s41591-021-01296-8 (2021). - DOI - PMC - PubMed
    1. Wagar LE et al. Modeling human adaptive immune responses with tonsil organoids. Nature Medicine 27, 125–135, doi:10.1038/s41591-020-01145-0 (2021). - DOI - PMC - PubMed

Methods References:

    1. Michael S et al. Standardization of ELISA protocols for serosurveys of the SARS-CoV-2 pandemic using clinical and at-home blood sampling. Nature communications 12, doi:10.1038/s41467-020-20383-x (2021). - DOI - PMC - PubMed
    1. Kalish H et al. Undiagnosed SARS-CoV-2 seropositivity during the first 6 months of the COVID-19 pandemic in the United States. Science Translational Medicine 13, eabh3826, doi:doi:10.1126/scitranslmed.abh3826 (2021). - DOI - PMC - PubMed
    1. Zahra FT, Bellusci L, Grubbs G, Golding H & Khurana S Neutralisation of circulating SARS-CoV-2 delta and omicron variants by convalescent plasma and SARS-CoV-2 hyperimmune intravenous human immunoglobulins for treatment of COVID-19. Annals of the Rheumatic Diseases, annrheumdis-2022–222115, doi:10.1136/annrheumdis-2022-222115 (2022). - DOI - PubMed
    1. Ravichandran S et al. Antibody signature induced by SARS-CoV-2 spike protein immunogens in rabbits. Sci Transl Med 12, doi:10.1126/scitranslmed.abc3539 (2020). - DOI - PMC - PubMed
    1. Tang J et al. Antibody affinity maturation and plasma IgA associate with clinical outcome in hospitalized COVID-19 patients. Nat Commun 12, 1221, doi:10.1038/s41467-021-21463-2 (2021). - DOI - PMC - PubMed

Publication types

Substances