. 2022 Dec;4(12):1812-1829.
doi: 10.1038/s42255-022-00681-y. Epub 2022 Dec 19.

Liver RBFOX2 regulates cholesterol homeostasis via Scarb1 alternative splicing in mice

Affiliations

Liver RBFOX2 regulates cholesterol homeostasis via Scarb1 alternative splicing in mice

Helen A B Paterson et al. Nat Metab. 2022 Dec.

Abstract

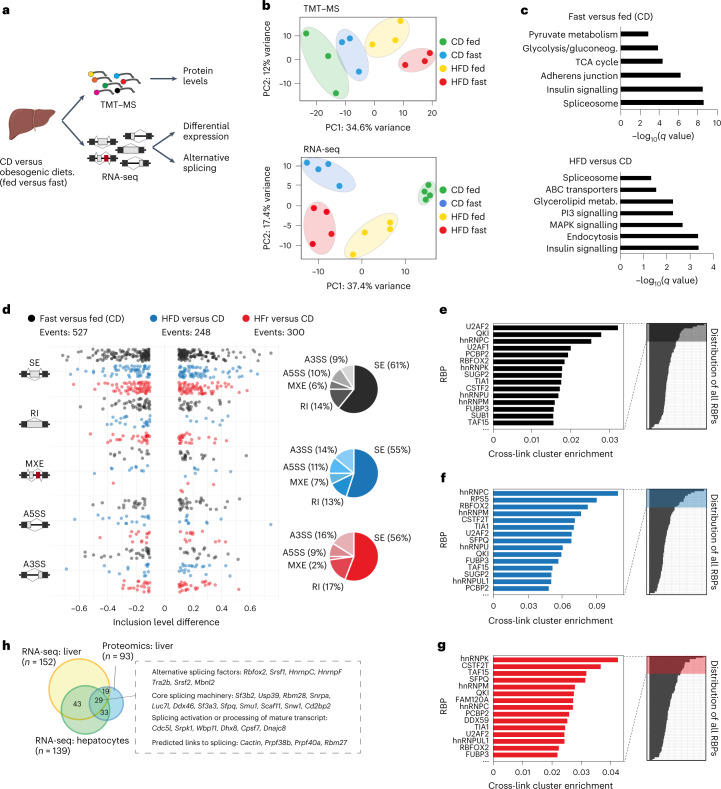
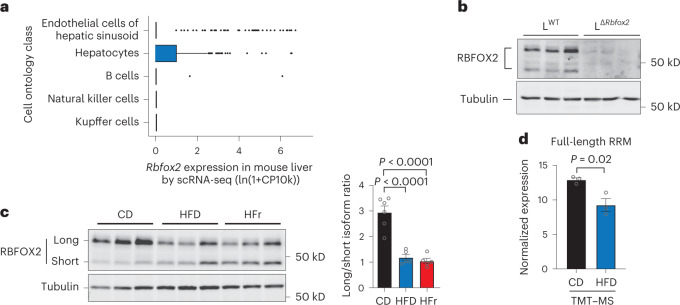
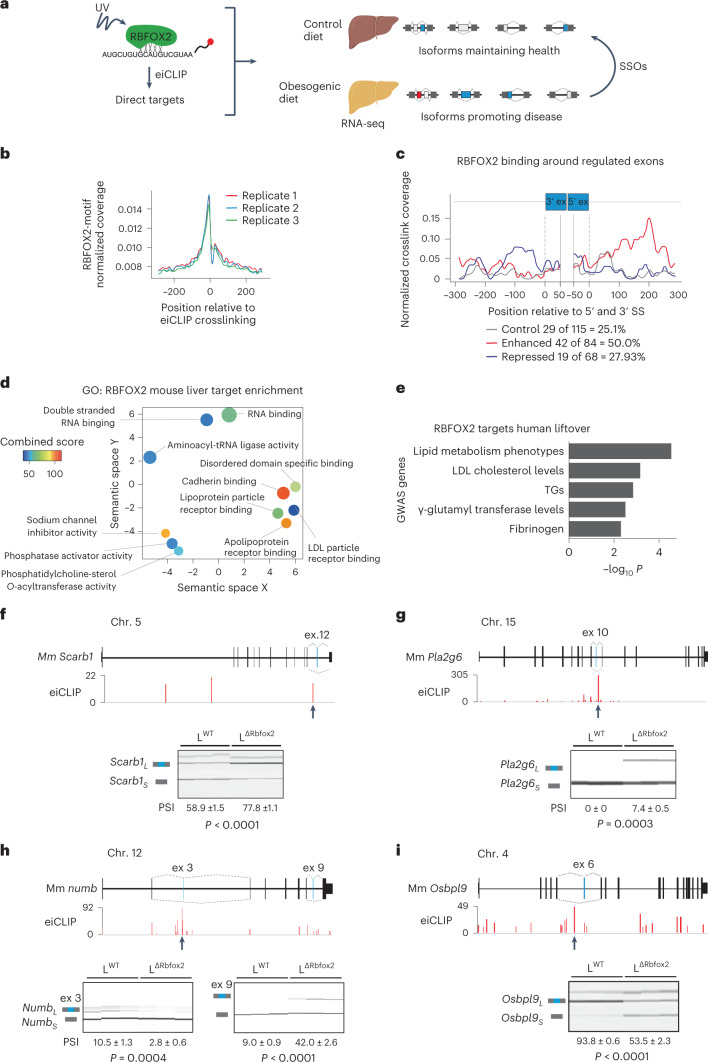
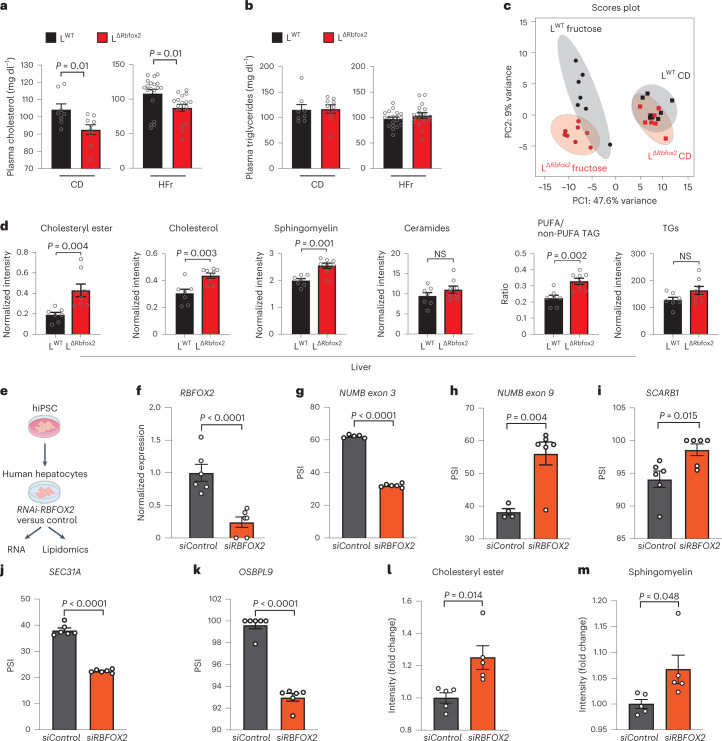
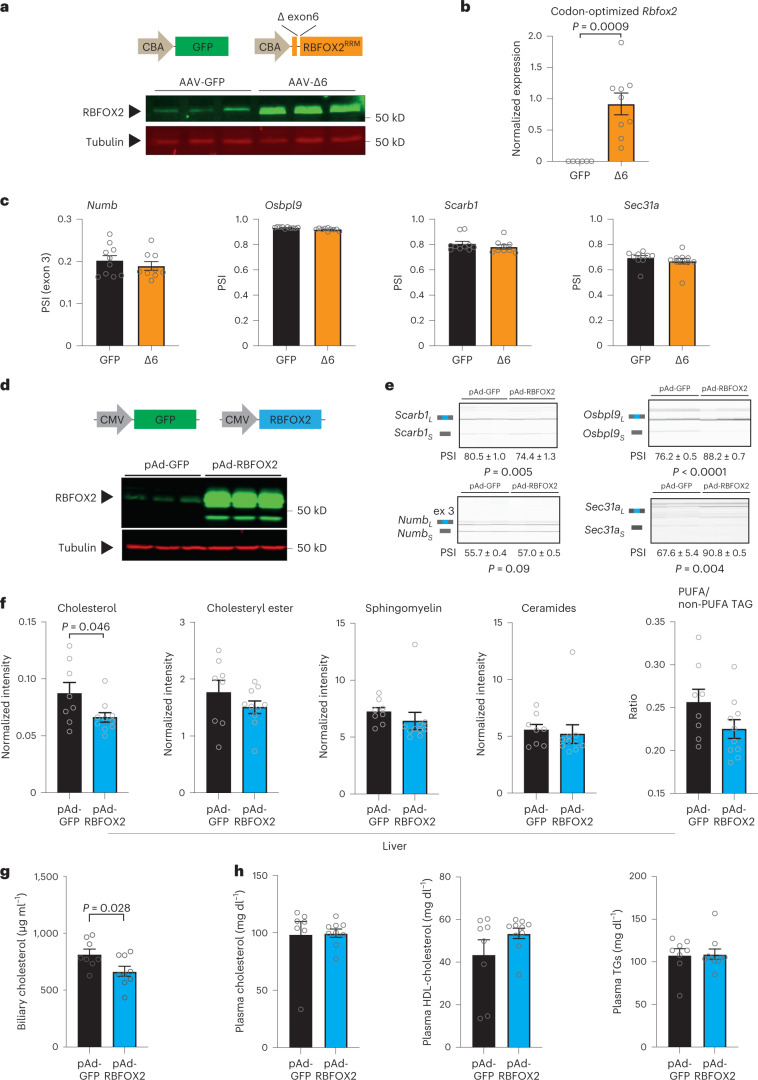
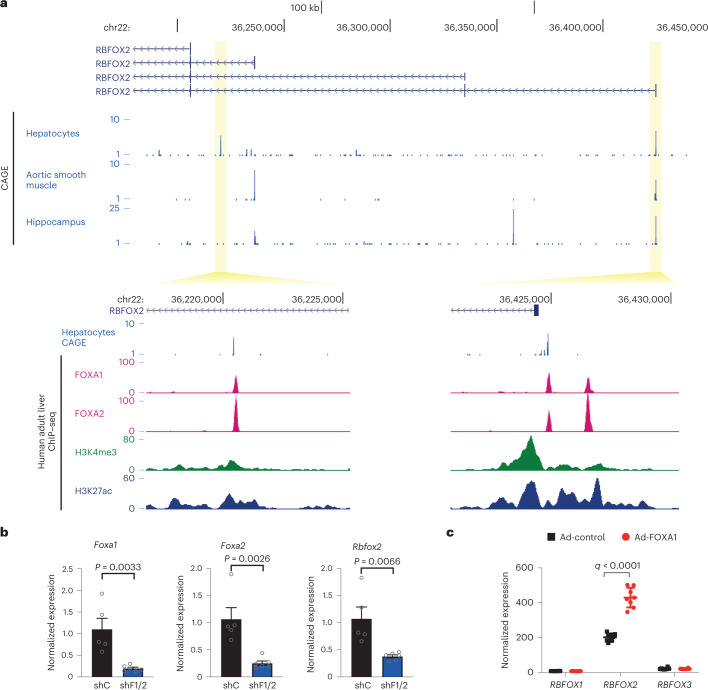
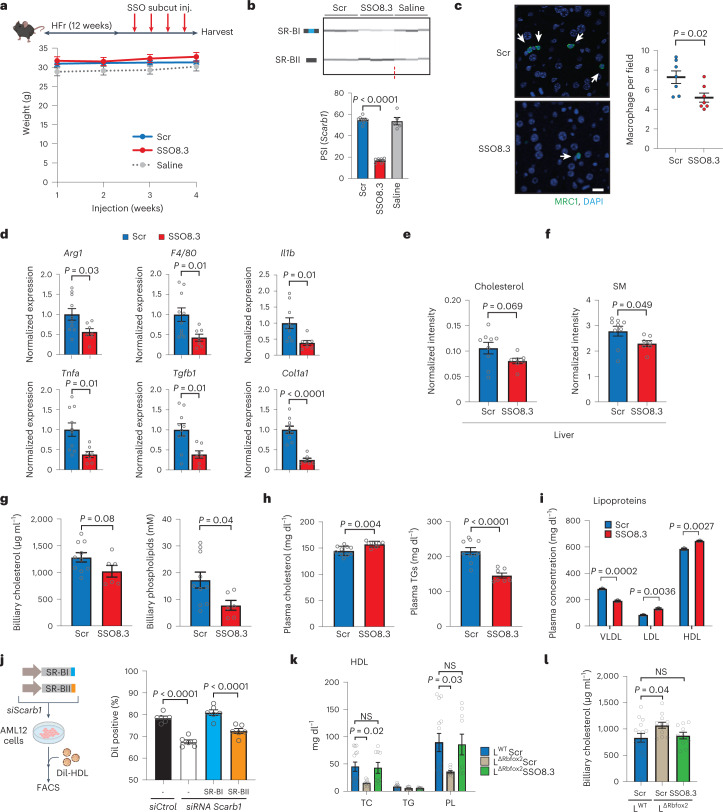
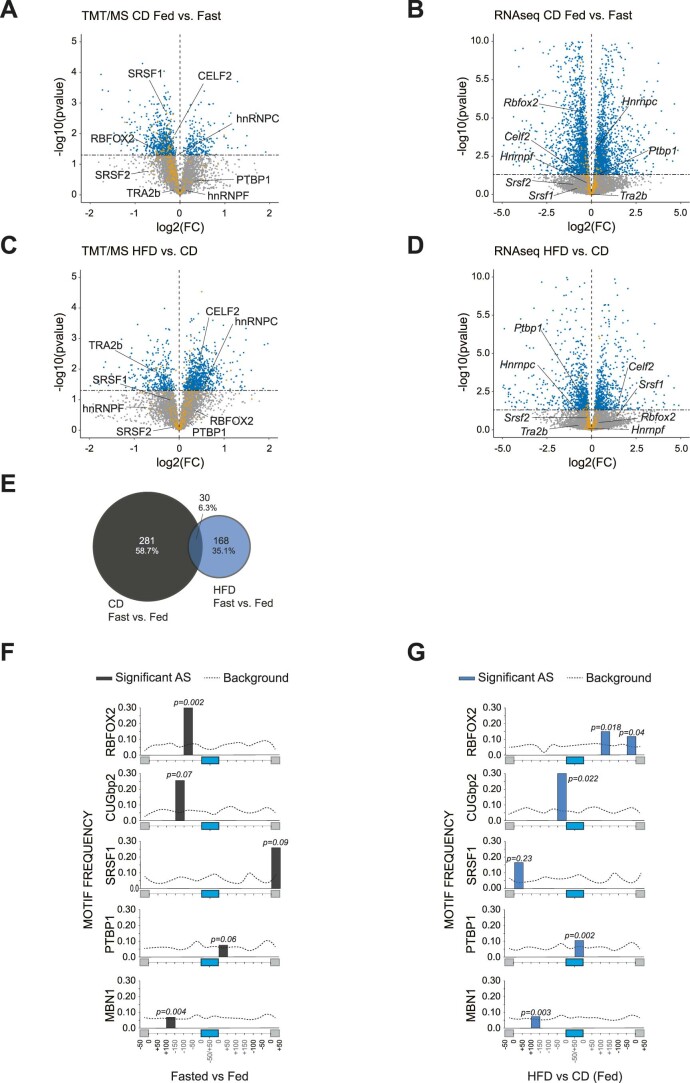
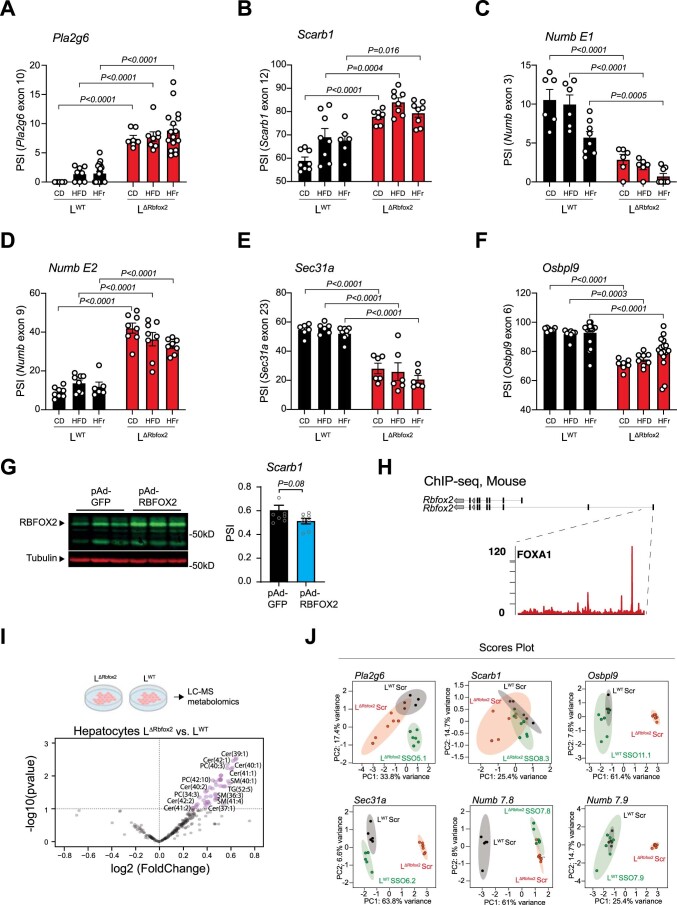
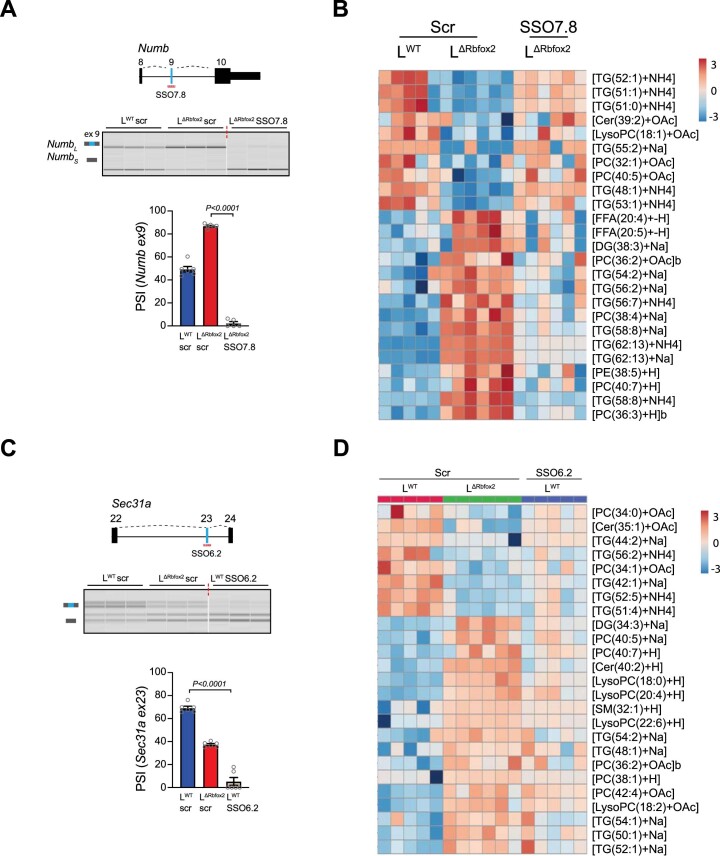
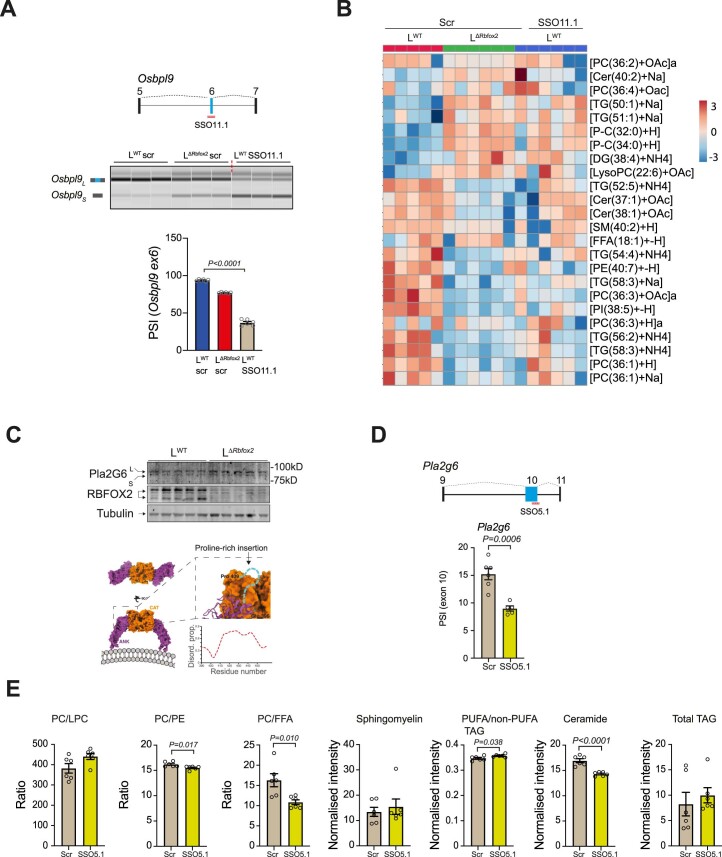
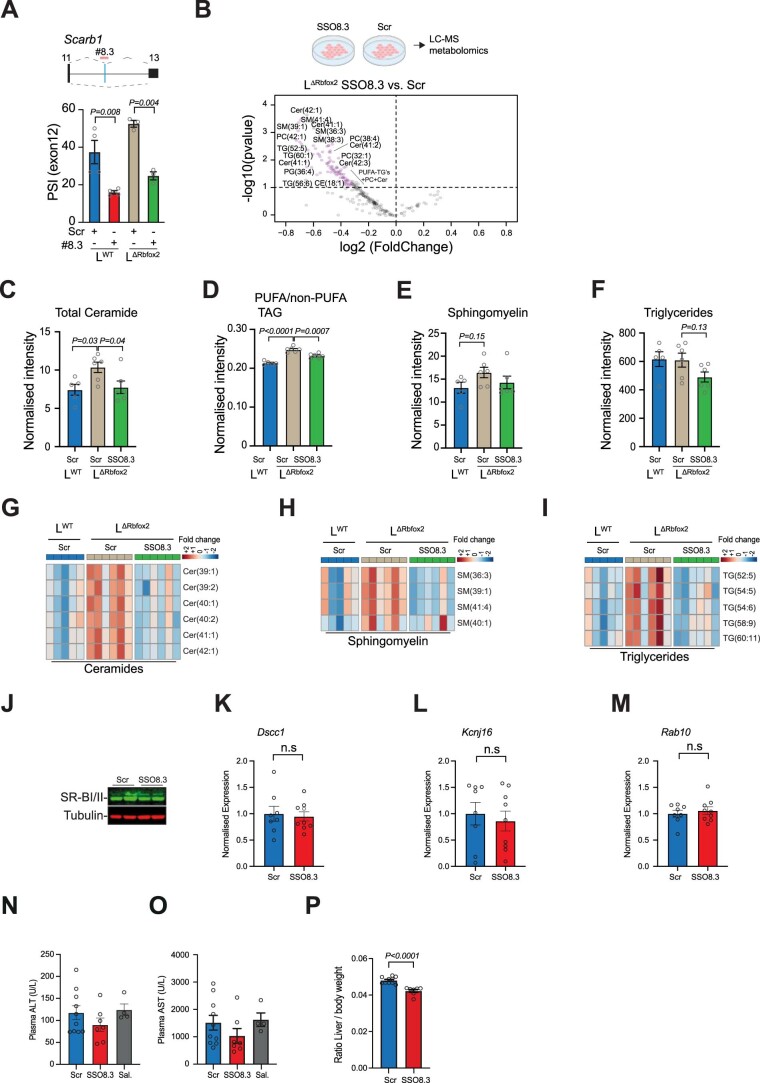
RNA alternative splicing (AS) expands the regulatory potential of eukaryotic genomes. The mechanisms regulating liver-specific AS profiles and their contribution to liver function are poorly understood. Here, we identify a key role for the splicing factor RNA-binding Fox protein 2 (RBFOX2) in maintaining cholesterol homeostasis in a lipogenic environment in the liver. Using enhanced individual-nucleotide-resolution ultra-violet cross-linking and immunoprecipitation, we identify physiologically relevant targets of RBFOX2 in mouse liver, including the scavenger receptor class B type I (Scarb1). RBFOX2 function is decreased in the liver in diet-induced obesity, causing a Scarb1 isoform switch and alteration of hepatocyte lipid homeostasis. Our findings demonstrate that specific AS programmes actively maintain liver physiology, and underlie the lipotoxic effects of obesogenic diets when dysregulated. Splice-switching oligonucleotides targeting this network alleviate obesity-induced inflammation in the liver and promote an anti-atherogenic lipoprotein profile in the blood, underscoring the potential of isoform-specific RNA therapeutics for treating metabolism-associated diseases.


Conflict of interest statement

C.R.S. is inventor on a patent covering the eiCLIP method that has been filed in the UK (2006803.7) and internationally (PCT/GB2021/051109). The other authors declare no competing interests.

Figures

Fig. 1
Fig. 1. Expression of pre-mRNA splicing machinery is regulated by nutritional inputs in the liver.
a, Schematic representation of experimental design. Livers from male mice fed a HFD or a CD were harvested in fed (ad libitum) or fasted (16 h) state and processed for either high-throughput TMT–MS (isobaric mass tagging) proteomics (n = 3) or RNA-seq analysis (n = 4). b, Principal component analysis for TMT–MS (upper) and RNA-seq (lower) analyses. c, Gene ontology analysis of proteins differentially expressed between fasted versus fed state (upper) and between HFD versus CD livers (lower). d, Analysis of differential AS events between CD fast versus fed (black), HFD versus CD (blue) and HFr versus CD (red). Percentage of events changing within each comparison is represented by pie chart (right) (A3SS, alternative 3' splice site; A5SS, alternative 5' splice site; MXE, mutually exclusive exons; RI, retained intron; SE, skipped exon). eg, Enrichment of eCLIP cross-linking surrounding conserved AS events, differentially regulated in each comparison, in HepG2 cells from ENCODE database. eCLIP binding enrichment: fast versus fed (e), HFD versus CD (f) and HFr versus CD (g). h, Venn diagram showing the splicing factors differentially expressed in HFD versus CD from RNA-seq (yellow) and TMT–MS analyses (blue) and the overlap of splicing factors detected in primary hepatocytes (green).
Fig. 2
Fig. 2. RBFOX2 is a splicing factor expressed in the liver.
a, Liver single-cell analysis of Rbfox2 expression. Boxes show interquartile ranges (IQR) with an horizontal bar representing the median of gene counts from all cells in the respective cluster passing the QC cut-off of 500 genes and 1,000 UMI from ref. . Whiskers represent the upper and lower 1.5× IQR and points denote outliers. Cell numbers per cluster: endothelial cell of hepatic sinusoid (182), hepatocyte (391), B cell (41), natural killer cell (39) and Kupffer cell (61). b, Western blot of LWT and LΔRbfox2 liver lysates showing RBFOX2 expression in male hepatocytes (n = 3). c, Western blot of C57BL6 liver lysates showing RBFOX2 expression in male mice fed a CD, a HFD or a HFr diet (n = 6 per condition, image shows three representative samples). Right, quantification of long/short RBFOX2 variants ratio. d, Expression of RBFOX2 containing full-length RRM motif as quantified by TMT–MS (n = 3). Bar graphs are represented as mean ± s.e.m. Statistical significance was determined by one-way ANOVA and Dunnett’s multiple comparisons test (c) or two-tailed unpaired t-test (d) of biologically independent samples. Source data
Fig. 3
Fig. 3. RBFOX2 controls AS in a cluster of lipid-regulatory genes in the liver.
a, Cartoon depicting the experimental strategy to identify RBFOX2-regulated AS programmes and isoforms for RNA therapeutics. b, RBFOX2 motif enrichment relative to eiCLIP-RBFOX2 cross-linking positions in mouse hepatocytes (n = 3). c, RNA maps showing normalized density of RBFOX2 eiCLIP crosslink sites relative to 5′ and 3′ splice sites (SSs) of selected exons identified by RNA-seq in liver from LWT and LΔRbfox2 mice. d, Gene ontology molecular function analysis of RBFOX2 cross-linked genes in mouse liver visualized with REVIGO. Bubble size corresponds to number of combined gene ontology terms. Colour corresponds to combined score. e, Genome-wide association study of human genes cross-linked by RBFOX2 in hepatocytes. f, Schematic representation of Scarb1 gene showing RBFOX2 eiCLIP peak location surrounding exon 12 (arrow). Semiquantitative PCR plus capillary electrophoresis analysis of Scarb1 exon 12 in liver and quantification of AS in LWT and LΔRbfox2 male mice (bottom). g, Analysis of RBFOX2 regulation of Pla2g6 exon 10, h,i, Numb exon 3 (h) and exon 9 and (i) Osbpl9 exon 6. PSI values are represented as mean ± s.e.m. (n = 6–8). Statistical significance was determined by two-tailed unpaired t-test of biologically independent samples. Source data
Fig. 4
Fig. 4. RBFOX2 controls lipid homeostasis in the liver.
a,b, Plasma lipid analysis showing total cholesterol levels (a) and TG (b) in LWT and LΔRbfox2 male mice fed a CD (n = 8–9) and a HFr diet (n = 18–19). c, PCA plot of liver lipid profiles of LWT and LΔRbfox2 mice fed a CD and a HFr determined by LC–MS. d, LC–MS lipidomic analysis showing total levels of indicated species normalized to tissue mass and PUFA/non-PUFA TG ratio (n = 7–8). e, Cartoon depicting strategy for iPSC-derived human hepatocyte analysis. f, RT–qPCR analysis showing knockdown of RBFOX2 in human hepatocytes (n = 6). gk, Analysis of RBFOX2-mediated regulation of NUMB exon 3 (g), NUMB exon 9 (h), SCARB1 exon 12 (i), SEC31A exon 21 (j) and OSBPL9 exon 6 (k). PSI values are represented as mean ± s.e.m. (n = 4–6). l,m, Lipidomics quantification of the cholesteryl ester (l) and sphingomyelin accumulation (m) on RBFOX2 knockdown in human hepatocytes (n = 5). Results are represented as mean ± s.e.m. Statistical significance was determined by two-tailed unpaired t-test of biologically independent samples. NS, not significant. Source data
Fig. 5
Fig. 5. Viral-mediated over-expression of RBFOX2-Δ6 and RBFOX2 WT in the liver.
a, Cartoon depicting the AAV backbones used to over-express RBFOX2-Δ6 (with a truncated RNA-binding motif RRM) or control green fluorescent protein (GFP) in the liver (top) and representative western blot showing expression levels in the liver of male mice (n = 3). b, RT–qPCR expression analysis of codon-optimized RBFOX2-Δ6 in the liver (n = 6–9). c, Quantification of PSI for Numb (exon 3), Osbpl9 (exon 6), Scarb1 (exon 12) and Sec31a (exon 23) (n = 9–10). d, Cartoon depicting the adenoviral backbones used to over-express RBFOX2 wild type or control GFP (top) and representative western blot showing expression levels in hepatocytes (n = 3). e, Capillary electrophoresis and quantification of PSI for Numb (exon 3), Osbpl9 (exon 6), Scarb1 (exon 12) and Sec31a (exon 23) after RBFOX2 over-expression in hepatocytes (n = 6). f, LC–MS lipidomic analysis showing total levels of free cholesterol, cholesteryl ester, sphingomyelin and ceramide normalized to liver tissue mass and PUFA/non-PUFA TG ratio in male mice fed a HFr diet after transduction with pAd-RBFOX2 or pAd-GFP control (n = 8–9). g, Cholesterol levels quantified in the bile of mice fed a HFr diet after transduction with pAd-RBFOX2 or pAd-GFP control (n = 8–9). h, Plasma lipid analysis showing total cholesterol, HDL cholesterol and TGs in mice fed a HFr diet after transduction with pAd-RBFOX2 or pAd-GFP control (n = 8–9). Results are represented as mean ± s.e.m. Statistical significance was determined by two-tailed unpaired t-test of biologically independent samples. Source data
Fig. 6
Fig. 6. Transcriptional regulation of Rbfox2 in the liver.
a, CAGE-detected transcriptional start site (TSS) signal at the promoters of RBFOX2 transcripts in hepatocytes, aortic smooth muscle and hippocampus. Two transcript isoforms are shown with their respective promoters. Tag clusters are magnified and ChIP–seq signal for FOXA1, FOXA2, H3K4me3 and H3K27ac are shown. b, RT–qPCR of Foxa1, Foxa2 and Rbfox2 in Hepa1-6 cells expressing a scramble shRNA (shC) or shRNA against Foxa1/2 (shF1/2) (n = 5–6). c, Microarray analysis of HepG2 cells with adenoviral FOXA1 over-expression (n = 8) (GSE30447). Results are represented as mean ± s.e.m. Statistical significance was determined by two-tailed unpaired t-test of biologically independent samples. Source data
Fig. 7
Fig. 7. Scarb1 mediates lipidomic changes associated with RBFOX2 deficiency in hepatocytes and can be regulated with splice-switching oligos.
a, Male mice fed a HFr diet were subcutaneously injected with SSO8.3, scramble (Scr) or saline during four consecutive weeks (top). No significant effect of injections on body weight was detected (bottom). b, Semiquantitative PCR analysis of Scarb1 exon 12 inclusion in liver (top) and quantification of overall AS caused represented as PSI (bottom). c, Immunohistochemistry showing decreased macrophage (anti-MRC1) infiltration in the liver of SSO8.3-treated mice. Nuclei were stained with DAPI. Scale bar 10 µm. d, qPCR analysis in the liver of SSO8.3-treated mice (n = 7–9). e,f, LC–MS lipidomic analysis showing total levels of free cholesterol (e) and sphingomyelin (SM) (f) normalized to the tissue weight in mice fed a HFr diet on SSO8.3 injection. g, Quantification of cholesterol and phospholipids in the bile of SSO8.3- and Scr-treated mice. h, Blood analysis of SSO8.3- versus Scr-treated mice showing total cholesterol and TGs. i, Analysis of blood VLDL, LDL and HDL lipoprotein composition. Samples were pooled in three replicates. j, Cartoon depicting the analysis of Dil-HDL uptake in AML12 hepatocytes expressing codon-optimized SR-BI or SR-BII after targeted inactivation of endogenous Scarb1 with a specific siRNA or scramble control (left). Uptake as quantified as Dil-positive cells after 4 h of incubation with 0.1 μg ml−1 Dil-HDL (n = 6). k, Quantification of main lipid species in HDL lipoproteins purified from LΔRbfox2 versus LWT male mice fed a HFr diet and treated with SSO8.3 or Scr control. l, Cholesterol levels quantified in the bile of LΔRbfox2 versus LWT mice treated with SSO8.3 or Scr control as indicated (n = 7–10). Results are represented as mean ± s.e.m. Statistical significance was determined by two-tailed unpaired t-test (ci) or one-way ANOVA and Dunnett’s multiple comparisons test (b, jl) of biologically independent samples. Source data
Extended Data Fig. 1
Extended Data Fig. 1. Splicing factors differentially expressed in specific metabolic conditions in the liver.
A.- Volcano plot showing splicing factor (gold) expression in liver of mice in fed or fasted state as determined by TMT/MS analysis or B.- RNAseq analysis. C.- Splicing factor expression in mice fed a HFD vs CD as determined by TMT/MS analysis and D.- RNAseq analysis. E.- Overlap between AS events differentially regulated in feeding/fasting cycles in mice fed a CD or a HFD. F.- Splicing factor motif enrichment within and around cassette exons alternatively spliced in the liver of mice in fasted vs fed state and G.- in HFD vs. CD. Enrichment in non-AS exons was used as a background (dot lines).
Extended Data Fig. 2
Extended Data Fig. 2. Single-cell RNAseq analysis of RNA binding protein gene expression in the liver.
Liver single-cell RNAseq analysis of the expression of relevant AS factors. Boxes show interquartile ranges (IQR) with a horizontal bar representing the median of gene counts from all cells in the respective cluster passing the QC cut-off of 500 genes and 1000 UMI from. Whiskers represent the upper and lower 1.5 x IQR and points denote outliers. Cell numbers per cluster: Endothelial cell of hepatic sinusoid (182), Hepatocyte (391), B cell (41), Natural killer cell (39) and Kupffer cell (61). Source data
Extended Data Fig. 3
Extended Data Fig. 3. Analysis of RBFOX2-mediated AS regulation in the liver.
A.- NuPAGE gel visualising protein-RNA complexes obtained in eiCLIP in hepatocytes. Lanes 1: No antibody, 2: No UV, 3: 0.2U/ml RNase, 4: 0.1U/ml RNase and 5: size-matched input. Region from which protein-RNA complexes were cut from the membrane is marked by a dashed box (n = 3). B.- eiCLIP analysis confirms RBFOX2 crosslink to Ptbp2 and C.- Snrnp70 pre-mRNA transcripts. D.- Cartoon depicting positional effect on RBFOX2 regulation of AS. E.- Bubble-plot representing significant AS events between LΔRbfox2 and LWT livers. Significant events are represented by pie chart (right) as a percentage of total events. Selected transcripts with eiCLIP RBFOX2-crosslinking peaks are indicated. F.- eiCLIP track showing RBFOX2 crosslink (top) and semi-quantitative PCR showing that RBFOX2 promotes Sec31a exon 23 skipping. PSI values are represented as mean ± s.e.m. (n = 6-8). Statistical significance was determined by two-sided t-test of biologically independent samples. G.- RBFOX2 crosslink in human hepatocyte samples to PLA2G6, H.- SEC31A, I.- NUMB and J.- SCARB1 pre-mRNA transcripts. Source data
Extended Data Fig. 4
Extended Data Fig. 4. RBFOX2 is involved in the regulation of cholesterol homeostasis.
A.- Body-weight gain over time of LWT and LΔRbfox2 animals fed a CD, (B.-) a HFD and (C.-) a HFr diet. D.- Glucose tolerance test of LWT and LΔRbfox2 fed a CD, (E.-) a HFD and (F.-) a HFr diet. G.- Blood analysis of LΔRbfox2 vs. LWT female mice showing cholesterol levels, and H.- triglycerides. I.- H&E staining of liver from LΔRbfox2 vs. LWT mice fed a HFr diet. Scale bar 50 µm. J-M.- LC-MS/MS analysis of the specified lipids in the liver of LΔRbfox2 vs. LWT mice fed a HFD. N.- Blood cholesterol and triglyceride levels in LΔRbfox2 vs. LWT mice fed a HFD. Results are represented as mean ± SEM (n = 8-9). Statistical significance was determined by two-way ANOVA with Sidak’s multiple correction test (A-F) or by two-tailed unpaired t-test (G-N) of biologically independent samples. Source data
Extended Data Fig. 5
Extended Data Fig. 5. RBFOX2 regulates lipid metabolism in human hepatocytes.
A.- RT-qPCR analysis of ASGPR2, SERPINA1 and SERPINA2 in human hepatocytes upon RBFOX2 targeted knockdown (n = 6) B.- PCA plot of lipidomic analysis of human hepatocytes upon RBFOX2 targeted knockdown as determined by LC-MS. (n = 5). C.- RT-qPCR analysis of genes involved in cholesterol and bile acid homeostasis, in the liver of LΔRbfox2 and LWT mice fed a HFr diet (n = 18-20). D.- Representative western-blot showing APOB and ABCA1 expression in the liver of LΔRbfox2 vs. LWT mice (n = 5). E-K.- Bile acids levels in the liver of LΔRbfox2 vs. LWT mice fed a HFr diet or (L-U) a HFD diet as determined by LC-MS/MS. Samples were normalised by tissue weight and internal standard (n = 8). Results are represented as mean ± s.e.m.; Statistical significance was determined by one-way ANOVA with Tukey’s multiple comparisons test (A) or two-tailed unpaired t-test (C-U) of biologically independent samples. Source data
Extended Data Fig. 6
Extended Data Fig. 6. Quantification of AS of direct RBFOX2 targets in mice fed a CD, a HFD or a HFr diet.
A.- Quantification of percentage splice in (PSI) for Pla2g6 (exon 10), (B.-) Scarb1 (exon 12), (C.-) Numb (exon 3), (D.-) Numb (exon 9), (E.-) Sec31a (exon 23) and (F.-) Osbpl9 (exon 6) in LWT and LΔRbfox2 mice fed a CD, a HFD or a HFr diet (n = 7-10). G.- Representative western-blot showing RBFOX2 expression levels in the liver of mice after transduction with pAd-RBFOX2 or pAd-GFP control (left) and quantification by PCR/capillary electrophoresis of percentage splice in (PSI) for Scarb1 (exon 12) (right) (n = 7-9). H.-ChIP-seq signal for FOXA1 in mouse Rbfox2 promoter in liver. I.- Volcano-plot showing LC-MS lipidomic analysis of LΔRbfox2 vs LWT hepatocytes normalised to internal standard and total cell counts (n = 5-6). J.- PCA plot of LΔRbfox2 vs. LWT hepatocytes and relevant SSO treatment as determined by LC-MS lipidomic analysis. Results are represented as mean ± s.e.m. Statistical significance was determined by two-way ANOVA with Tukey’s multiple comparisons test (A-F) or two-tailed unpaired t-test (G) of biologically independent samples. Source data
Extended Data Fig. 7
Extended Data Fig. 7. Role of RBFOX2-downstream targets in lipid metabolism in hepatocytes.
A.- Capillary electrophoresis and quantification of percentage splice in (PSI) for Numb (exon 9), in LWT and LΔRbfox2 hepatocytes upon treatment with SSO7.8 or Scr control. B.- Heatmap showing LC-MS metabolomic analysis of LWT and LΔRbfox2 hepatocytes treated with SSO7.8 or Scr. C.- Capillary electrophoresis and quantification of percentage splice in (PSI) for Sec31a (exon 23), in LWT and LΔRbfox2 hepatocytes upon treatment with SSO6.2 or Scr control. D.- Heatmap showing LC-MS metabolomic analysis of LWT and LΔRbfox2 hepatocytes treated with SSO6.2 or Scr. Results are represented as mean ± s.e.m. Statistical significance was determined by one-way ANOVA with Tukey’s multiple comparisons test of biologically independent samples (n = 5-6). Source data
Extended Data Fig. 8
Extended Data Fig. 8. Role of Osbpl9 and Pla2g6 isoforms in lipid metabolism.
A.- Capillary electrophoresis and quantification of percentage splice in (PSI) for Osbpl9 (exon 6), in LWT and LΔRbfox2 hepatocytes upon treatment with SSO11.1 or Scr control. Statistical significance was determined by one-way ANOVA with Tukey’s multiple comparisons test of biologically independent samples (n = 5-6). B.- Heatmap showing LC-MS metabolomic analysis of LWT and LΔRbfox2 hepatocytes treated with SSO11.1 or Scr. C.- Western blot showing PLA2G6 expression in wild type and RBFOX2-deficient hepatocytes (top). Cryo-EM maps of PLA2G6 dimers showing tight interaction of the catalytic domains (orange) of each monomer with ankyrin repeats (purple) oriented outward from the core. Ankyrin repeats face ‘claw-like’ towards membrane phospholipids. Insert: 90-degree rotation of the structure detailing the region corresponding to exon 10 of Pla2g6L, a 55-amino intrinsically disordered proline-rich region at the interface of the ankyrin repeats and the catalytic domain. D.- Diagram showing design of splice-switching oligos targeting Pla2g6 alternative splicing at exon 10. SSO5.1 is designed to promote exon skipping (top) as validated by semi-quantitative PCR analysis (bottom). E.- Quantification of the effect of SSO5.1 on the described lipid species as determined by LC-MS normalised to internal standard and total cell counts. Results are represented as mean ± s.e.m. (n = 5-6). Statistical significance was determined by two-sided unpaired t-test of biologically independent samples. Source data
Extended Data Fig. 9
Extended Data Fig. 9. Role of Scarb1 splicing variants in lipid metabolism.
A.- Splice-switching oligonucleotide (SSO8.3) promotes skipping of Scarb1 exon 12 in primary hepatocytes as determined by semi-quantitative PCR analysis (n = 3-4). B.- Volcano-plot showing LC-MS lipidomic analysis of LΔRbfox2 hepatocytes treated with 100 nM SSO8.3 or Scr for 16 h (n = 5-6). C.- Metabolomics analysis showing levels of total ceramide, D.- PUFA/non-PUFA TG ratio, E.- total sphingomyelin, and F.- total triglycerides (n = 5-6). G-I.- Heatmap showing LC-MS metabolomic analysis of LWT and LΔRbfox2 hepatocytes treated with SSO8.3 or Scr. Intensities were normalised to internal standard and total cell counts. J.- Western-blot showing SR-BI/II levels in the liver after SSO8.3 treatment (n = 2). K.- RT-qPCR expression analysis in liver of mice treated with SSO8.3 or Scr of potential off-targets genes such as Dscc1, (L.-) Kcnj16 and (M.-) Rab10. N.- Effect of SSO8.3 injection on circulating ALT and O.- AST levels. P.- Liver/body weight ratio upon SSO8.3 injection (n = 7-10). Results are represented as mean ± s.e.m. Statistical significance was determined by one-way ANOVA or two-sided unpaired t-test of biologically independent samples. Source data
Extended Data Fig. 10
Extended Data Fig. 10. In vivo treatment with SSO8.3 promotes lipoprotein remodelling.
A.- Quantification of major lipid species in purified VLDL, B.- LDL and C.- HDL lipoproteins from mice fed a HFr diet and treated with SSO8.3 or Scr control. Samples were pooled in three replicates. Results are represented as mean ± SEM; Statistical significance was determined by unpaired t-test corrected for multiple comparisons using the Holm-Sidak method. D.- Representative western blot analysis of lipogenic proteins in liver of LWT and LΔRbfox2 mice treated with SSO8.3 or Scr (n = 9-10). E.- Quantification of liver triglyceride content normalised to liver weight in mice injected with SSO8.3 or Scr control (n = 8-9). F.- RT-qPCR expression analysis of endogenous Scarb1 gene knockdown in AML12 hepatocytes treated with siRNA to Scarb1 or Scr control (n = 3-6). Results are represented as mean ± SEM. Statistical significance was determined by one-way ANOVA and Dunnett’s multiple comparisons test of biologically independent samples. G.- Absolute RT-qPCR expression analysis of codon-optimised Scarb1 isoforms in AML12 cells (n = 3-6). H.- Capillary electrophoresis and quantification of percentage splice in (PSI) for Scarb1 (exon 12) in LWT and LΔRbfox2 liver upon treatment with SSO8.3 or Scr control (top) and western-blot analysis of protein levels (bottom) (n = 8-9). I.- Quantification of liver triglyceride content normalised to liver weight in LWT and LΔRbfox2 mice upon treatment with SSO8.3 or Scr control (n = 9-10). J.- Total blood cholesterol level in LΔRbfox2 vs. LWT mice fed a HFr diet and treated with SSO8.3 or Scr control as indicated (n = 11-15). K.- Quantification of major lipid species in purified LDL and (L) VLDL lipoproteins (n = 9-13). Results in H-L are represented as mean ± s.e.m. Statistical significance was determined by one-way ANOVA and Dunnett’s multiple comparisons test of biologically independent samples. Source data

References

    1. Pan Q, Shai O, Lee LJ, Frey BJ, Blencowe BJ. Deep surveying of alternative splicing complexity in the human transcriptome by high-throughput sequencing. Nat. Genet. 2008;40:1413–1415. doi: 10.1038/ng.259. - DOI - PubMed
    1. Wang ET, et al. Alternative isoform regulation in human tissue transcriptomes. Nature. 2008;456:470–476. doi: 10.1038/nature07509. - DOI - PMC - PubMed
    1. Blencowe BJ. Reflections for the 20th anniversary issue of RNA journal. RNA. 2015;21:573–575. doi: 10.1261/rna.051003.115. - DOI - PMC - PubMed
    1. Buljan M, et al. Tissue-specific splicing of disordered segments that embed binding motifs rewires protein interaction networks. Mol. Cell. 2012;46:871–883. doi: 10.1016/j.molcel.2012.05.039. - DOI - PMC - PubMed
    1. Ellis JD, et al. Tissue-specific alternative splicing remodels protein-protein interaction networks. Mol. Cell. 2012;46:884–892. doi: 10.1016/j.molcel.2012.05.037. - DOI - PubMed

Publication types