. 2022 Dec;4(12):1792-1811.
doi: 10.1038/s42255-022-00706-6. Epub 2022 Dec 19.

mTORC1 regulates a lysosome-dependent adaptive shift in intracellular lipid species

Affiliations

mTORC1 regulates a lysosome-dependent adaptive shift in intracellular lipid species

Aaron M Hosios et al. Nat Metab. 2022 Dec.

Abstract

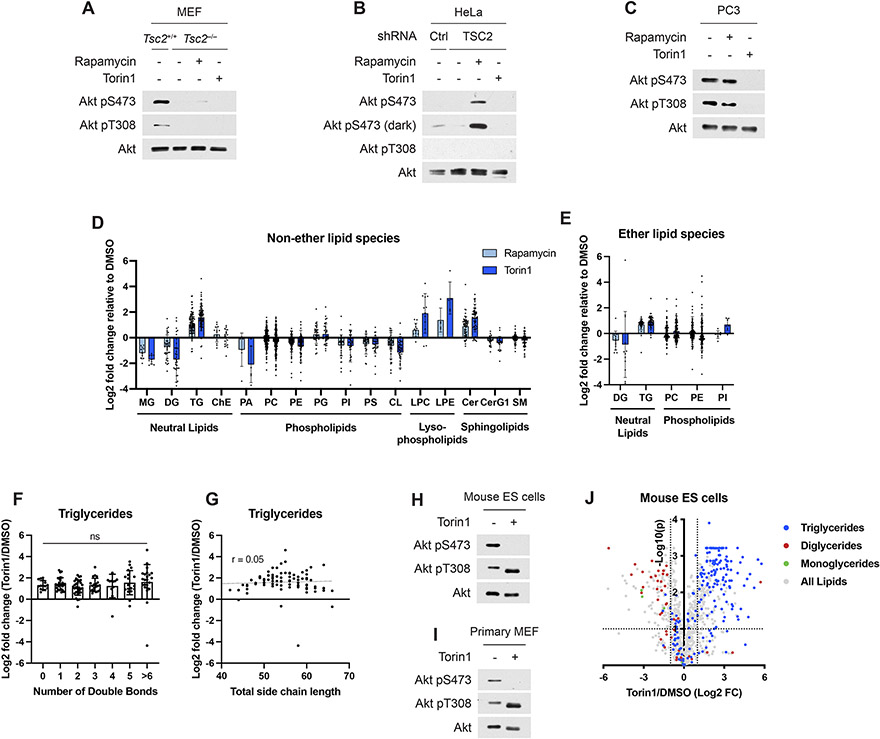
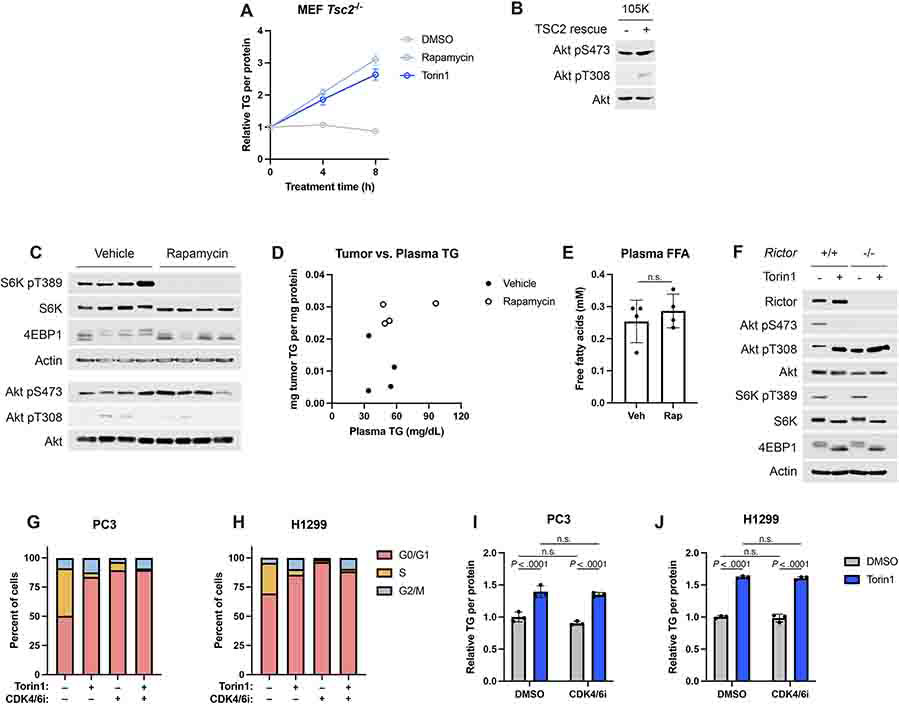
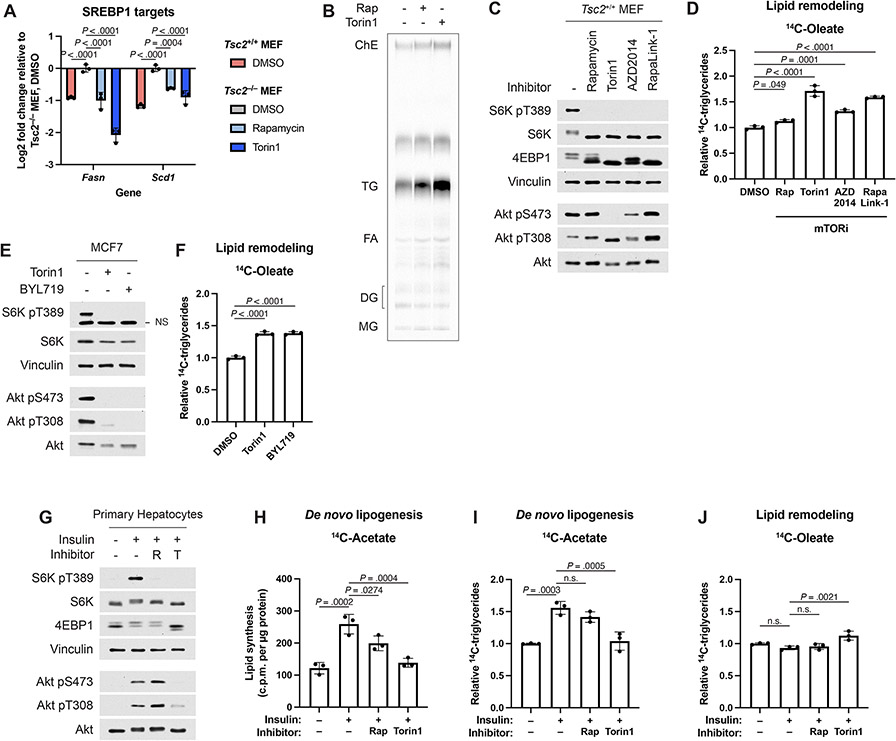
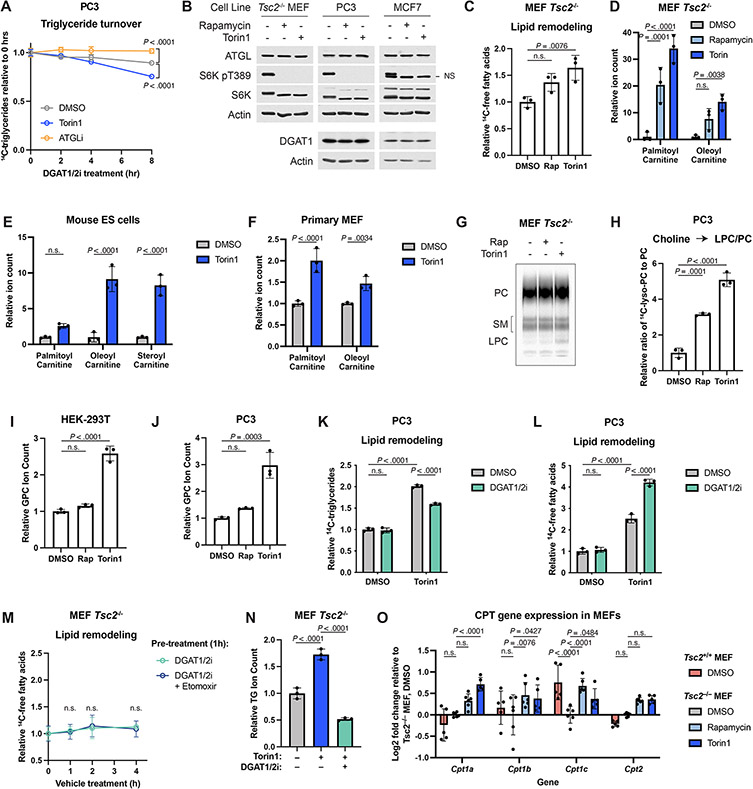
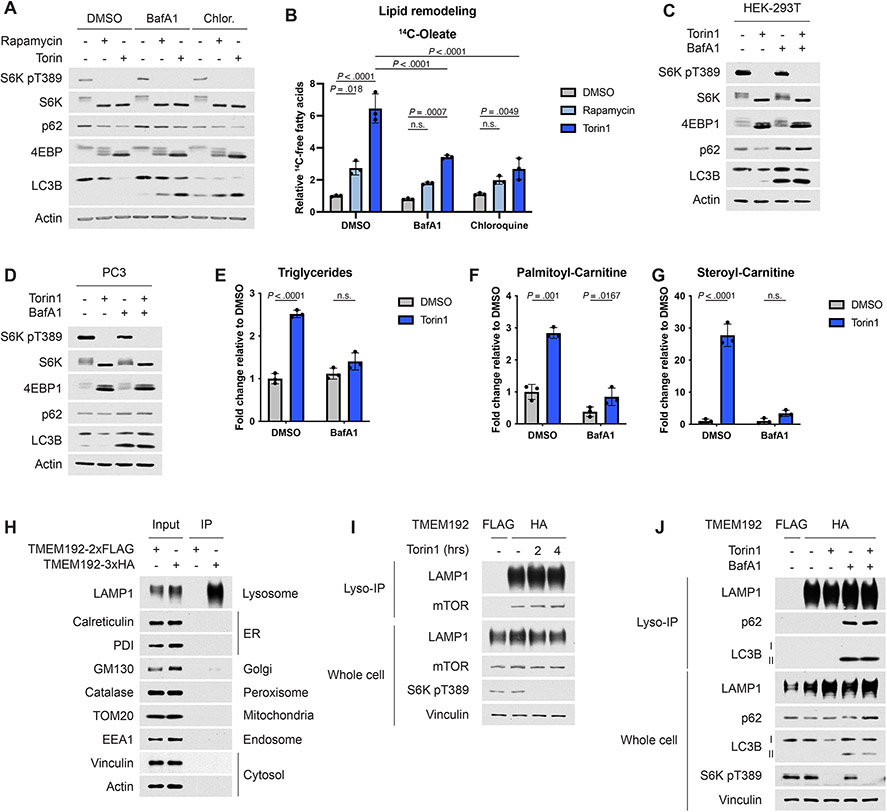
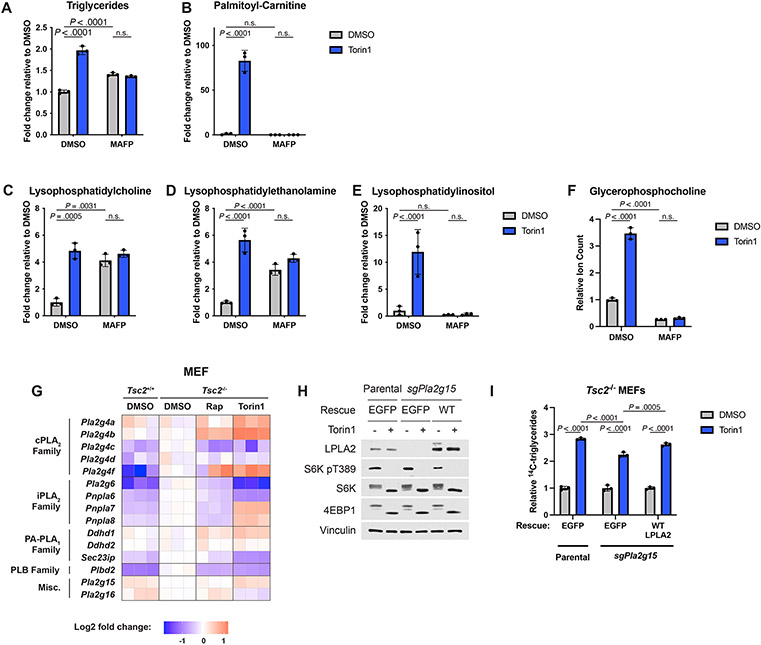
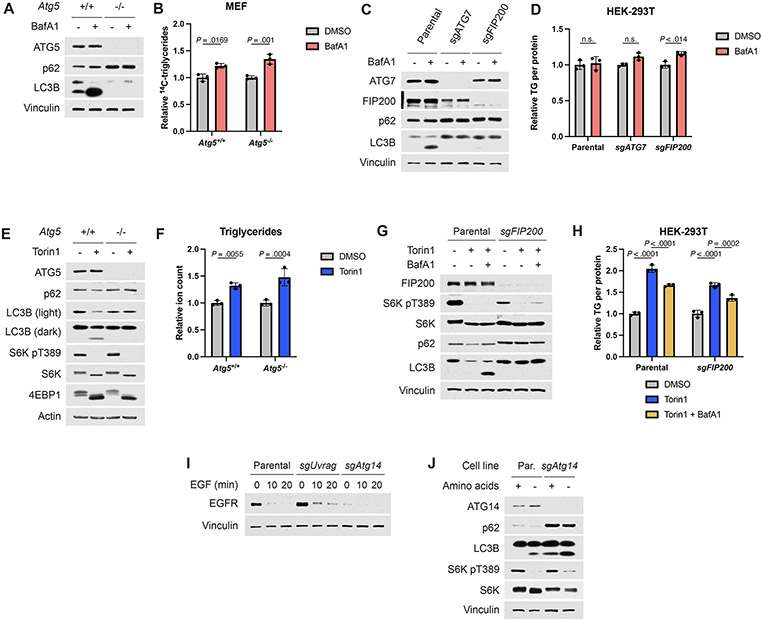
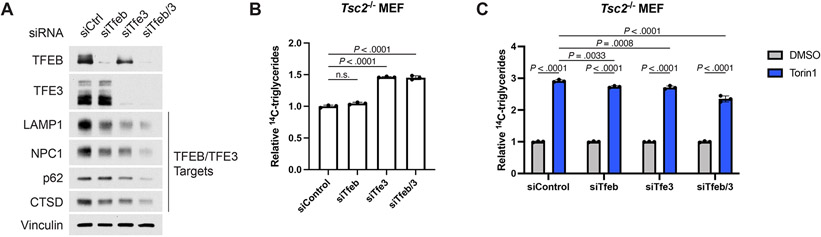
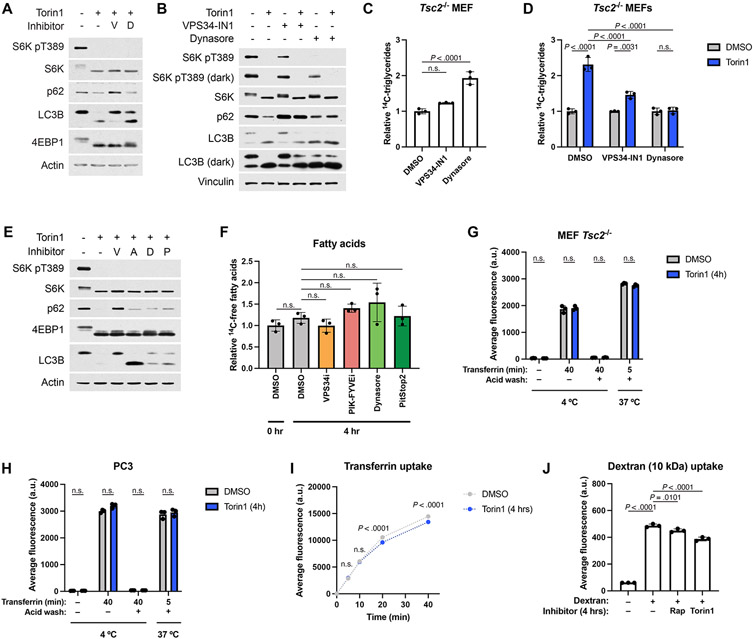
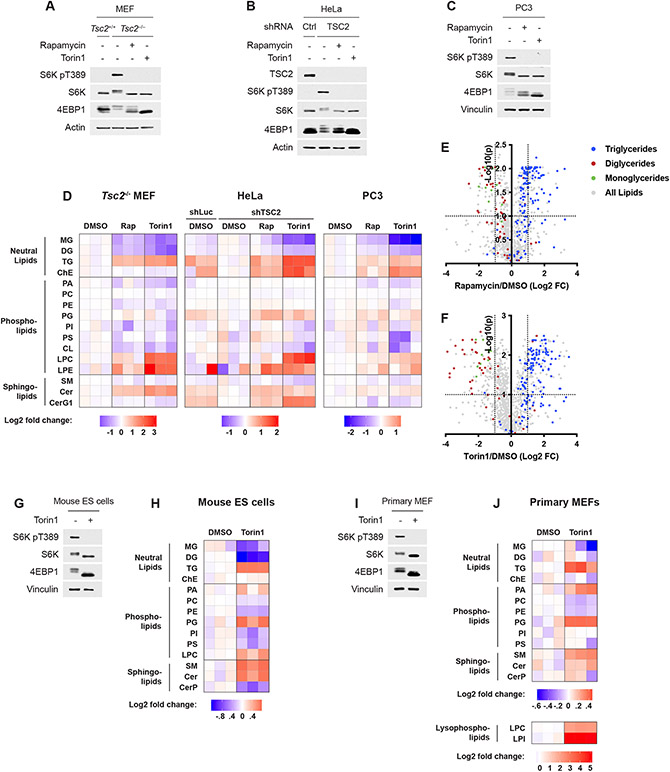
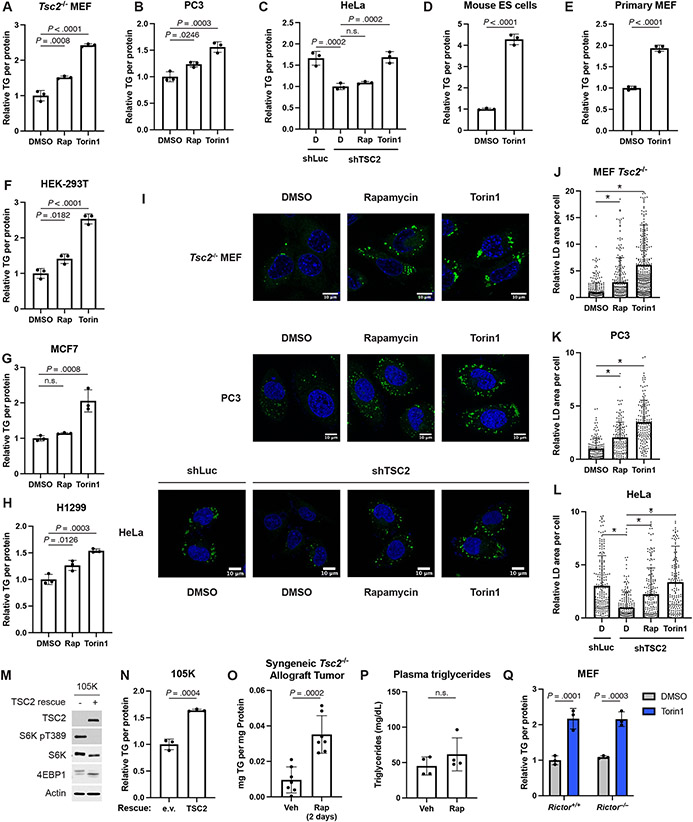
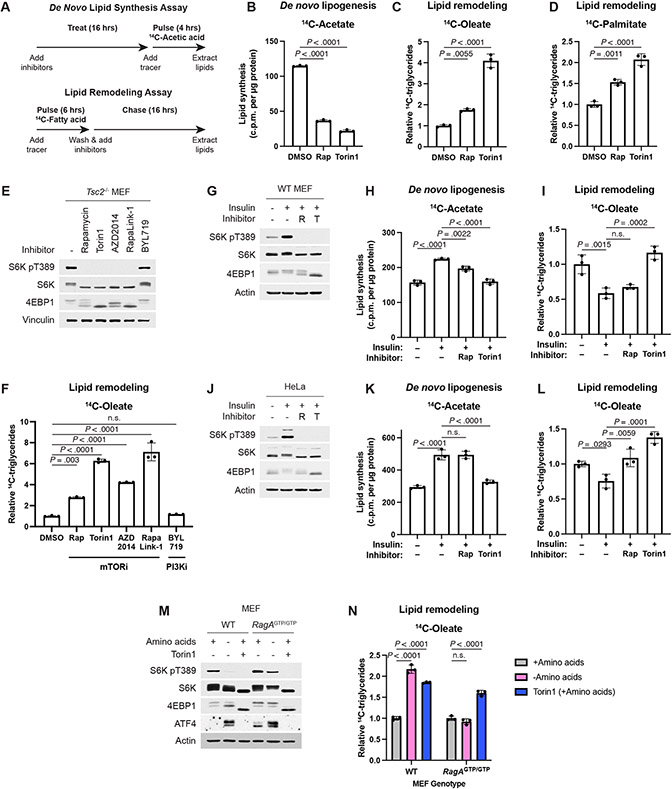
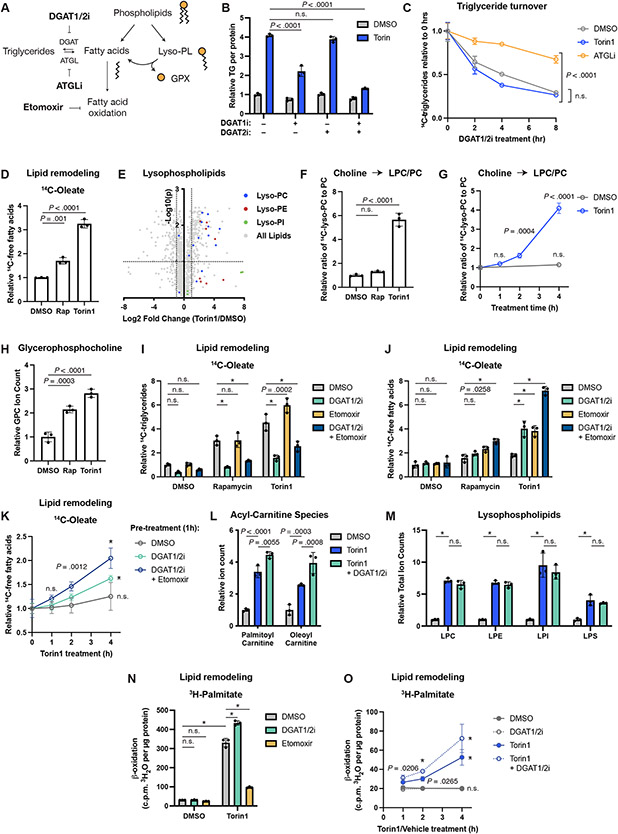
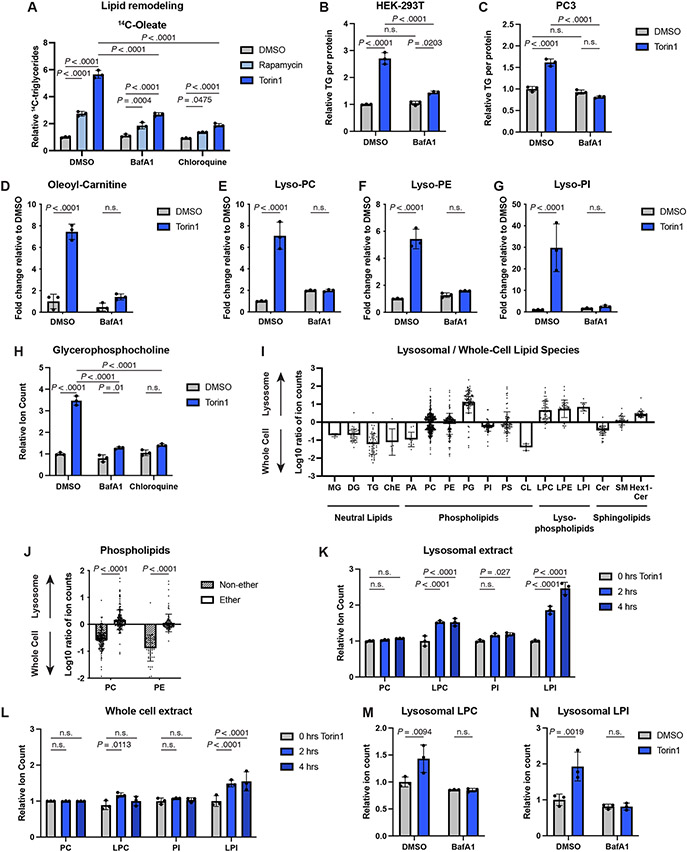
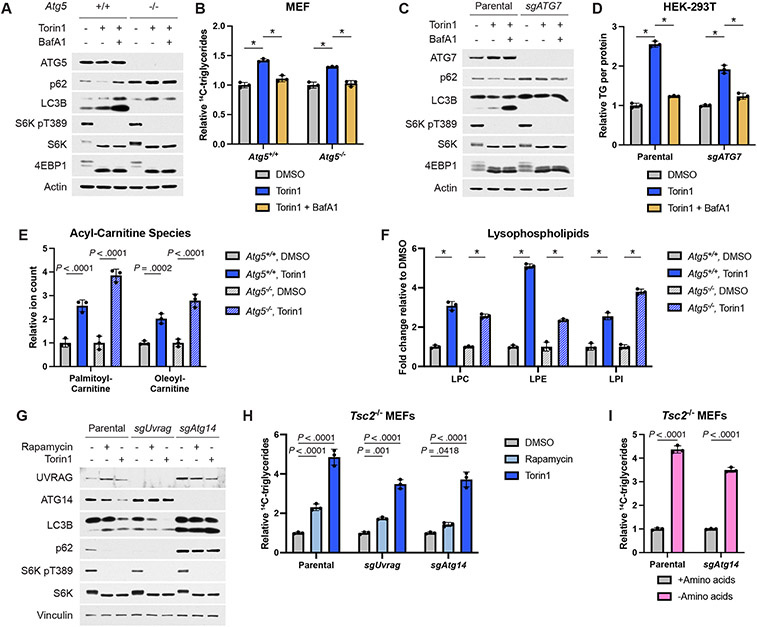
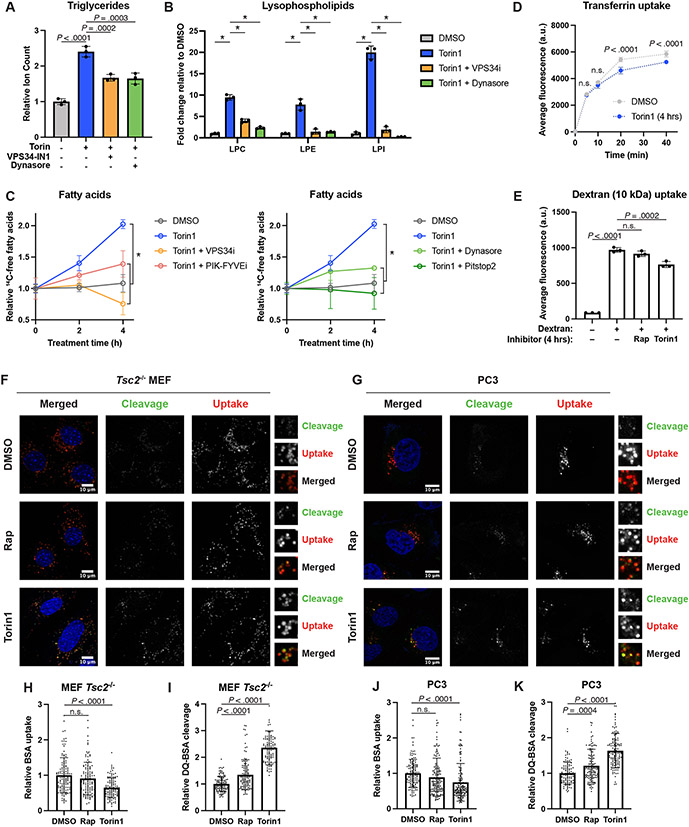
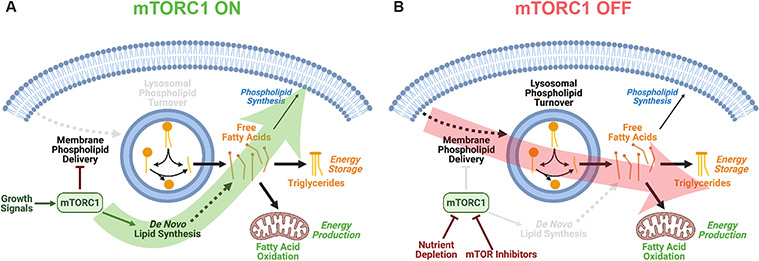
The mechanistic target of rapamycin complex 1 (mTORC1) senses and relays environmental signals from growth factors and nutrients to metabolic networks and adaptive cellular systems to control the synthesis and breakdown of macromolecules; however, beyond inducing de novo lipid synthesis, the role of mTORC1 in controlling cellular lipid content remains poorly understood. Here we show that inhibition of mTORC1 via small molecule inhibitors or nutrient deprivation leads to the accumulation of intracellular triglycerides in both cultured cells and a mouse tumor model. The elevated triglyceride pool following mTORC1 inhibition stems from the lysosome-dependent, but autophagy-independent, hydrolysis of phospholipid fatty acids. The liberated fatty acids are available for either triglyceride synthesis or β-oxidation. Distinct from the established role of mTORC1 activation in promoting de novo lipid synthesis, our data indicate that mTORC1 inhibition triggers membrane phospholipid trafficking to the lysosome for catabolism and an adaptive shift in the use of constituent fatty acids for storage or energy production.


Conflict of interest statement

Declaration of interests

B.D.M. is a member of the scientific advisory board and a shareholder of Navitor Pharmaceuticals. All other authors declare no competing financial interests.

Figures

Extended Data Fig. 1
(A-C) Immunoblots for AKT and pAKT corresponding to Figures 1A-C. (D,E) Fold changes of individual lipids grouped by class from the lipidomics experiment shown in Figure 1D. (D) Non-ether and (E) ether lipids are separated. Dots represent the fold change of each individual lipid species relative its abundance in vehicle-treated cells. Bars represent the mean fold change for that class, graphed ± SD for n=3 replicates. (F,G) Triglyceride species from the results in Figure 1C stratified by the total number of double bonds (F) or carbon atoms (G) in their side chains. Each point represents an individual triglyceride. Group mean ± SD is shown in (F). Pearson’s r and line of best fit are shown in (G). Data represent n=3 replicates. (H,I) Immunoblots for AKT and pAKT corresponding to Figures 1G-J. (J) Changes in the abundance of individual lipid species from the experiment in Figure 1H, with neutral lipids color coded, for mouse ES cells treated with torin1. Dotted lines indicate a 2-fold change (FC) and an adjusted p-value of 0.1. Statistical analysis by one-way ANOVA (F); n.s., not significant.
Extended Data Fig. 2
(A) Triglyceride accumulation measured by enzyme assay and normalized to protein content from the same sample in Tsc2−/− MEFs serum starved for 16 hrs, followed by 0-8 hrs of vehicle, rapamycin (20 nM), or torin1 (250 nM) treatment, graphed as mean ± SD relative to the 0 hr timepoint, n=3. (B) Immunoblot for AKT and pAKT corresponding to Figure 2M. (C) Immunoblot for the tumors shown in Figure 2O. (D) Tumor TG versus plasma TG for individual mice shown in Figures 2O,P. (E) Plasma non-esterified fatty acids (NEFA) measured for the mice shown in Figure 2O, graphed as mean ± SD, n=5 mice. (F) Immunoblot corresponding to the experiment shown in Figure 2Q. (G,H) Cell cycle profile for PC3 (G) and H1299 (H) cells treated for 16 hrs with vehicle, palbociclib (CDK4/6i, 100 nM), and/or torin1 (250 nM), n=1. (I,J) Triglyceride levels quantified by enzyme assay and normalized to protein content from the same sample for cells treated as in (G,H), graphed as mean ± SD relative to vehicle-treated cells, n=3. Statistical analysis by two-way ANOVA (I,J) and two-tailed Student’s t-test (E); n.s., not significant.
Extended Data Fig. 3
(A) SREBP1 target gene expression in Tsc2+/+ and Tsc2−/− MEFs treated for 16 hrs with vehicle, rapamycin (20 nM), or torin1 (250 nM), graphed as mean ± SD relative to vehicle-treated cells, n=3. (B) Representative thin layer chromatogram for Tsc2−/− MEFs labeled with [1-14C]-oleate and treated with vehicle, rapamycin (20 nM), or torin1 (250 nM) for 16 hrs, developed to separate neutral lipids. ChE, cholesteryl-esters; TG, triglycerides; FA, fatty acids; DG, diglycerides; MG, monoglycerides. (C,D) Immunoblot (C) and TGs (D) assayed by pulse-chase with [1-14C]-oleate tracer (6 h) in Tsc2+/+ MEFs followed by chase in cold medium for 16 h with vehicle, 20 nM rapamycin, 250 nM torin1, 500 nM AZD2014, or 5 nM RapaLink-1, graphed as mean ± SD relative to vehicle-treated cells, n=3. (E,F) Immunoblot (E) and TGs (F) assayed by pulse-chase with [1-14C]-oleate tracer (6 h) in MCF7 cells followed by chase in cold medium for 16 h with vehicle, 250 nM torin1, or 1 μM BYL719 treatment, graphed as mean ± SD relative to vehicle-treated cells, n=3. NS denotes a non-specific band. (G-J) Immunoblot (G), de novo lipogenesis of all lipids (H), TG labeled from de novo lipogenesis (I), and lipid remodeling (J), assayed as in Figures 3H,I in primary mouse hepatocytes serum starved for 16 hrs, pretreated for 30 min with vehicle, rapamycin (20 nM), or torin1 (250 nM), and stimulated with insulin (100 nM) for 6 hrs, graphed as mean ± SD relative to vehicle-treated unstimulated cells, n=3. Statistical analysis by one-way ANOVA (A,D,F,H-J); n.s., not significant.
Extended Data Fig. 4
(A) 14C-TG turnover in PC3 cells treated with vehicle, torin1, or ATGLi, measured as in Figure 4C. 14C-TG abundance is graphed over time as mean ± SD relative to 0 hrs, n=3. (B) Immunoblots for ATGL and DGAT1 levels from two separate experiments in cell lines treated with vehicle, rapamycin, or torin1 for 16 hrs. NS denotes a non-specific band. (C) 14C-Fatty acid levels in Tsc2−/− MEFs labeled with [1-14C]-palmitate, treated with vehicle, rapamycin, or torin1 for 16 hrs, graphed as mean ± SD relative to vehicle, n=3. (D) Acyl-carnitine species in Tsc2−/− MEFs in the experiment in Figure 1D, graphed as mean ± SD relative to vehicle, n=3. (E,F) Acyl-carnitine species detected in mouse embryonic stem (ES) cells (E) and wild type, primary MEFs (F) in the experiments in Figures 1H,J, graphed as mean ± SD relative to vehicle, n=3. (G) Representative thin layer chromatogram for Tsc2−/− MEFs traced with [methyl-14C]-choline and treated with vehicle, rapamycin, or torin1 for 16 hrs, developed to separate phospholipids. PC, phosphatidylcholine; SM, sphingomyelin; LPC, lysophosphatidylcholine. (H) Ratio of lysophosphatidylcholine to phosphatidylcholine in PC3 cells pulse-labeled with [methyl-14C]-choline as in (G); mean ± SD relative to vehicle, n=3. (I,J) Glycerophosphocholine levels in HEK-293T (I) and PC3 (J) cells treated for 16 hrs with vehicle, rapamycin, or torin1, graphed as mean ± SD relative to vehicle, n=3. (K,L) 14C-TG (K) and 14C-fatty acids (L) in PC3 cells measured as in Figures 4I,J and graphed as mean ± SD, n=3. (M) Fatty acid accumulation in Tsc2−/− MEFs labeled with [1-14C]-oleate following vehicle (DMSO) treatment with 1 hr pre-treatment with DGAT inhibitors and/or etomoxir; mean ± SD relative to 0 hrs, n=3. (N) Triglyceride ion counts in the experiment shown in Figures 4L,M; mean ± SD relative to vehicle, n=3. (O) Carnitine palmitoyl-transferase (CPT) gene expression in MEFs treated for 16 hrs with inhibitors, graphed as mean ± SD relative to vehicle, n=6. Statistics: by one-way ANOVA (C,H-J,N), two-way ANOVA (D-F,K-M,O), and extra sum-of-squares F-test (A). n.s., not significant.
Extended Data Fig. 5
(A,B) Immunoblot (A) and fatty acids (B) corresponding from the experiment shown in Figure 5A. Fatty acids quantification is graphed as mean ± SD relative to vehicle-treated cells, n=3. (C,D) Immunoblots corresponding to the experiments shown in Figures 5B,C. (E-G) Triglyceride and acyl-carnitine levels from the experiment shown in Figures 5D-G. (H) Immunoblot for organelle markers in whole cell lysates or in HA-tag immunopurified lysosomes (IP) from HEK-293T cells expressing TMEM192-2xFLAG or 3xHA. (I) Immunoblot corresponding to the experiment shown in Figures 5K,L. (J) Immunoblot corresponding to the experiment shown in Figures 5M,N. LC3B is indicated in its unmodified (LC3B-I) and lipidated (LC3B-II) forms. Statistical analysis by two-way ANOVA (B,E-G). n.s., not significant.
Extended Data Fig. 6
(A-F) Lipid class sums (A-E) and glycerophosphocholine levels (F) detected in Tsc2−/− MEFs treated with vehicle, MAFP (a non-specific serine hydrolase inhibitor, 10 μM), and/or torin1 (250 nM) for 16 hrs, graphed as mean ± SD relative to vehicle-treated cells, n=3. (G) Phospholipase A1 (PLA1) and A2 (PLA2) gene expression in Tsc2+/+ and Tsc2−/− MEFs treated for 16 hrs with vehicle, rapamycin (20 nM), or torin1 (250 nM), calculated relative to vehicle-treated Tsc2−/− MEFs, n=3. cPLA2, cytosolic PLA2; iPLA2, calcium-independent PLA2; PA-PLA1, phosphatidic acid-preferring PLA1; PLB, phospholipase B. (H,I) Immunoblot (H) and TGs measured by pulse-chase with [1-14C]-oleate tracer (I) in parental and Pla2g15 knockout Tsc2−/− MEFs expressing enhanced green fluorescent protein (EGFP) or wildtype LPLA2 (PLA2G15) treated for 16 hrs with vehicle or torin1 (250 nM), graphed as mean ± SD relative to vehicle-treated cells, n=3. Statistical analysis by two-way ANOVA (A-F,I). n.s., not significant.
Extended Data Fig. 7
(A,B) Immunoblot (A) and TGs measured by pulse-chase with [1-14C]-oleate tracer (B) in Atg5+/+ and −/− MEFs treated for 16 hrs with vehicle or BafA1 (250 nM), graphed as mean ± SD relative to vehicle-treated cells, n=3. (C,D) Immunoblot (C) and triglyceride levels measured by enzyme assay (D) and normalized to protein content from the same sample for parental, ATG7 knockout, and FIP200 knockout HEK-293T cells treated with vehicle or bafilomycin A1 (250 nM) for 16 hrs, graphed as mean ± SD relative to vehicle-treated cells, n=3. (E,F) Immunoblot (E) and triglyceride levels (F) corresponding to the results shown in Figures 6E,F. Triglyceride levels are graphed as mean ± SD relative to vehicle-treated cells, n=3. (G,H) Immunoblot (G) and triglyceride levels measured by enzyme assay (H) and normalized to protein content from the same sample for parental and FIP200 knockout HEK-293T cells treated with vehicle, torin1 (250 nM), and/or bafilomycin A1 (250 nM) for 16 hrs, graphed as mean ± SD relative to vehicle-treated cells, n=3. (I) EGFR degradation assay in parental Tsc2−/− MEFs and sgUvrag or sgAtg14 clones. Cells were serum starved for 16 hrs and stimulated with EGF (10 ng/mL) for the indicated times. (J) Immunoblot for autophagy markers in parental Tsc2−/− MEFs and sgAtg14 clone after 4 hrs in amino acid replete or free medium. Statistical analysis by two-way ANOVA (B,D,F,H). n.s., not significant.
Extended Data Fig. 8
(A) Immunoblot for TFEB, TFE3, and proteins corresponding to their transcriptional target genes in Tsc2−/− MEFs treated for two days with control siRNA, siTfeb, or siTfe3. (B,C) 14C-TGs assayed by pulse-chase with [1-14C]-oleate tracer (6 h) in Tsc2−/− MEFs treated as in (A) followed by chase in cold medium for 16 hrs with vehicle or 250 nM torin1, graphed as mean ± SD relative to control siRNA-treated cells (B) and relative to vehicle-treated cells (C), n=3. Statistical analysis by one-way ANOVA (B) and two-way ANOVA (C). n.s., not significant.
Extended Data Fig. 9
(A) Immunoblot corresponding to the experiment shown in Figures 7A,B. (B-D) Immunoblots (B) and 14C-TGs (C,D) assayed by pulse-chase with [1-14C]-oleate tracer (6 h) in Tsc2−/− MEFs followed by chase in cold medium for 16 hrs with vehicle, 250 nM torin1, 5 μM VPS34-IN1, or 80 μM Dynasore, graphed as mean ± SD relative to vehicle-treated cells (C) and relative to no-torin1 controls (D), n=3. (E) Immunoblot corresponding to the experiment shown in Figure 7C. (F) Fatty acid accumulation measured by pulse-chase with [1-14C]-oleate tracer in the presence of DGAT inhibitors (3 μM each) and etomoxir (20 μM) in Tsc2−/− MEFs following a 4 hr treatment with endocytosis inhibitors (5 μM VPS34-IN1, 1 μM PIK-FYVEi, 80 μM Dynasore, or 20 μM PitStop 2). Graphed as mean ± SD relative to vehicle-treated cells at time 0, n=3. (G,H) Binding of transferrin to Tsc2−/− MEFs (G) and PC3 (H) cells treated for 4 hrs with vehicle or torin1 (250 nM) and kept on ice while labeling with transferrin, confirming that the amount of plasma membrane transferrin receptor is not regulated by mTOR and that surface-bound transferrin is eliminated following an acid wash. Graphed as mean ± SD, n=3. (I,J) Endocytosis assays in PC3 cells, measuring the uptake of transferrin (I) or 10 kDa dextran (J), following 4 hrs of vehicle, rapamycin (20 nM), or torin1 (250 nM) treatment, graphed as mean ± SD, n=3. a.u., Arbitrary Units. Statistical analysis by one-way ANOVA (C,F,J), and two-way ANOVA (D,G-I). n.s., not significant.
Extended Data Fig. 10
(A) BSA uptake in Tsc2−/− MEFs treated with torin1 (250 nM) and vehicle or EIPA (20 μM) for 1 hr prior to labeling with 10 μg/mL BSA Alexa Fluor 647 (uptake, red) for 3 hrs. Nuclei are shown in blue. (B) BSA cleavage in Tsc2−/− MEFs treated with torin1 (250 nM) and vehicle or protease inhibitors (2 μM E64d, 2 μM Pepstatin A, and 10 μM Leupeptin) for 1 hr prior to labeling with 10 μg/mL each of BSA Alexa Fluor 647 (red, uptake) and DG-Green BSA (green, cleavage) for 3 hrs. Nuclei are shown in blue. (C,D) Quantification of the effect of EIPA on BSA uptake (C) and protease inhibitors on BSA cleavage (D) for cells treated as in (A,B), graphed as mean ± SD relative to vehicle-treated cells, n=57-84 cells. (E) Co-localization of hydrolyzed DQ-Green BSA (green) and LysoTracker Deep Red (red) in Tsc2−/− MEFs pre-treated with torin1 (250 nM) for 1 hr prior to labeling with 10 μg/mL DQ-Green BSA for 3 hrs. Nuclei are shown in blue. These images are representative of two replicate experiments in which similar results were obtained.
Figure 1:
Figure 1:. Lipidomic analysis of cells treated with mTORC1 inhibitors.
(A-C) Immunoblots for Tsc2−/− MEFs (A), HeLa cells expressing shRNAs targeting luciferase (shLuc) or TSC2 (B), and PC3 cells (C) treated with vehicle (DMSO), rapamycin (20 nM), or torin1 (250 nM) for 16 h. (D) Relative lipid class abundance determined by mass spectrometry lipidomics from cells treated in (A-C). Class abundance, determined from the summed ion counts of all lipids in that class, are shown normalized to vehicle-treated controls. MG, monoglyceride; DG, diglyceride; TG, triglyceride; ChE, cholesteryl ester; PA, phosphatidic acid; PC, phosphatidylcholine; PE, phosphatidylethanolamine; PG, phosphatidylglycerol; PI, phosphatidylinositol; PS, phosphatidylserine; CL, cardiolipin; LPC, lysophosphatidylcholine; LPE, lysophosphatidylethanolamine; Cer, ceramide; SM, sphingomyelin; CerG1, glucosylceramide. (E,F) Changes in the abundance of individual lipid species from the experiment in (D), with neutral lipids color coded, for Tsc2−/− MEFs treated with (E) rapamycin and (F) torin1. Dotted lines indicate a 2-fold change (FC) and an adjusted p-value of 0.1. (G-J) Immunoblots (G,I) and relative lipid class abundance (H,J) determined by mass spectrometry lipidomics mouse embryonic stem (ES) cells (G,H) and wild type, primary MEFs (I,J) treated with vehicle (DMSO) or torin1 (250 nM) in the presence of serum for 16 h.
Figure 2:
Figure 2:. Cells accumulate TGs following mTORC1 inhibition.
(A-C) TGs measured by enzyme assay and normalized to protein content in Tsc2−/− MEFs (A), PC3 (B), and HeLa cells (C) treated as in Figure 1A-D graphed as mean ± SD relative to vehicle-treated cells, n=3. (D,E) TGs measured and graphed as in (A-C) in mouse embryonic stem (ES) cells (D) and wild type, primary MEFs (E) treated as in Figure 1G-J. (F-H) Triglyceride levels quantified by enzyme assay and normalized to protein content from the same sample in HEK-293T (F), MCF7 (G), and H1299 (H) cells following 16 hrs of vehicle, rapamycin (20 nM), or torin1 (250 nM) treatment, graphed as mean ± SD relative to vehicle-treated cells, n=3. (I) Representative images of lipid droplets (stained with Bodipy 493/503, green) in Tsc2−/− MEFs, PC3, and HeLa cells treated as in (A-C). Nuclei are shown in blue. (J-L) Lipid droplet quantification for individual cells from (I) for Tsc2−/− MEFs (J), PC3 (K), and HeLa cells (L), graphed as mean ± SD relative to vehicle-treated cells, n=146–460 cells. * indicates P < .0001. (M,N) Immunoblot (M) and triglycerides determined by enzyme assay (N) and normalized to protein content from the same sample in 105K cells re-expressing TSC2 or an empty vector, following 16 hrs of serum starvation, graphed as mean ± SD relative to empty-vector cells, n=3. (O,P) TGs measured as in (A-C) in tumor (O) and plasma (P) from 105K tumor-bearing mice treated with vehicle or rapamycin (1 mg/kg) for two days, graphed as mean ± SD, n=7 tumors and n=4 plasma samples. (Q) TGs in Rictor+/+ and −/− MEFs treated for 16 h with vehicle or Torin1 (250 nM), measured as in (A-C) and graphed as mean ± SD, n=3. Statistical analysis by one-way ANOVA (A-C,F-H,J-L), two-tailed Student’s t-test (D,E), and two-way ANOVA (Q). n.s., not significant.
Figure 3:
Figure 3:. mTORC1 suppresses endogenous lipid remodeling
(A) Schematic for radioactive pulse-chase experiments conducted in this study. Lipid remodeling is assayed by a pulse-chase using 14C-fatty acids, and de novo lipid synthesis is assayed by labeling cells with 14C-acetic acid. (B) De novo lipogenesis measured in Tsc2−/− MEFs treated vehicle, rapamycin (20 nM), or torin1 (250 nM) for 16 hrs, followed by 4 hrs labeling, as in (A), with [1-14C]-acetate, graphed as mean ± SD relative to vehicle-treated cells, n=3. (C,D) TGs measured in Tsc2−/− MEFs treated vehicle, rapamycin (20 nM), or torin1 (250 nM) for 16 hrs, after pulse-chase labeling, as in (A) with (C) [1-14C]-oleate or (D) [1-14C]-palmitate, graphed as mean ± SD relative to vehicle-treated cells, n=3. (E,F) Immunoblot (E) and TGs (F) assayed by pulse-chase with [1-14C]-oleate tracer (6 h) in Tsc2−/− MEFs followed by chase in cold medium for 16 h with vehicle, 20 nM rapamycin, 250 nM torin1, 500 nM AZD2014, 5 nM RapaLink-1, or 1 μM BYL719 treatment, graphed as mean ± SD relative to vehicle-treated cells, n=3. (G-L) Immunoblots (G,J), de novo lipogenesis (H,K) and lipid remodeling (I,L), assayed as in (B-D), from wild-type MEFs (G-I) and HeLa cells (J-L) serum starved for 16 h, pre-treated with vehicle, rapamycin (20 nM), or torin1 (250 nM) for 30 min, and stimulated with insulin (100 nM) for 8 h, graphed as mean ± SD relative to vehicle-treated unstimulated cells, n=3. (M,N) Immunoblot (M) and 14C-TGs (N) in wild type and RagAGTP/GTP (RagAQ66L) MEFs following 16 h in amino acid-replete medium with vehicle or torin1 (250 nM) or amino acid-free medium with vehicle, measured and graphed as mean ± SD relative to amino acid replete, vehicle-treated cells, n=3. Statistical analysis by one-way ANOVA (B-D,F,H,I,K,L) and two-way ANOVA (N). n.s., not significant.
Figure 4:
Figure 4:. TG accumulation is linked to other changes in lipid metabolism
(A) Relationship between phospholipids and neutral lipids. Lyso-PL, lysophospholipid; GPX, glycerophosphodiester. (B) TGs measured enzymatically in Tsc2−/− MEFs treated with vehicle, torin1 (250 nM), and DGAT1 and/or DGAT2 inhibitor (each at 3 μM) for 16 hrs. Mean ± SD relative to vehicle, n=3. (C) TG turnover in Tsc2−/− MEFs pulse-labeled with [1-14C]-oleate. Following 1 hr pre-treatment with Torin1 or ATGLi (20 μM), TG synthesis was inhibited with DGAT inhibitors (3 μM each). 14C-TGs graphed as mean ± SD relative to 0 hrs, n=3. (D) 14C-Fatty acids in Tsc2−/− MEFs treated with vehicle, rapamycin (20 nM), or torin1 (250 nM) for 16 hrs, measured as in Figure 3C. Mean ± SD, n=3. (E) Individual lysophospholipid species from the experiment in Tsc2−/− MEFs in Figure 1D. Dotted lines indicate a 2-fold change and an adjusted p-value of 0.1. (F,G) Ratio of lysophosphatidylcholine to phosphatidylcholine in Tsc2−/− MEFs pulse-chased [methyl-14C]-choline, then treated with inhibitors for 16 hrs (F) or 0-4 hrs (G). Mean ± SD relative to vehicle (F) or relative to 0 hrs (G), n=3. (H) Glycerophosphocholine levels following 16 hrs of inhibitor treatment in Tsc2−/− MEFs; mean ± SD relative to vehicle-treated cells, n=3. (I,J) 14C-TG (I) and 14C-fatty acids (J) in Tsc2−/− MEFs treated for 16 hrs with vehicle, rapamycin, or torin1 in the presence of vehicle, DGAT inhibitors (3 μM each), and/or etomoxir (20 μM); mean ± SD, n=3. (K) 14C-Fatty acids in Tsc2−/− MEFs following torin1 treatment after 1 hr pre-treatment with vehicle, DGAT inhibitors, and etomoxir; mean ± SD, n=3. (L,M) Acyl-carnitines and lysophospholipids detected by mass spectrometry in Tsc2−/− MEFs treated for 16 hrs with torin1 and DGAT inhibitors; mean ± SD relative to vehicle, n=3. (N) β-oxidation of [9,10-3H]-palmitate in Tsc2−/− MEFs following pulse-chase and 16 hr treatment with vehicle, torin1, DGAT inhibitors, or etomoxir. Mean ± SD, n=3. (O) β-oxidation in Tsc2−/− MEFs following a time course of vehicle or torin1 after 1 hr pre-treatment with vehicle or DGAT inhibitors. Mean ± SD, n=3. Statistics: one-way ANOVA (F,H), two-way ANOVA (B,G,I-O), extra sum-of-squares F-test (C). n.s., not significant. * P < .0001.
Figure 5:
Figure 5:. Changes in intracellular lipid species following mTORC1 inhibition require lysosomal function.
(A) TGs assayed by [1-14C]-oleate tracer in Tsc2−/− MEFs treated with vehicle, rapamycin (20 nM), or torin1 (250 nM), in the presence of vehicle (DMSO), bafilomycin A1 (BafA1, 250 nM) or chloroquine (100 μM) for 16 hrs, graphed as mean ± SD relative to vehicle-treated cells, n=3. (B,C) TGs measured by enzyme assay and normalized to protein content in HEK-293T (B) and PC3 (C) cells treated for 16 hrs with torin1 and/or BafA1, as in (A), graphed as mean ± SD relative to vehicle-treated cells, n=3. (D-G) Oleoyl-carnitine (D) and lysophospholipid class sums (E-G) quantified by lipidomics in Tsc2−/− MEFs treated as in (B,C), graphed as mean ± SD relative to vehicle-treated cells, n=3. (H) Relative glycerophosphocholine levels, measured by mass spectrometry, in MEFs treated as in (A), graphed as mean ± SD relative to vehicle-treated cells, n=3. (I) Individual lipid species detected in HEK293T lipid extracts from lysosomal immunopurification or whole cells, grouped by class. The Log10 average ratio of ion counts in the fractions is shown. Bars represent the mean fold enrichment for individual lipid species in that class ± SD for n=3 replicates. (J) Individual phosphatidylcholine (PC) and phosphatidyethanolamine (PE) species detected in the experiment in (I) and graphed by whether they contain an ether linkage or not. Plotted as group mean ± SD for n=3 replicates. (K,L) Relative lysophospholipid and phospholipid class sums for species detected in lysosomal (K) and whole cell (L) lipid extracts from HEK-293T cells treated with torin1 (250 nM) for 0, 2, or 4 hrs, graphed as mean ± SD relative to the 0 hr timepoint, n=3. (M,N) Relative lysophospholipid class sums for species detected in lysosomal lipid extracts from HEK-293T cells pre-treated for 1 hr with vehicle or BafA1 (250 nM) and then treated with vehicle or torin1 (250 nM) for 4 hrs, graphed as mean ± SD relative to vehicle-treated cells, n=3. Statistical analysis by two-way ANOVA (A-H,J-L). n.s., not significant.
Figure 6:
Figure 6:. TG and other lipid species accumulate independently of autophagy following mTORC1 inhibition.
(A,B) Immunoblot (A) and TGs measured by pulse-chase with [1-14C]-oleate tracer (B) in Atg5+/+ and −/− MEFs treated for 16 hrs with vehicle, torin1 (250 nM), and/or BafA1 (250 nM), graphed as mean ± SD relative to vehicle-treated cells, n=3. (C,D) Immunoblot (C) and TGs (D) measured by enzyme assay and normalized to protein content in parental and ATG7 KO HEK-293T cells treated as in (A,B), graphed as mean ± SD relative to vehicle-treated cells, n=3. (E,F) Acyl-carnitine (E) and lysophospholipid (F) species measured by mass spectrometry in Atg5+/+ and −/− MEFs treated for 16 hrs with vehicle or torin1 (250 nM), graphed as mean ± SD relative to vehicle-treated cells, n=3. (G) Immunoblot for autophagy markers in parental Tsc2−/− MEFs and sgUvrag and sgAtg14 clones following 4 hrs treatment with vehicle, rapamycin (20 nM), or torin1 (250 nM). (H) TG accumulation measured by pulse-chase with [1-14C]-oleate tracer in the cells treated as in (G) for 16 hrs, graphed as mean ± SD relative to vehicle-treated cells, n=3. (I) TG accumulation in parental Tsc2−/− MEFs and sgAtg14 clone following 16 hrs in amino acid-replete or free medium, measured and graphed as in (H) relative to amino acid-replete cells, n=3. Statistical analysis by two-way ANOVA (B,D,E,F,H,I). n.s., not significant. * indicates P < .0001.
Figure 7:
Figure 7:. Induction of endosomal delivery to the lysosome is required for the changes in cellular lipid species following mTORC1 inhibition
(A,B) Relative TG (A) and lysophospholipid (B) class sums measured by mass spectrometry in Tsc2−/− MEFs treated for 16 hrs with vehicle, torin1 (250 nM), VPS34-IN1 (5 μM), and/or Dynasore (80 μM), graphed as mean ± SD relative to vehicle-treated cells, n=3. (C) Fatty acid accumulation measured by pulse-chase with [1-14C]-oleate tracer in the presence of DGAT inhibitors (3 μM each) and etomoxir (20 μM) in Tsc2−/− MEFs over a time course of vehicle or torin1 (250 nM) treatment, following 1 hr pre-treatment with endocytosis inhibitors (5 μM VPS34-IN1, 1 μM PIK-FYVEi, 80 μM Dynasore, or 20 μM PitStop 2). Graphed as mean ± SD relative to vehicle-treated cells at time 0, n=3. (D,E) Endocytosis of transferrin (time course in D) and 10-kDa dextran (E) following 4 hrs of vehicle, rapamycin (20 nM), or torin1 (250 nM) treatment in Tsc2−/− MEFs, graphed as mean ± SD, n=3. (F,G) mTORC1 inhibition enhances hydrolysis of endocytosed BSA in Tsc2−/− MEFs (F) and PC3 cells (G). Following 1 hr pretreatment with vehicle, rapamycin (20 nM) or torin1 (250 μM), cells were co-labeled for 3 hrs with BSA Alexa Fluor 647 (uptake, red in merged) and DQ-Green BSA (cleavage, green in merged) (10 μg/mL each). Nuclei are shown in blue. (H-K) Quantification of the results from the experiments shown in (F) and (G). (H,J) Relative BSA Alexa Fluor 647 uptake into individual cells. (I,K) Relative DQ-Green-BSA fluorescence (cleavage) normalized to BSA Alexa Fluor 647 (uptake) on a per-cell basis. Graphed as mean ± SD relative to vehicle-treated cells, n=108-133 cells. a.u., Arbitrary Units. Statistical analysis by two-way ANOVA (A-E), and one-way ANOVA (H-K). n.s., not significant. In (B) and (C) * indicates P < 0.001.
Figure 8:
Figure 8:. Model of the differential effects of mTORC1 activation and inhibition on cellular lipid metabolism
(A) mTORC1 activation by pro-growth signals induces de novo fatty acid synthesis as part of its growth-promoting activity. (B) mTORC1 inhibition leads to membrane phospholipid delivery and turnover in the lysososome, with the released fatty acids being available for energy storage as triglycerides or energy production via beta-oxidation in the mitochondria.

Comment in

References

    1. Rousseau A & Bertolotti A An evolutionarily conserved pathway controls proteasome homeostasis. Nature 536, 184–189, doi:10.1038/nature18943 (2016). - DOI - PMC - PubMed
    1. Ottens F, Franz A & Hoppe T Build-UPS and break-downs: metabolism impacts on proteostasis and aging. Cell Death Differ 28, 505–521, doi:10.1038/s41418-020-00682-y (2021). - DOI - PMC - PubMed
    1. Ben-Sahra I & Manning BD mTORC1 signaling and the metabolic control of cell growth. Curr Opin Cell Biol 45, 72–82, doi:10.1016/j.ceb.2017.02.012 (2017). - DOI - PMC - PubMed
    1. Muller M et al. The coordinated action of the MVB pathway and autophagy ensures cell survival during starvation. Elife 4, e07736, doi:10.7554/eLife.07736 (2015). - DOI - PMC - PubMed
    1. Saxton RA & Sabatini DM mTOR Signaling in Growth, Metabolism, and Disease. Cell 168, 960–976, doi:10.1016/j.cell.2017.02.004 (2017). - DOI - PMC - PubMed

Publication types