. 2022 Dec;28(12):2537-2546.
doi: 10.1038/s41591-022-02106-5. Epub 2022 Dec 19.

Human loss-of-function variants in the serotonin 2C receptor associated with obesity and maladaptive behavior

Affiliations

Human loss-of-function variants in the serotonin 2C receptor associated with obesity and maladaptive behavior

Yang He et al. Nat Med. 2022 Dec.

Abstract

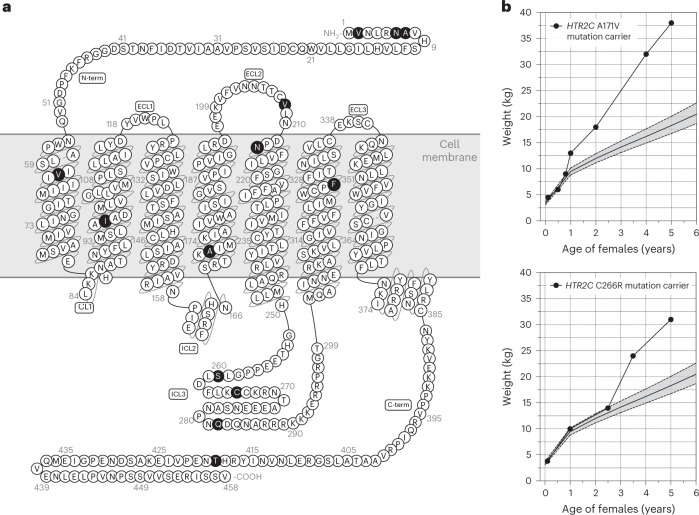
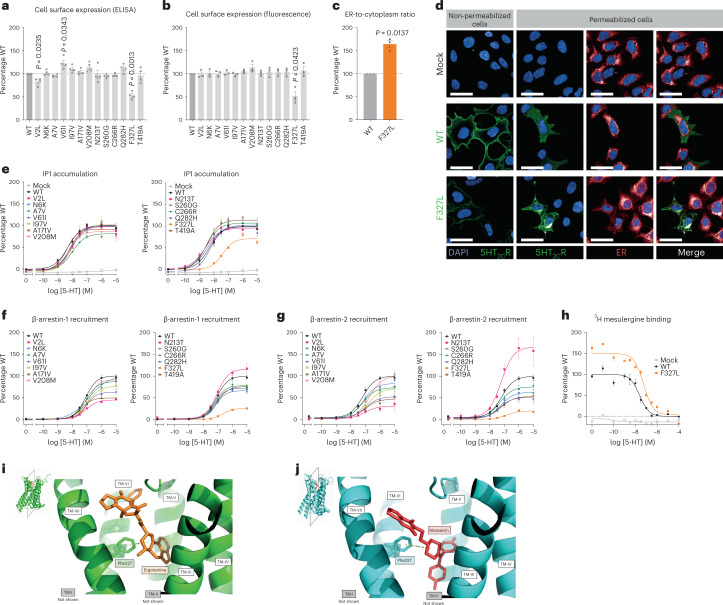
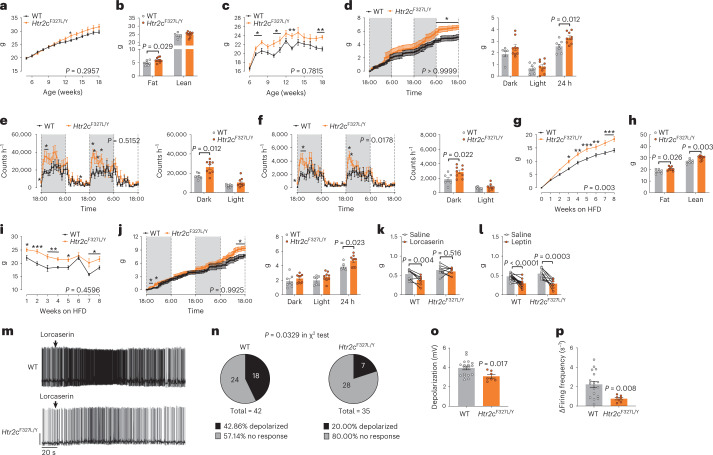
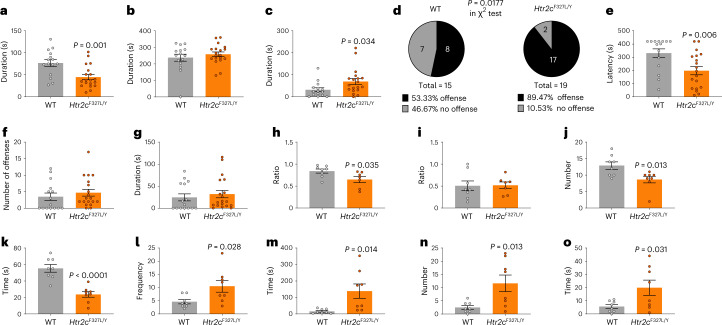
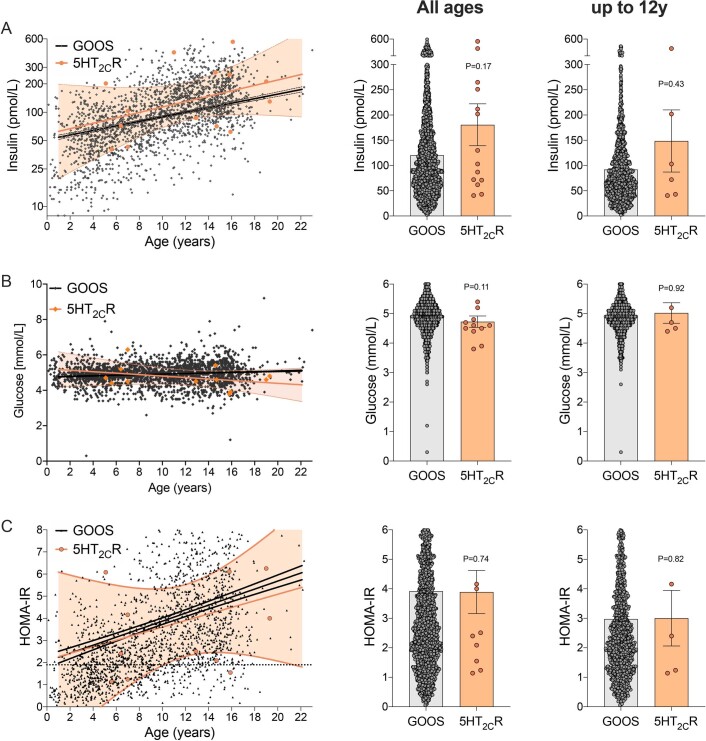
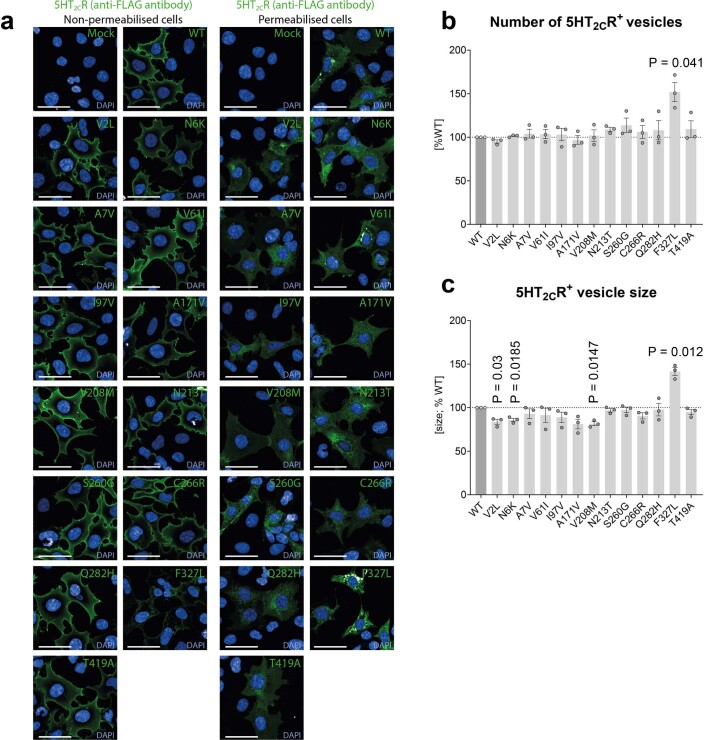
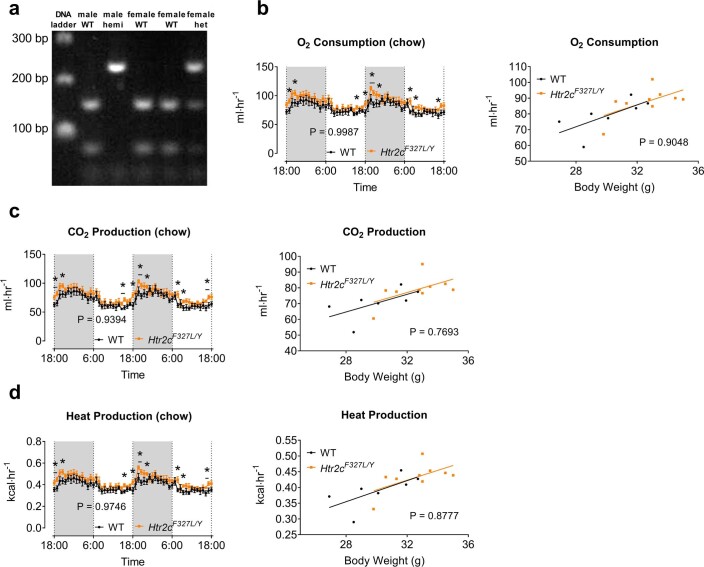
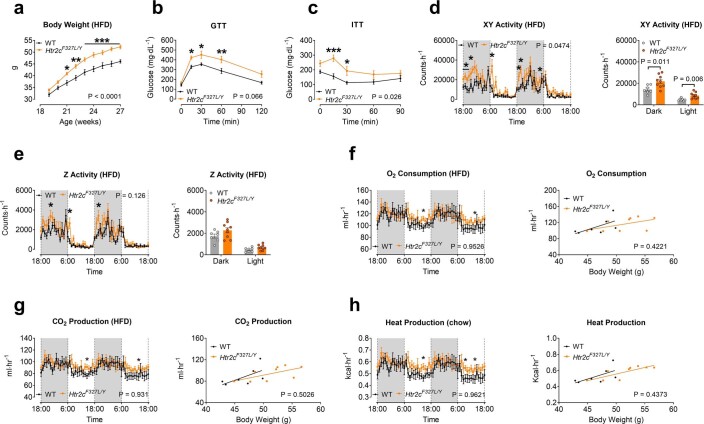
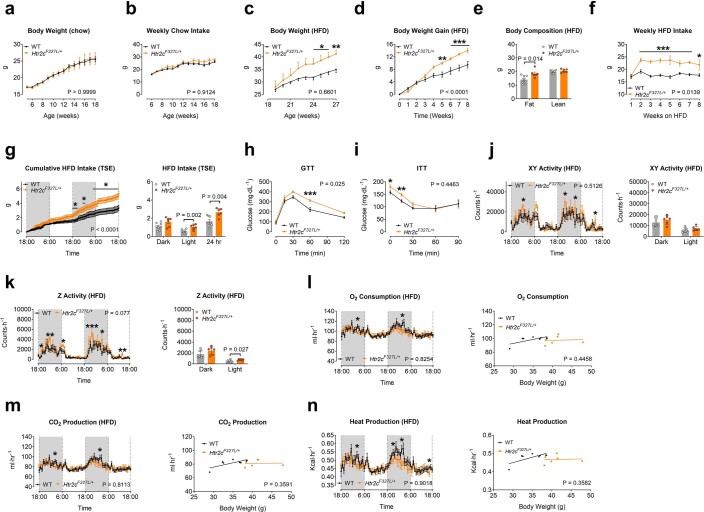
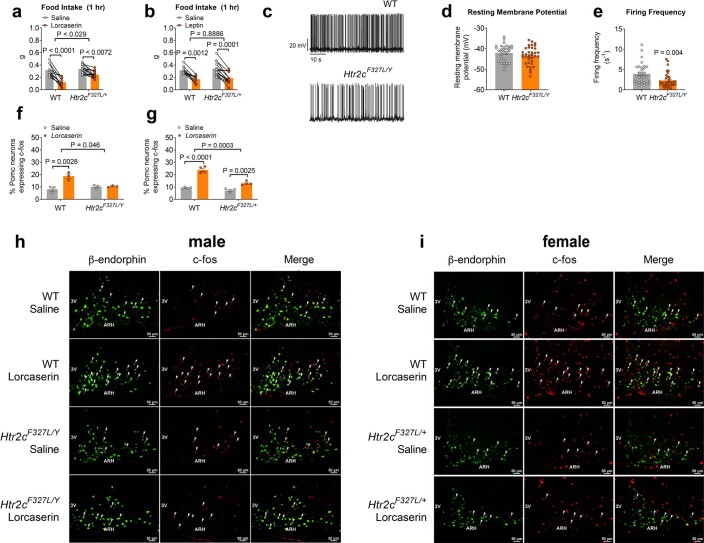
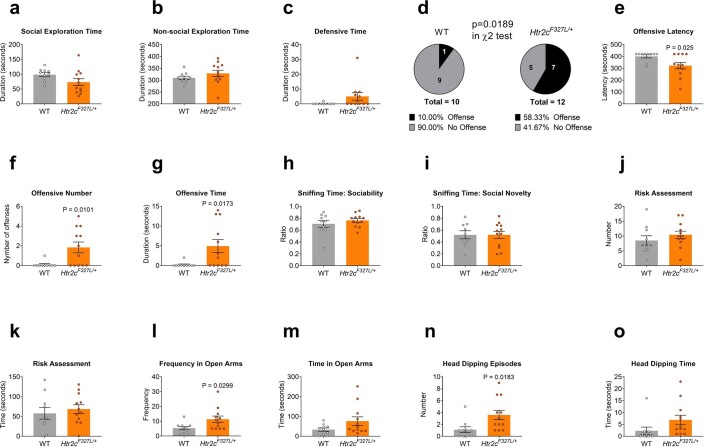
Serotonin reuptake inhibitors and receptor agonists are used to treat obesity, anxiety and depression. Here we studied the role of the serotonin 2C receptor (5-HT2CR) in weight regulation and behavior. Using exome sequencing of 2,548 people with severe obesity and 1,117 control individuals without obesity, we identified 13 rare variants in the gene encoding 5-HT2CR (HTR2C) in 19 unrelated people (3 males and 16 females). Eleven variants caused a loss of function in HEK293 cells. All people who carried variants had hyperphagia and some degree of maladaptive behavior. Knock-in male mice harboring a human loss-of-function HTR2C variant developed obesity and reduced social exploratory behavior; female mice heterozygous for the same variant showed similar deficits with reduced severity. Using the 5-HT2CR agonist lorcaserin, we found that depolarization of appetite-suppressing proopiomelanocortin neurons was impaired in knock-in mice. In conclusion, we demonstrate that 5-HT2CR is involved in the regulation of human appetite, weight and behavior. Our findings suggest that melanocortin receptor agonists might be effective in treating severe obesity in individuals carrying HTR2C variants. We suggest that HTR2C should be included in diagnostic gene panels for severe childhood-onset obesity.


Conflict of interest statement

I.S.F. has consulted for a number of companies involved in the development of weight loss drugs (Rhythm Pharmaceuticals, Eli Lilly and Novo Nordisk). All other authors have no competing interests.

Figures

Fig. 1
Fig. 1. Rare variants affecting 5-HT2CR identified in people with severe obesity.
a, Rare variants identified in individuals with severe early-onset obesity shown on a schematic of the 5-HT2CR protein; ECL and ICL refer to extra- and intracellular loops of the G-protein-coupled receptor (GPCR), respectively; C-term, C-terminal domain of the protein. b, Weight charts of two female probands (5th and 95th percentiles based on reference data for the UK population shown as dashed lines).
Fig. 2
Fig. 2. Genetic obesity syndromes.
A schematic depicting genetic obesity syndromes, conditions where severe childhood-onset obesity is a major presenting clinical feature. Conditions in bold are those where the gene/genes have been shown to affect signaling through the leptin–melanocortin pathway and could be treated by an MC4R agonist. Clinical features seen in people with LOF variants in the gene encoding the serotonin 2C receptor (orange) are reported in this study.
Fig. 3
Fig. 3. Human variants in the gene encoding 5-HT2CR cause a loss of function in cells.
Wild-type (WT) and mutant forms of 5-HT2CR were studied in cells. a,b, Cell surface localization of WT and mutant receptors measured by ELISA (a) and high-content confocal microscopy (b). Values are expressed as percentage of WT and represent mean ± s.e.m., n = 3–4 independent experiments; mock transfected cells served as negative controls. Differences between WT and mutant receptors were compared using two-tailed Student’s t-tests with Welch correction. c, Expression of WT versus F327L 5-HT2CR in the ER compared to the cytoplasm, quantified by high-content confocal microscopy. Data represent mean ± s.e.m., n = 3 independent experiments; differences between WT and mutant receptors were determined by two-tailed Student’s t-tests with Welch correction. d, A representative micrograph of subcellular localization of WT and F327L 5-HT2CR in non-permeabilized and permeabilized cells. Scale bars, 50 μm. 4,6-Diamidino-2-phenylindole (DAPI) was used to stain the nucleus. eg, Effects on receptor-mediated activation of Gαq/11-regulated inositol triphosphate signaling (IP1 accumulation; n = 3–4 independent experiments) (e) and coupling to β-arrestin-1 and -2 (n = 4–5 independent experiments) (f,g). Data are shown as sum curves normalized to WT response ± s.e.m. EC50 and maximum response (Emax) for each variant is shown in Supplementary Table 1. h, Competitive binding assay for WT versus F327L 5-HT2CR using the receptor antagonist 3H-mesulergine with increasing concentrations of the agonist, 5-HT. Sum curves are shown from n = 3 independent experiments normalized to WT max binding ± s.e.m. Affinity (IC50) and number of binding sites (Bmax) are shown in Supplementary Table 1; significant differences from receptor were determined using a two-tailed Student’s t-test with Welch correction. i,j, Structural analysis of the 5-HT2CR in an active (i) and inactive conformation (j), bound to the agonist ergotamine and the inverse agonist ritanserin, respectively. TM, transmembrane domains (I–VII). The F327 (Phe327) residue is highlighted and predicted to interact with both ligands. Source data
Fig. 4
Fig. 4. Knock-in Htr2cF327L mice develop hyperphagic obesity and are less responsive to 5-HT2CR agonism.
ac, Body weight curves (a), body composition (b) and weekly chow intake (c) of male WT (n = 10) and Htr2cF327L/Y mice (n = 10) fed on regular chow. df, Cumulative chow intake (d), temporal levels of xy axis activity (e) and z axis activity (f) during a 2-d period measured by the TSE PhenoMaster apparatus in male WT (n = 7) and Htr2cF327L/Y (n = 9) mice (left). Averaged values during the dark or light cycle on left (right). gi, Body weight curves (g), body composition (h) and weekly HFD intake (i) of male WT (n = 7) and Htr2cF327L/Y (n = 9) mice fed on HFD. j, Cumulative HFD intake during a 2-d period in male WT (n = 7) and Htr2cF327L/Y (n = 9) mice (left). Averaged HFD intake during the dark cycle, light cycle or 24 h (right). k, One-hour food intake in chow-fed male WT (n = 8) and Htr2cF327L/Y (n = 8) mice (6 months of age) after i.p. injections of saline or lorcaserin (3 mg kg–1). l, One-hour food intake in chow-fed male WT (n = 9) and Htr2cF327L/Y mice (n = 14) (2 months of age) after i.p. injections of saline or leptin (5 mg kg−1). m, Representative traces in POMC neurons from WT and Htr2cF327L/Y mice treated with lorcaserin. n, Percentage/number of POMC neurons from WT and Htr2cF327L/Y mice that were depolarized by or irresponsive to lorcaserin. o,p, Resting membrane potential, depolarization (o) and increases in firing frequency (p) induced by lorcaserin in WT (n = 18) and Htr2cF327L/Y (n = 7) mice. Two-way analysis of variance followed by Sidak’s multiple comparisons were performed in a,cf (left), g,iI. P values in some individual data points in a,c,df (left), i,j were determined by two-tailed unpaired Student’s t-test. Two-tailed unpaired Student’s t-tests were performed in b,d,e,h,j (right), f (left), o,p. *P < 0.05, **P < 0.01 and ***P < 0.001. Data are presented as mean ± s.e.m. Source data
Fig. 5
Fig. 5. Knock-in male Htr2cF327L/Y mice develop social anxiety.
ac, Social exploration time (a), non-social exploration time (b) and defensive time (c) spent by male WT (n = 15) and Htr2cF327L/Y mice (n = 19) (4–5 months of age) in the resident-intruder test. d, Percentage/number of male WT and Htr2cF327L/Y mice that exhibited offensive behaviors toward the intruder. e,g, Offensive latency, number and time quantified in male WT (n = 15) and Htr2cF327L/Y (n = 19) mice in the intruder test. h, Ratio of time spent sniffing a mouse when interacting with a mouse compared to an object in the three-chamber social interaction test quantified in male WT (n = 7) and Htr2cF327L/Y (n = 8) mice. i, Ratio of time spent sniffing a novel mouse when interacting with a new mouse compared to a familiar mouse in the three-chamber social interaction test in male WT (n = 7) and Htr2cF327L/Y (n = 8) mice. l,m, Number of entries to (l) and time spent on (m) the open arms of the EPM apparatus by male WT (n = 8) and Htr2cF327L/Y (n = 8) mice. n,o, Number of (n) and time (o) spent in head dipping on the open arms of the EPM apparatus by male WT (n = 8) and Htr2cF327L/Y (n = 8) mice. P values were determined by two-tailed unpaired Student’s t-tests. Data are presented as mean ± s.e.m. with individual data points. Source data
Extended Data Fig. 1
Extended Data Fig. 1. Glucose homeostasis in HTR2C variant carriers compared to age and BMI matched controls.
a, Fasting plasma insulin levels (log10-transformed) in 14 HTR2C variant carriers compared to 2138 severely obese children as controls [GOOS]. b and c show the mean fasting plasma insulin levels in HTR2C variant carriers of all ages (N = 14) or under 12 years of age (N = 6). d, Fasting plasma glucose levels in 12 HTR2C variant carriers compared to 2248 severely obese children as controls [GOOS]. e and f show the mean fasting plasma glucose levels in HTR2C variant carriers of all ages (N = 12); and in HTR2C variant carriers up to 12 years of age (N = 5), respectively. In a and d, the 5th and 95th percentiles are shown as dashed lines and the regression slopes are shown as solid lines in gray [GOOS] or orange [HTR2C variant carriers]. g, The relationship between HOMA-IR (Homeostasis Model Assessment of insulin resistance) scores and age in 12 HTR2C variant carriers compared to 2024 severely obese children as controls [GOOS]. HOMA-IR was calculated as [(fasting insulin in μU/mL) × (fasting glucose in mg/dL)] / 405. Dashed lines represent 95% confidence intervals; regression slope shown as solid lines in gray [GOOS] or orange [HTR2C variant carriers]. A dotted horizontal line indicates the threshold above which values are consistent with insulin resistance. h and i show the mean HOMA-IR scores in HTR2C variant carriers of all ages (N = 12); and on HTR2C variant carriers up to 12 years of age (N = 5), respectively. Statistical significance was determined using two-tailed Mann-Whitney U test. Data are shown as mean ± SEM.
Extended Data Fig. 2
Extended Data Fig. 2. Functional characterization of human variants in 5-HT2CR.
a, Representative micrographs of cell surface and intracellular expression of WT vs mutant receptors (green), quantified by high-content confocal microscopy. Phalloidin and DAPI (blue) were used to stain the cytoplasm and nuclei, respectively and were used for cell identification. Scale bar = 50 μm. b-c, Number of receptor-containing vesicles (b), and the size of these receptor positive vesicles (c), expressed as % of WT. Differences between WT and mutant receptors were compared with two-tailed student’s t-test with Welch correction. Results represent mean ± SEM of 3 independent experiments. Source data
Extended Data Fig. 3
Extended Data Fig. 3. Metabolic phenotype in chow-fed male Htr2cF327L/Y mice.
a, The PCR products around the mouse F328 (equivalent to human F327) were amplified from genomic DNA extracts and incubated with NlaIV. A WT allele was cut into 153, 79 and 34 bp bands. A F327L mutant allele resulted in 232 and 34 bp bands. Heterozygous alleles (a WT allele + a F327L mutant allele) resulted in 232, 153, 79 and 34 bp bands (repeated 3 times independently for all groups). b-d, Left panels: temporal levels of O2 consumption (b), CO2 production (c) and heat production (d) during a 2-day period measured by the TSE PhenoMaster in 18-week old chow-fed male WT (N = 7) and Htr2cF327L/Y (N = 9) mice. Right panels: the regression of O2 consumption, CO2 production and heat production with body mass. Two way ANOVA followed by Sidak’s multiple comparisons were performed in b (left panel), c (left panel), d (left panel). P values in b (left panel), c (left panel), d (left panel) were determined by two-tailed unpaired t-test. Regression-based ANCOVA analysis was performed in b (right panel), c (right panel) and d (right panel). *, p < 0.05. Data are presented as mean ± SEM.*, p < 0.05. Source data
Extended Data Fig. 4
Extended Data Fig. 4. Metabolic phenotype in HFD-fed male Htr2cF327L/Y mice.
a, Body weight curves of male WT (N = 7) and Htr2cF327L/Y mice (N = 9) fed on HFD. b-c, Blood glucose levels in a glucose tolerance test (GTT) (b) or in an insulin tolerance test (ITT) (c) in male WT (N = 7) and Htr2cF327L/Y (N = 9) mice fed on HFD. N = 7 or 9 mice per group. d-e, Left panels: temporal levels of XY axis activity (d), Z axis activity measured by the TSE PhenoMaster in 27-week old HFD-fed male WT (N = 7) and Htr2cF327L/Y (N = 9) mice (e), Right panels: averaged values during the dark cycle, light cycle or 24 hours. f-h, Temporal levels of O2 consumption (f), CO2 production (g) and heat production (h) during a 2-day period measured by the TSE PhenoMaster in 27-week old HFD-fed male WT (N = 7) and Htr2cF327L/Y (N = 9) mice. Right panels: the regression of O2 consumption, CO2 production and heat production with body mass. Two way ANOVA followed by Sidak’s multiple comparisons were performed in a, b, c, d (left panel), e (left panel), g (left panel) and h (left panel). P values in d (left panel), e (left panel), f (left panel), g (left panel) and h (left panel) were determined by two-tailed unpaired t-test. Two-tailed unpaired t-tests were performed in d (right panel) and e (right panel). Regression-based ANCOVA analysis was performed in f (right panel), g (right panel) and h (right panel). *, p < 0.05. Data are presented as mean ± SEM. Source data
Extended Data Fig. 5
Extended Data Fig. 5. Metabolic phenotype in HFD-fed female Htr2cF327L/+ mice.
a-b, Body weight curves (a) and weekly chow intake (b) of female WT (N = 8) and Htr2cF327L/+ (N = 8) mice fed on regular chow. c-f, Body weight curves (c), body weight gain (d), body composition (e) and weekly HFD intake (f) of female WT (N = 6) and Htr2cF327L/+ (N = 8) mice fed on HFD. g, Left panel: cumulative HFD intake during a 2-day period measured by the TSE PhenoMaster in female WT (N = 6) and Htr2cF327L/+ (N = 8) mice. Right panel: averaged HFD intake during the dark cycle, light cycle or 24 hours. h-i, Blood glucose levels in a glucose tolerance test (GTT) in female WT (N = 7) and Htr2cF327L/+ (N = 6) mice (h) or in an insulin tolerance test (ITT) in female WT (N = 8) and Htr2cF327L/+ (N = 6) mice (i). j-n, Left panels: temporal levels of XY axis activity (j), Z axis activity (k), O2 consumption (l), CO2 production (m) and heat production (n) during a 2-day period measured by the TSE PhenoMaster in HFD-fed female WT (N = 6) and Htr2cF327L/+ (N = 8) mice. Right panels: averaged values during the dark cycle, light cycle in j and k and the regression of O2 consumption, CO2 production and heat production with body mass in l, m and n. Two way ANOVA followed by Sidak’s multiple comparisons were performed in a-d, f, g, h, i, j (left panel), k (left panel), l (left panel), m (left panel), n (left panel). P values in c, f, g (left panel), i, j (left panel), k (left panel), l (left panel), m (left panel), n (left panel) were determined by two-tailed unpaired t-test. Two-tailed unpaired t-tests were performed in e, g (right panel), j (right panel) and k (right panel). Regression-based ANCOVA analysis was performed in l (right panel), m (right panel) and n (right panel). *, p < 0.05, **, p < 0.01, ***, p < 0.001. Data are presented as mean ± SEM. Source data
Extended Data Fig. 6
Extended Data Fig. 6. Activity of Pomc neurons in male Htr2cF327L/Y mice.
a, One hour food intake in chow-fed female WT (N = 10) and Htr2cF327L/+ mice (2 months of age) (N = 13) after i.p. injections of saline or lorcaserin (3 mg per kg). b, One hour food intake in chow-fed female WT (N = 10) and Htr2cF327L/+ mice (2 months of age) (N = 13) after i.p. injections of saline or leptin (5 mg per kg). c, Representative current clamp baseline (without any treatment) traces in Pomc neurons from WT and Htr2cF327L/Y mice. d-e, Baseline resting membrane potential (d) and firing frequency (e) in Pomc neurons from WT (N = 31) and Htr2cF327L/Y (N = 35) mice. f-g, Percentage of Pomc neurons (labeled by β-endorphin) expressing c-fos in chow-fed male WT (N = 3) and Htr2cF327L/Y mice (N = 3) (7 months of age) (f) and chow-fed female WT (N = 4) and Htr2cF327L/+ mice (N = 4) (4 months of age) (g) after i.p. injections of saline or lorcaserin (3 mg per kg). h-i, Representative microscopic images showing immunoreactivity of β-endorphin (left green), c-fos (middle red) and merge in male (repeated 3 times independently for all groups) (h) and female (repeated 4 times independently for all groups) (i) mice. Two way ANOVA followed by Sidak’s multiple comparisons were performed in a, b, f, g. Two-tailed unpaired t-tests were performed in d and e. Data are presented as mean ± SEM. Source data
Extended Data Fig. 7
Extended Data Fig. 7. Abnormal behaviour in knock-in female Htr2cF327L/+ mice.
a-c, Social exploration time (a), non-social exploration time (b) and defensive time (c), spent by female WT (N = 10) and Htr2cF327L/+ (N = 12) mice (4 months of age) in the resident-intruder test. d, Percentage/number of female WT and Htr2cF327L/+ mice that exhibited offensive behaviors towards the intruder. e-g, Offensive latency, number and time quantified in female WT (N = 10) and Htr2cF327L/+ (N = 12) mice in the intruder test. h, Ratio of time spent sniffing a mouse when interacting with a mouse and an object in the three-chamber social interaction test. N = 9 mice in WT group and 12 mice Htr2cF327L/+ group. i, Ratio of time spent in sniffing a novel mouse when interacting with a new mouse and a familiar mouse in the three-chamber social interaction test, N = 9 mice in WT group and 12 mice Htr2cF327L/+ group. j-k, Number (j) and time (k) of risk assessment behaviour by female WT (N = 10) and Htr2cF327L/+ mice (N = 12) (4 months of age) in the EPM test. l-m, Number of entries to (l) and time spent on (m) the open arms of the EPM apparatus by female WT (N = 10) and Htr2cF327L/+ (N = 12) mice. n-o, Number of (n) and time (o) spent in head dipping on the open arms of the EPM apparatus by female WT (N = 10) and Htr2cF327L/+ (N = 12) mice. Two-tailed unpaired t-tests. Data are presented as mean ± SEM. Source data

Comment in

References

    1. Marston OJ, Garfield AS, Heisler LK. Role of central serotonin and melanocortin systems in the control of energy balance. Eur. J. Pharmacol. 2011;660:70–79. doi: 10.1016/j.ejphar.2010.12.024. - DOI - PubMed
    1. Donovan MH, Tecott LH. Serotonin and the regulation of mammalian energy balance. Front. Neurosci. 2013;7:36. doi: 10.3389/fnins.2013.00036. - DOI - PMC - PubMed
    1. Lam DD, Garfield AS, Marston OJ, Shaw J, Heisler LK. Brain serotonin system in the coordination of food intake and body weight. Pharmacol. Biochem. Behav. 2010;97:84–91. doi: 10.1016/j.pbb.2010.09.003. - DOI - PubMed
    1. Alvarez-Jimenez M, et al. Antipsychotic-induced weight gain in chronic and first-episode psychotic disorders: a systematic critical reappraisal. CNS Drugs. 2008;22:547–562. doi: 10.2165/00023210-200822070-00002. - DOI - PubMed
    1. Xu Y, et al. 5-HT2CRs expressed by pro-opiomelanocortin neurons regulate insulin sensitivity in liver. Nat. Neurosci. 2010;13:1457–1459. doi: 10.1038/nn.2664. - DOI - PMC - PubMed

Publication types

Substances

LinkOut - more resources