. 2022 Dec 19;23(1):839.
doi: 10.1186/s12864-022-09076-5.

The proteomic analysis of bovine embryos developed in vivo or in vitro reveals the contribution of the maternal environment to early embryo

Affiliations

The proteomic analysis of bovine embryos developed in vivo or in vitro reveals the contribution of the maternal environment to early embryo

Charles Banliat et al. BMC Genomics. .

Abstract

Background: Despite many improvements with in vitro culture systems, the quality and developmental ability of mammalian embryos produced in vitro are still lower than their in vivo counterparts. Though previous studies have evidenced differences in gene expression between in vivo- and in vitro-derived bovine embryos, there is no comparison at the protein expression level.

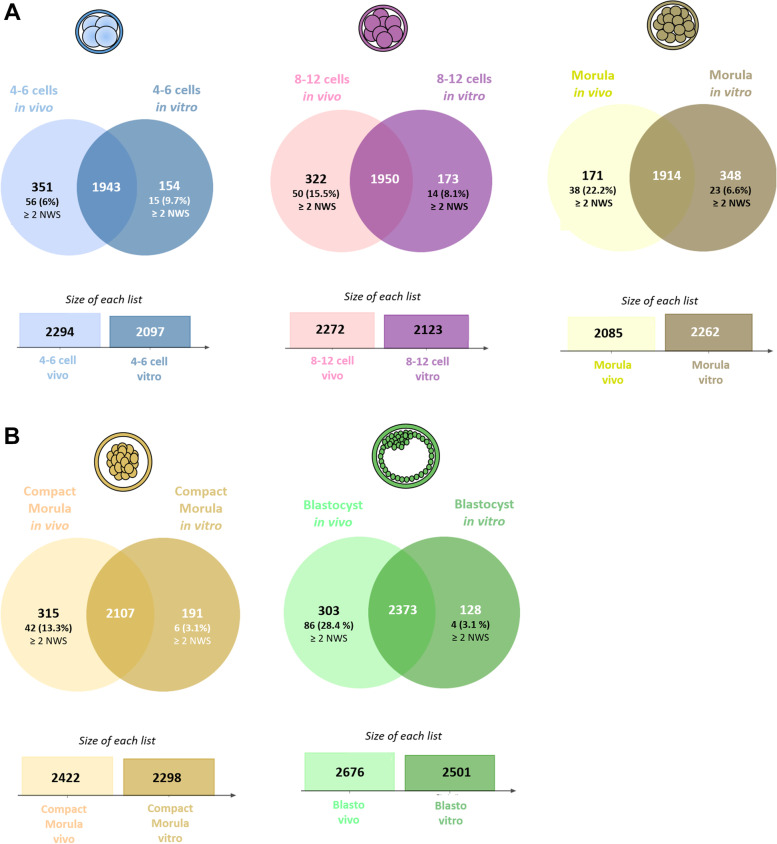
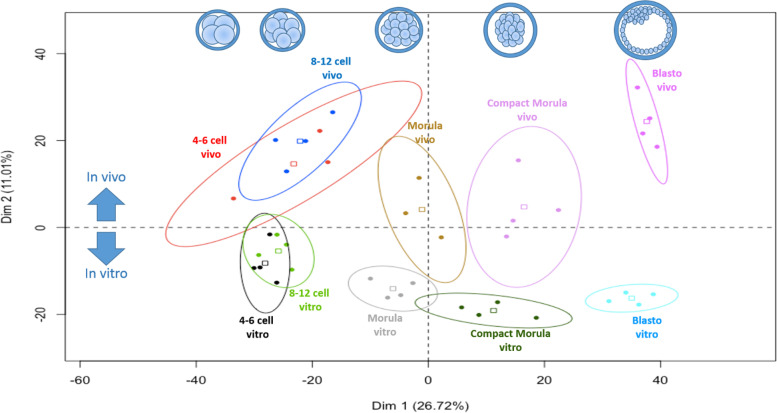
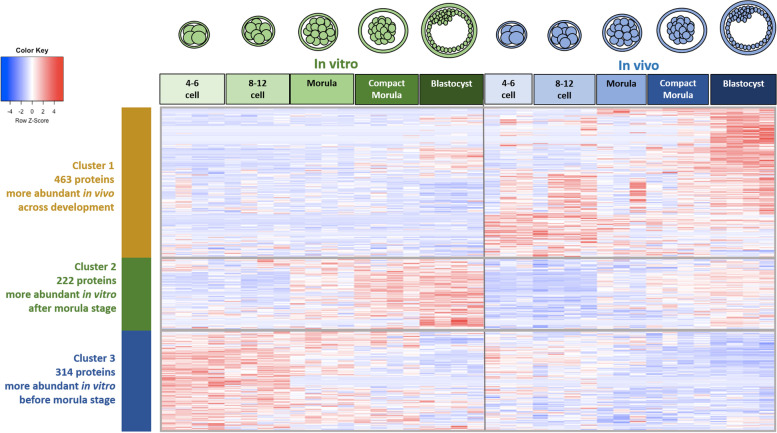
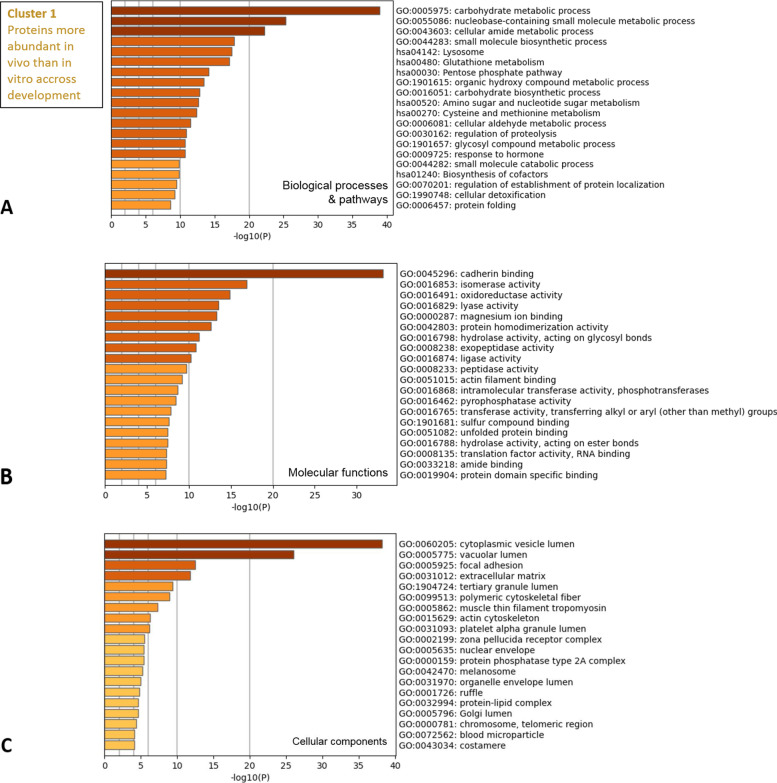
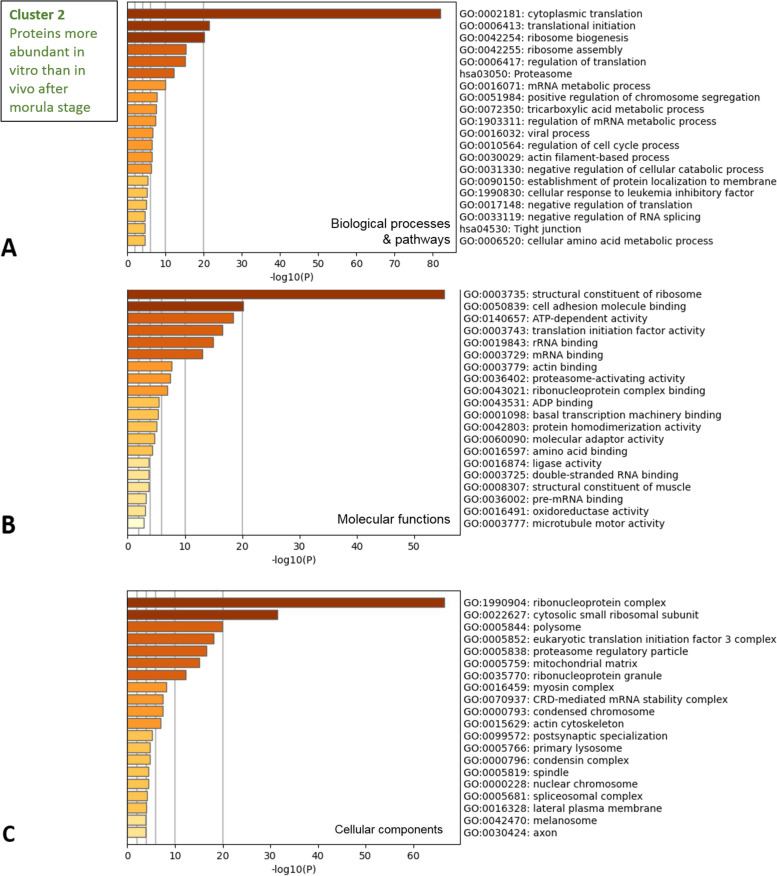
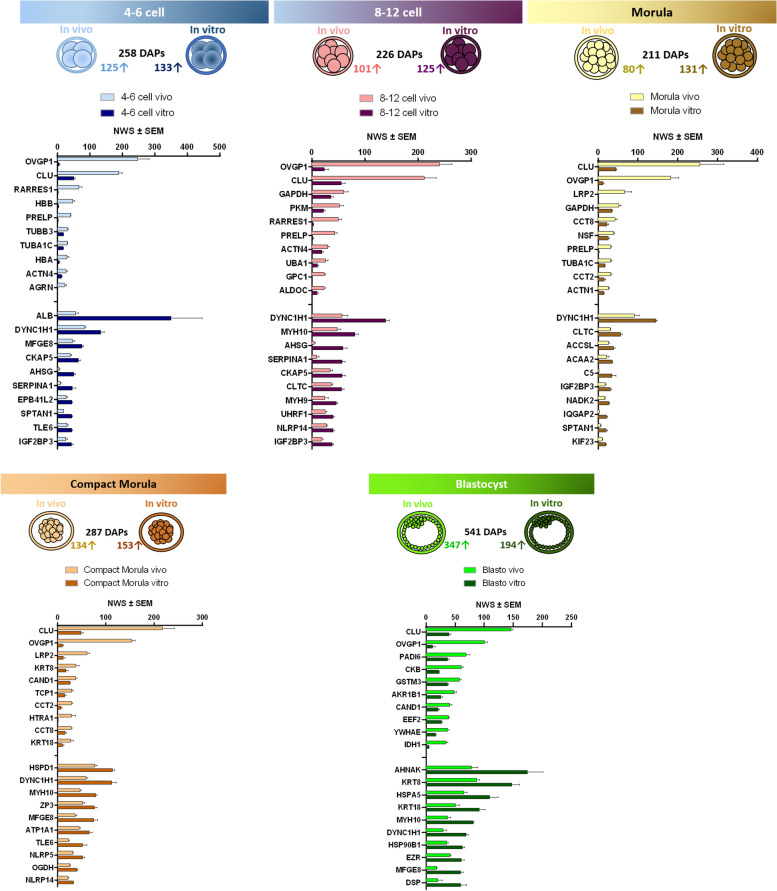
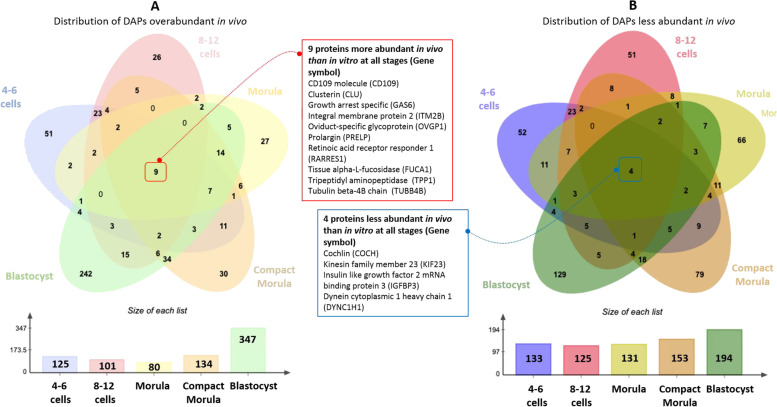
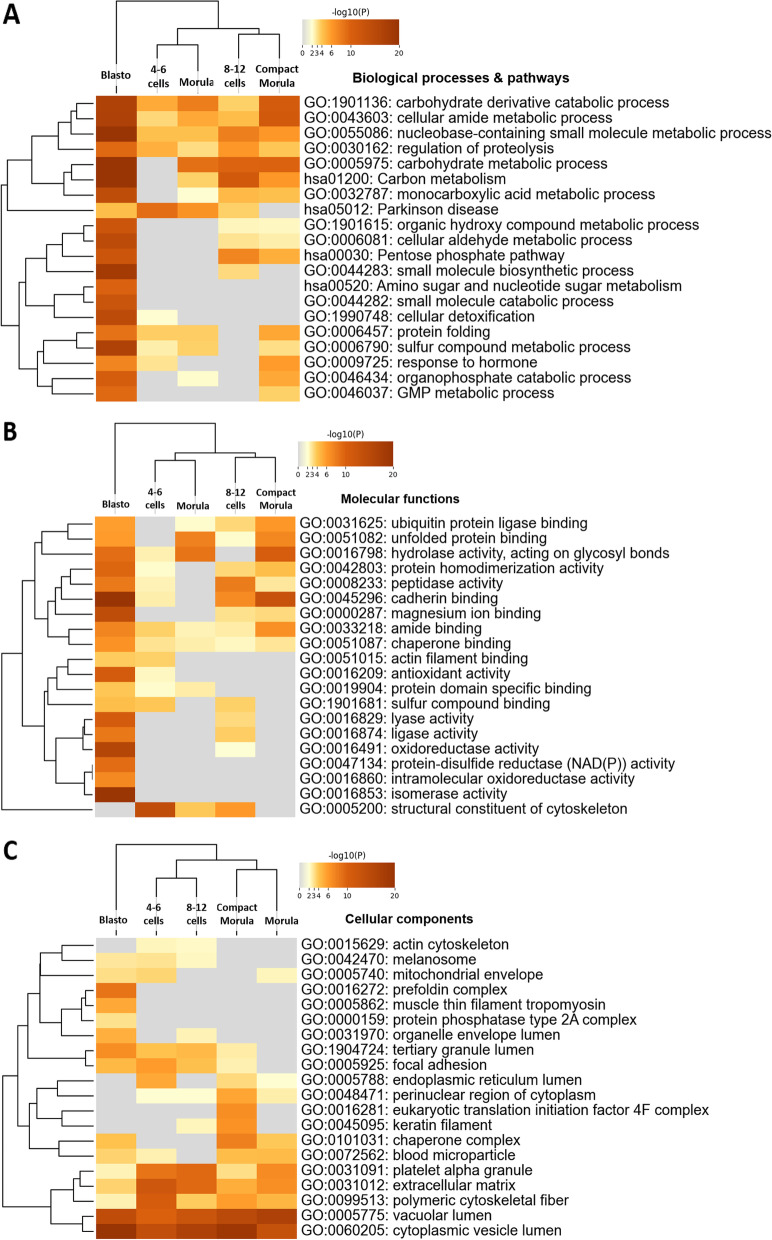
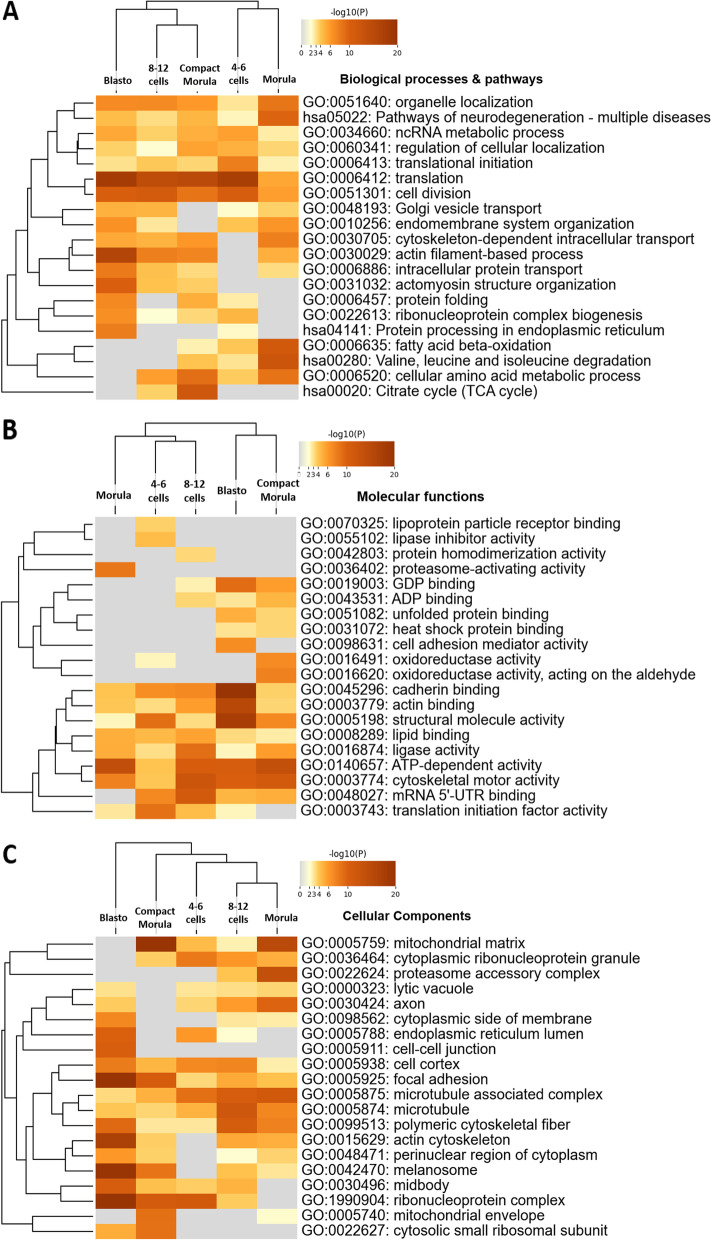
Results: A total of 38 pools of grade-1 quality bovine embryos at the 4-6 cell, 8-12 cell, morula, compact morula, and blastocyst stages developed either in vivo or in vitro were analyzed by nano-liquid chromatography coupled with label-free quantitative mass spectrometry, allowing for the identification of 3,028 proteins. Multivariate analysis of quantified proteins showed a clear separation of embryo pools according to their in vivo or in vitro origin at all stages. Three clusters of differentially abundant proteins (DAPs) were evidenced according to embryo origin, including 463 proteins more abundant in vivo than in vitro across development and 314 and 222 proteins more abundant in vitro than in vivo before and after the morula stage, respectively. The functional analysis of proteins found more abundant in vivo showed an enrichment in carbohydrate metabolism and cytoplasmic cellular components. Proteins found more abundant in vitro before the morula stage were mostly localized in mitochondrial matrix and involved in ATP-dependent activity, while those overabundant after the morula stage were mostly localized in the ribonucleoprotein complex and involved in protein synthesis. Oviductin and other oviductal proteins, previously shown to interact with early embryos, were among the most overabundant proteins after in vivo development.

Conclusions: The maternal environment led to higher degradation of mitochondrial proteins at early developmental stages, lower abundance of proteins involved in protein synthesis at the time of embryonic genome activation, and a global upregulation of carbohydrate metabolic pathways compared to in vitro production. Furthermore, embryos developed in vivo internalized large amounts of oviductin and other proteins probably originated in the oviduct as soon as the 4-6 cell stage. These data provide new insight into the molecular contribution of the mother to the developmental ability of early embryos and will help design better in vitro culture systems.

Keywords: Blastocyst; Cattle; Development; Embryo; Mass spectrometry; Morula; Oviduct; Proteomics.


Conflict of interest statement

The authors declare that that they have no competing interests.

Figures

Fig. 1
Fig. 1
Comparative analysis of proteins identified in bovine early embryos produced in vivo or in vitro. The Venn diagram indicates the overlap between origins at each stage, and the histograms in the bottom indicate the number of proteins identified in each pool of embryos
Fig. 2
Fig. 2
Principal component analysis of all embryo pools from the 4–6 cell to blastocyst stages. The 2,186 proteins quantified with a minimum of 2 normalized weighted spectra in at least one condition were considered. Scatter plots represent the position of each pool of embryos along the first two principal components. The variability between pools was mainly explained by their stage of development on the first horizontal dimension (Dim 1; 26.7% of variance) then by their origin (in vivo vs. in vitro) on the second vertical dimension (Dim 2; 11.0% of variance). The square in each ellipse represents the mean of data for a given condition, and colored ellipses represent the 95% confidence intervals
Fig. 3
Fig. 3
Heatmap and hierarchical clustering of differentially abundant proteins (DAPs) according to the origin of embryos. The 999 proteins with a p-value ≤ 0.050 after analysis of variance (ANOVA) were considered. Each line corresponds to one protein and each column to the normalized quantitative values of one embryo pool. The vertical grey line delimitates in vitro-derived embryos on the left from in vivo-derived embryos on the right. Red indicates higher abundance while blue indicates lower abundance compared with other conditions. Clusters of proteins identified after hierarchical clustering of data are delimited by colored vertical bars on the left and horizontal grey lines
Fig. 4
Fig. 4
Functional enrichment analysis of proteins found more abundant in vivo than in vitro across development (cluster 1). The Metascape bar graphs represent the top 20 clusters of enriched gene ontology (GO) terms for biological processes and KEGG pathways (A), molecular functions (B), and cellular components (C). Each row represents one enriched cluster, and the darker color of the bars indicates higher significance (lower p-value). A -log10(P) of 20 corresponds to a P-value of 10–20. See Table S3 for the complete list of GO terms with corresponding gene names and p-values
Fig. 5
Fig. 5
Functional analysis of proteins more abundant in vitro than in vivo after the morula stage (cluster 2). The Metascape bar graphs represent the top 20 clusters of enriched GO terms for biological processes and KEGG pathways (A), molecular functions (B), and cellular components (C). Each row represents one enriched cluster, and the darker color of the bars indicates higher significance (lower p-value). A -log10(P) of 20 corresponds to a P-value of 10–20. See Table S4 for the complete list of GO terms with corresponding gene names and p-values
Fig. 6
Fig. 6
Functional analysis of proteins more abundant in vitro than in vivo before the morula stage (cluster 3). The Metascape bar graphs represent the top 20 clusters of enriched GO terms for biological processes and KEGG pathways (A), molecular functions (B), and cellular components (C). Each row represents one enriched cluster, and the darker color of the bars indicates higher significance (lower p-value). A -log10(P) of 10 corresponds to a P-value of 10–10. See Table S5 for the complete list of GO terms with corresponding gene names and p-values
Fig. 7
Fig. 7
Top 20 DAPs after pairwise comparisons between in vivo and in vitro-derived embryos at each stage. Numbers of overabundant DAPs in vivo and in vitro (or less abundant DAPs in vitro and in vivo) are indicated beside the upward arrows. The histograms indicate the top 10 DAPs in each comparison. DAPs with a t-test p-value ≤ 0.05 and fold-change ratio ≥ 1.5 were considered
Fig. 8
Fig. 8
Distribution of proteins more (A) or less (B) abundant in vivo than in vitro. The Venn diagram indicates the overlap of DAPs between stages, and the histograms in the bottom indicate the number of DAPs at each stage. The frames indicate overabundant and less abundant DAPs, respectively, shared between all stages. DAPs with a t-test p-value ≤ 0.05 and fold-change ratio ≥ 1.5 were considered
Fig. 9
Fig. 9
Functional analysis of proteins more abundant in vivo than in vitro at each developmental stage. The Metascape heatmap plots represent the top 20 clusters of enriched GO terms of biological processes and KEGG pathways (A), molecular functions (B), and cellular components (C). Each row represents one enriched cluster, and the orange gradation reflects statistical significance (the darker the color, the more significant the p-value is). Gray color indicates a lack of significance. DAPs with a t-test p-value ≤ 0.05 and fold-change ratio ≥ 1.5 were considered
Fig. 10
Fig. 10
Functional analysis of proteins less abundant in vivo than in vitro at each developmental stage. The Metascape heatmap plots represent the top 20 clusters of enriched GO terms of biological processes and KEGG pathways (A), molecular functions (B), and cellular components (C). Each row represents one enriched cluster and the orange gradation reflects statistical significance (the darker the color, the more significant the p-value is). Gray color indicates a lack of significance. DAPs with a t-test p-value ≤ 0.05 and fold-change ratio ≥ 1.5 were considered

References

    1. Wyns C, De Geyter C, Calhaz-Jorge C, Kupka MS, Motrenko T, Smeenk J, Bergh C, Tandler-Schneider A, Rugescu IA, Vidakovic S, et al. ART in Europe, 2017: results generated from European registries by ESHRE. Hum Reprod Open. 2021;2021(3):1–17. - PMC - PubMed
    1. Ferre LB, Kjelland ME, Strobech LB, Hyttel P, Mermillod P, Ross PJ. Review: Recent advances in bovine in vitro embryo production: reproductive biotechnology history and methods. Animal. 2020;14(5):991–1004. doi: 10.1017/S1751731119002775. - DOI - PubMed
    1. Viana JHM. 2020 Statistics of embryo production and transfer in domestic farm animals. Embryo Technol Newsletter. 2021;39(4):1–14.
    1. Rizos D, Clemente M, Bermejo-Alvarez P, de La Fuente J, Lonergan P, Gutierrez-Adan A. Consequences of in vitro culture conditions on embryo development and quality. Reprod Domest Anim. 2008;43(Suppl 4):44–50. doi: 10.1111/j.1439-0531.2008.01230.x. - DOI - PubMed
    1. Ealy AD, Wooldridge LK, McCoski SR. BOARD INVITED REVIEW: Post-transfer consequences of in vitro-produced embryos in cattle. J Anim Sci. 2019;97(6):2555–2568. doi: 10.1093/jas/skz116. - DOI - PMC - PubMed

LinkOut - more resources