. 2022 Dec 17;17(1):83.
doi: 10.1186/s13024-022-00589-x.

Amyloid-beta and tau pathologies act synergistically to induce novel disease stage-specific microglia subtypes

Affiliations

Amyloid-beta and tau pathologies act synergistically to induce novel disease stage-specific microglia subtypes

Dong Won Kim et al. Mol Neurodegener. .

Abstract

Background: Amongst risk alleles associated with late-onset Alzheimer's disease (AD), those that converged on the regulation of microglia activity have emerged as central to disease progression. Yet, how canonical amyloid-β (Aβ) and tau pathologies regulate microglia subtypes during the progression of AD remains poorly understood.

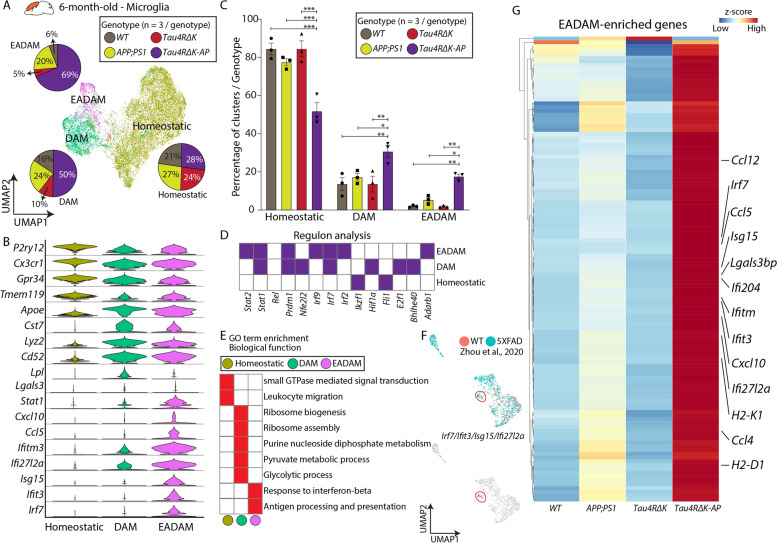
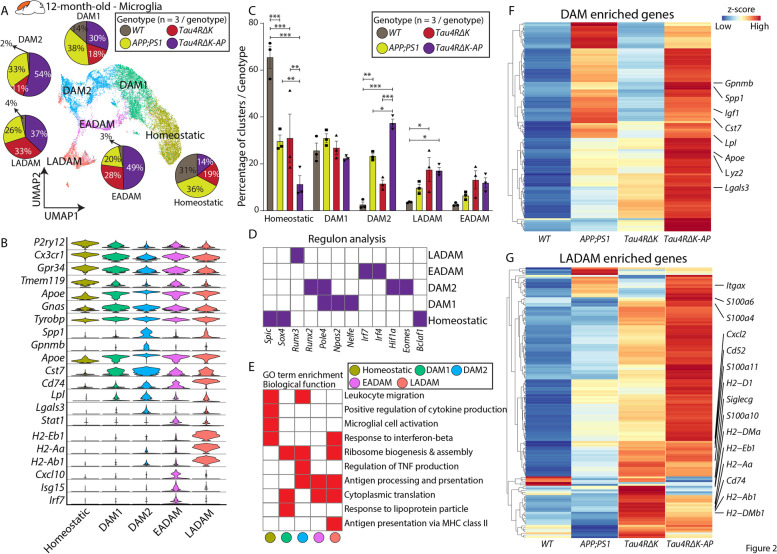
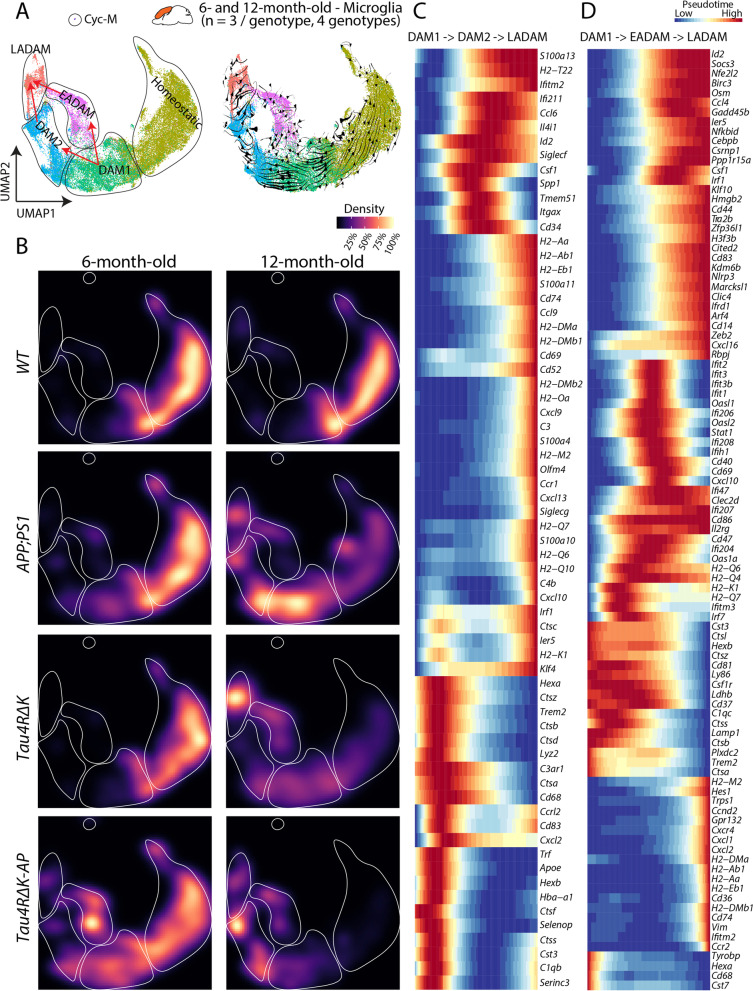
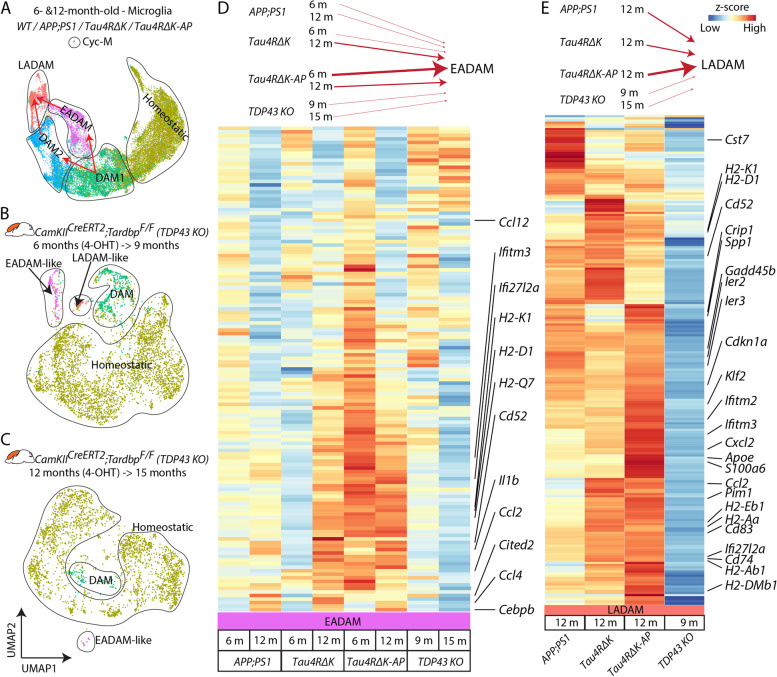
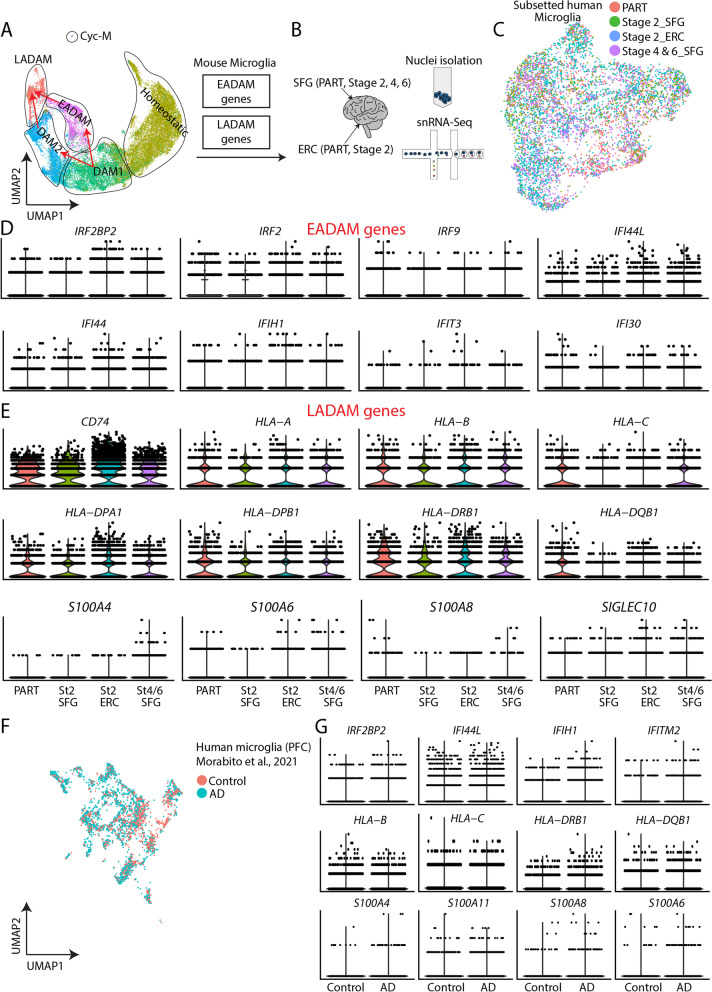
Methods: We use single-cell RNA-sequencing to profile microglia subtypes from mice exhibiting both Aβ and tau pathologies across disease progression. We identify novel microglia subtypes that are induced in response to both Aβ and tau pathologies in a disease-stage-specific manner. To validate the observation in AD mouse models, we also generated a snRNA-Seq dataset from the human superior frontal gyrus (SFG) and entorhinal cortex (ERC) at different Braak stages.

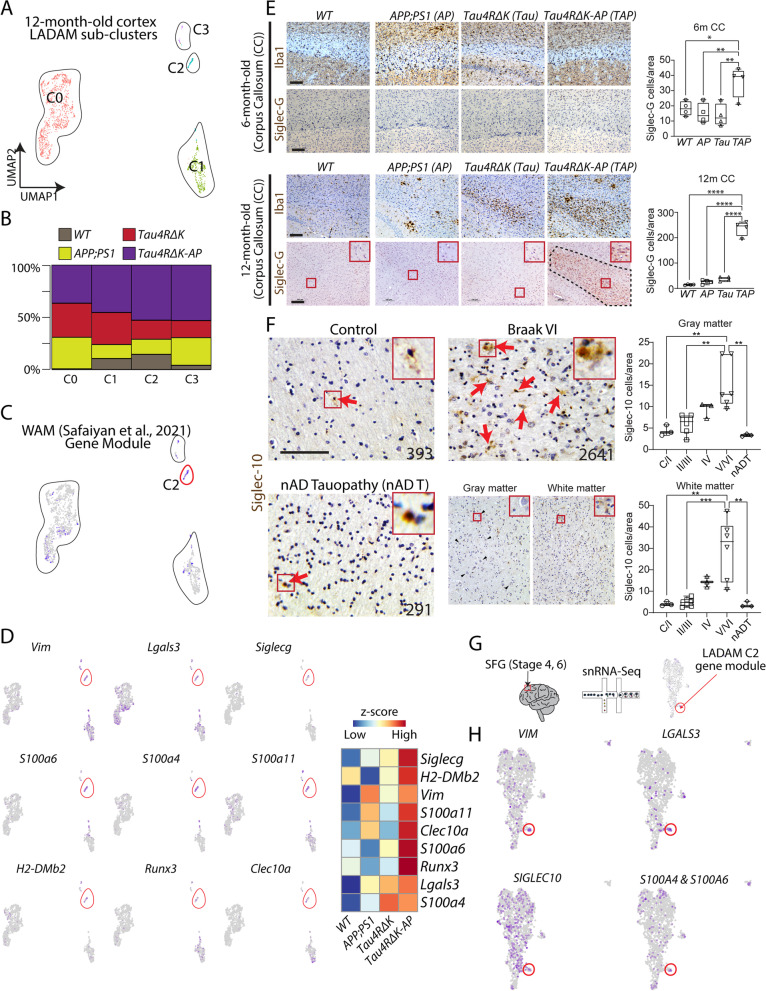
Results: We show that during early-stage disease, interferon signaling induces a subtype of microglia termed Early-stage AD-Associated Microglia (EADAM) in response to both Aβ and tau pathologies. During late-stage disease, a second microglia subtype termed Late-stage AD-Associated Microglia (LADAM) is detected. While similar microglia subtypes are observed in other models of neurodegenerative disease, the magnitude and composition of gene signatures found in EADAM and LADAM are distinct, suggesting the necessity of both Aβ and tau pathologies to elicit their emergence. Importantly, the pattern of EADAM- and LADAM-associated gene expression is observed in microglia from AD brains, during the early (Braak II)- or late (Braak VI/V)- stage of the disease, respectively. Furthermore, we show that several Siglec genes are selectively expressed in either EADAM or LADAM. Siglecg is expressed in white-matter-associated LADAM, and expression of Siglec-10, the human orthologue of Siglecg, is progressively elevated in an AD-stage-dependent manner but not shown in non-AD tauopathy.

Conclusions: Using scRNA-Seq in mouse models bearing amyloid-β and/or tau pathologies, we identify novel microglia subtypes induced by the combination of Aβ and tau pathologies in a disease stage-specific manner. Our findings suggest that both Aβ and tau pathologies are required for the disease stage-specific induction of EADAM and LADAM. In addition, we revealed Siglecs as biomarkers of AD progression and potential therapeutic targets.

Keywords: Alzheimer’s disease (AD); Amyloid-β (Aβ); Microglia; Sialic acid-binding immunoglobulin-type lectin (Siglec); Tau.


Conflict of interest statement

S.B. receives research support from Genentech, is a co-founder and scientific advisory board member of CDI Labs LLC, and is/was a consultant for Third Rock Ventures and Tenpoint Therapeutics.

Figures

Fig. 1
Fig. 1
The microglia subtype EADAM is observed in the Tau4RΔK-AP mice in the 6-month-old cortex. A UMAP plot showing microglia clusters—Homeostatic, DAM, and EADAM, across 4 genotypes in 6-month-old cortex (n = 3/genotype), and pie graphs showing the distribution of 3 microglia clusters across genotypes (n = 3/genotype). B Violin plots showing top cluster genes of 3 microglia clusters. C Bar graphs showing the distribution of 3 microglia clusters within each genotype (n = 3/genotype). Note the significant increase in the EADAM cluster in Tau4RΔK-AP mice. D Regulon analysis with SCENIC [40], showing key regulons in each microglia cluster. E GO analysis of top differential genes reveals a biological function in each microglial cluster. F UMAP plots of 7-month-old 5XFAD mice in Zhou et al. 2020 [23] (top) and a small cluster of cells (red circle) expressing a few EADAM-enriched markers (bottom). G Heatmap showing expression of EADAM-enriched genes across genotypes. * P < 0.05, ** P < 0.005, *** P < 0.0001
Fig. 2
Fig. 2
The microglia subtype LADAM is observed in the Tau4RΔK-AP mice in the 12-month-old cortex. A UMAP plot showing microglia clusters—Homeostatic, DAM1, DAM2, EADAM, and LADAM, across 4 genotypes in 12-month-old cortex (n = 3/genotype), and pie graphs showing the distribution of 4 microglia clusters across genotypes (n = 3/genotype). B Violin plots showing top cluster genes of 3 microglia clusters. C Bar graphs showing the distribution of 5 microglia clusters within each genotype (n = 3/genotype). Note the significant increase in the LADAM cluster in Tau4RΔK-AP mice. D Regulon analysis with SCENIC [40], showing key regulons in each microglia cluster. E GO analysis of top differential genes reveals a biological function in each microglia cluster. F Heatmap showing expression of DAM-enriched genes across genotypes. G Heatmap showing expression of LADAM-enriched genes across genotypes. * P < 0.05, ** P < 0.005, *** P < 0.0001
Fig. 3
Fig. 3
The emergence of disease stage-dependent microglia subtypes coincides with Aβ and tau deposition. A UMAP plot showing microglia clusters in the 6- and 12-month-old cortex (all genotypes) (left) and UMAP plot with RNA velocity (right) showing 2 potential transitions between DAM1 and LADAM, with transitions into EADAM and/or DAM2 in between. B UMAP plot showing the density of the captured microglia clusters across genotypes in the 12-month-old cortex. C Pseudotime analysis showing gene expression changes between DAM1, DAM2, and LADAM. D Pseudotime analysis showing gene expression changes between DAM1, EADAM, and LADAM
Fig. 4
Fig. 4
Analysis of EADAM and LADAM markers in other mouse models of neurodegenerative disease. A UMAP plot showing microglia clusters in the 6 and 12-month-old cortex (all genotypes) (Fig. 3A left panel). B UMAP plot showing microglia clusters in CamKIICreERT2;Tardbplox/lox (TDP43 KO), 4-OHT induction at 6 months and collected at 9 months. N = 2. C UMAP plot showing microglia clusters in CamKIICreERT2;Tardbplox/lox (TDP43 KO), 4-OHT induction at 12 months and collected at 15 months. N = 2. D Heatmap plot showing expression of EADAM-enriched genes across AD genotypes and in TDP43 KO. E Heatmap plot showing expression of LADAM-enriched genes across AD genotypes and in TDP43 KO
Fig. 5
Fig. 5
6-month-old EADAM at and 12-month-old LADAM clusters in Tau4RΔK-AP mice resemble microglial subtypes seen in snRNA-Seq from AD samples. A UMAP plot showing microglia clusters in the 6 and 12-month-old cortex (all genotypes) from Fig. 3A. EADAM and LADAM-enriched gene homologs were studied in human snRNA-Seq. B Schematic showing snRNA-Seq from human postmortem samples, primary age-related tauopathy (PART) entorhinal cortex (ERC), superior frontal gyrus (SFG); Stage 2 ERC, SFG; Stage 4 SFG; Stage 6 SFG. C UMAP plot showing the distribution of subsetted microglia from human snRNA-Seq. N = 2 (PART, 1102 cells), n = 2 (Stage 2 SFG, 750 cells), n = 2 (Stage 2 ERC, 2645 cells), n = 4 (Stage 4 and 6 SFG, 1692 cells). D Violin plots showing expression of EADAM-like interferon family members. E Violin plots showing expressions of LADAM-like MHC and S100 family members. F UMAP plot showing microglia from human snRNA-Seq dataset from Morabito et al., 2021. N = 7 (Control, 1384 cells), n = 11 (AD, 2742 cells). G Violin plots showing IFN, MHC, and S100 family members in the dataset from Morabito et al., 2021
Fig. 6
Fig. 6
A LADAM subcluster is observed in white-matter-associated microglia. A UMAP plot of 12-month-old ‘LADAM’. B Bar plot showing the distribution of 4 genotypes across 4 LADAM clusters. C UMAP plot of LADAM, showing a small cluster (C2, purple-colored cells) that resemble WAM gene modules [25]. D UMAP plots showing gene expressions that are highly enriched genes, including WAM genes (Vim and Lgals3) in the LADAM C2 cluster (left), and heatmap showing expression of WAM gene modules in C2 across genotypes (right). E Iba1 and Siglec-G immunostaining (left) and quantification (right) in 6-month-old (top) and 12-month-old (bottom) corpus callosum in WT, APP;PS1, Tau4RΔK, and Tau4RΔK-AP. F Siglec-10 immunostaining in human cortex in control, Braak stage 6, and nAD tauopathy (numbers on figure panels indicate BRC# In Table S11, immunostaining of other Braak stages are shown in Fig S15), with bar graphs showing quantification of Siglec-10 positive cells in gray (top) and white (bottom) matter. G Schematic showing human snRNA-Seq on Stage 4 and 6 SFG (left) and UMAP plot showing LADAM C2 enriched gene module (right). H UMAP plots showing expression of LADAM C2 cluster markers in human snRNA-Seq. Red boxes show high magnification views. CC = Corpus Callosum. Scale bars = 100 μm. * P < 0.05, ** P < 0.01, *** P < 0.001

References

    1. Bohlen CJ, Friedman BA, Dejanovic B, Sheng M. Microglia in brain development, homeostasis, and neurodegeneration. Annu Rev Genet. 2019;53:263–288. doi: 10.1146/annurev-genet-112618-043515. - DOI - PubMed
    1. Hickman S, Izzy S, Sen P, Morsett L, El Khoury J. Microglia in neurodegeneration. Nat Neurosci. 2018;21:1359–1369. doi: 10.1038/s41593-018-0242-x. - DOI - PMC - PubMed
    1. 2021 Alzheimer’s disease facts and figures. Alzheimers Dement. 2021;17(3):327–406. 10.1002/alz.12328. - PubMed
    1. Bekris LM, Yu C-E, Bird TD, Tsuang DW. Genetics of Alzheimer disease. J Geriatr Psychiatry Neurol. 2010;23:213–227. doi: 10.1177/0891988710383571. - DOI - PMC - PubMed
    1. Saunders AM, Strittmatter WJ, Schmechel D, George-Hyslop PH, Pericak-Vance MA, Joo SH, et al. Association of apolipoprotein E allele epsilon 4 with late-onset familial and sporadic Alzheimer’s disease. Neurology. 1993;43:1467–1472. doi: 10.1212/WNL.43.8.1467. - DOI - PubMed

Publication types

LinkOut - more resources