. 2022 Dec;12(12):e1146.
doi: 10.1002/ctm2.1146.

Loss of G0/G1 switch gene 2 (G0S2) promotes disease progression and drug resistance in chronic myeloid leukaemia (CML) by disrupting glycerophospholipid metabolism

Affiliations

Loss of G0/G1 switch gene 2 (G0S2) promotes disease progression and drug resistance in chronic myeloid leukaemia (CML) by disrupting glycerophospholipid metabolism

Mayra A Gonzalez et al. Clin Transl Med. 2022 Dec.

Abstract

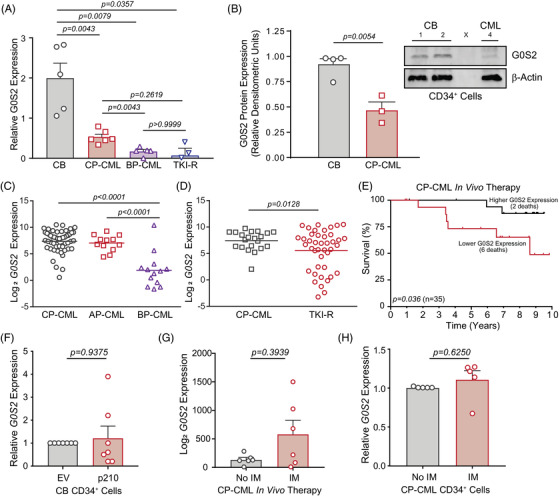
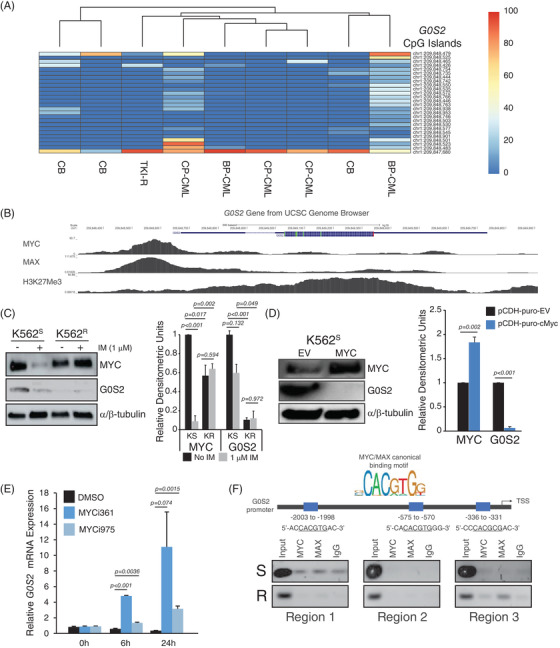
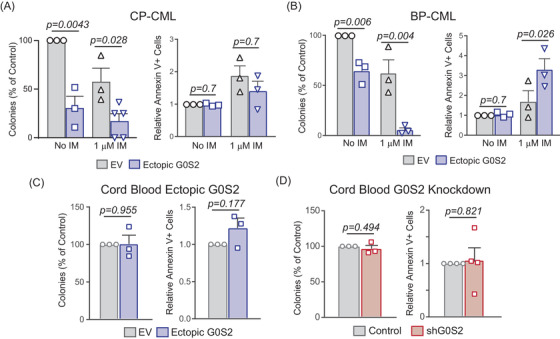
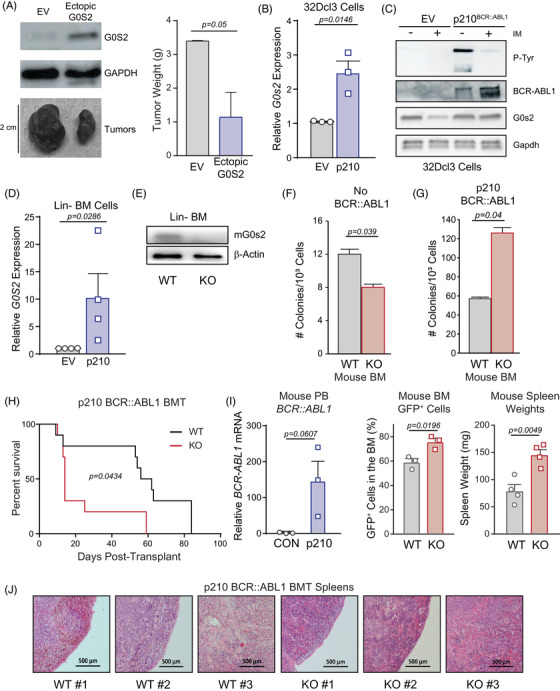
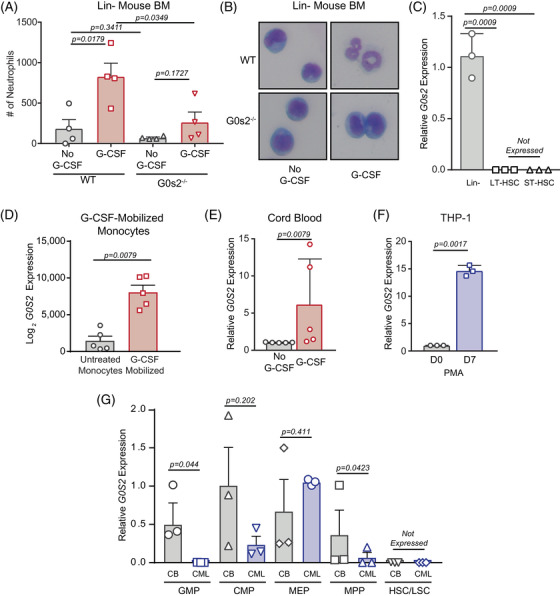
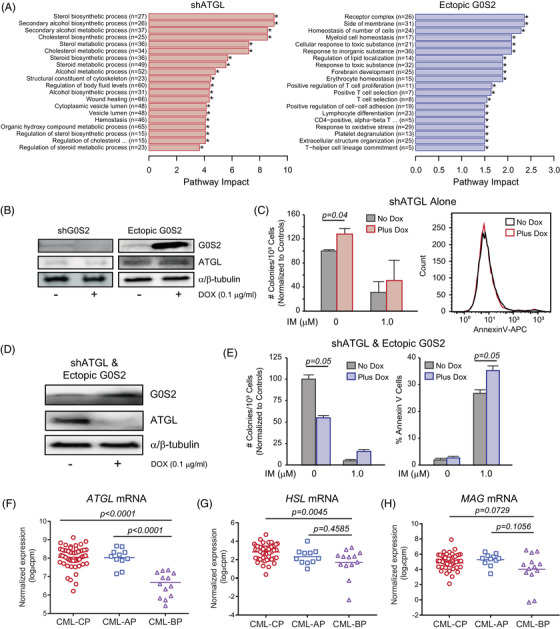
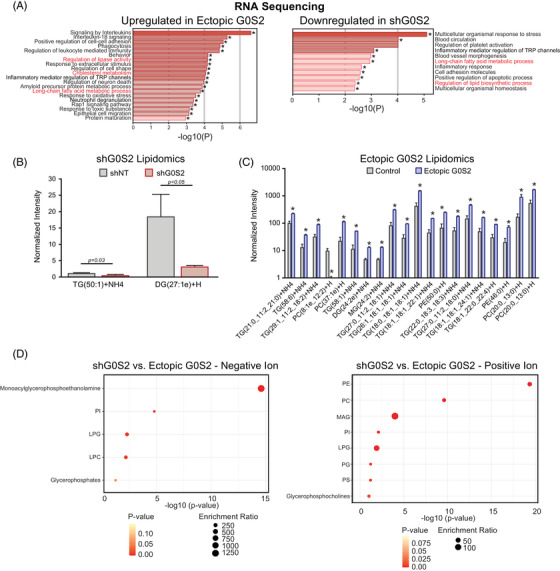
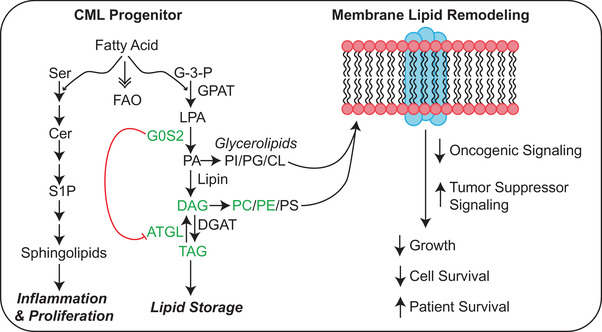
Tyrosine kinase inhibitors (TKIs) targeting BCR::ABL1 have turned chronic myeloid leukaemia (CML) from a fatal disease into a manageable condition for most patients. Despite improved survival, targeting drug-resistant leukaemia stem cells (LSCs) remains a challenge for curative CML therapy. Aberrant lipid metabolism can have a large impact on membrane dynamics, cell survival and therapeutic responses in cancer. While ceramide and sphingolipid levels were previously correlated with TKI response in CML, the role of lipid metabolism in TKI resistance is not well understood. We have identified downregulation of a critical regulator of lipid metabolism, G0/G1 switch gene 2 (G0S2), in multiple scenarios of TKI resistance, including (1) BCR::ABL1 kinase-independent TKI resistance, (2) progression of CML from the chronic to the blast phase of the disease, and (3) in CML versus normal myeloid progenitors. Accordingly, CML patients with low G0S2 expression levels had a worse overall survival. G0S2 downregulation in CML was not a result of promoter hypermethylation or BCR::ABL1 kinase activity, but was rather due to transcriptional repression by MYC. Using CML cell lines, patient samples and G0s2 knockout (G0s2-/- ) mice, we demonstrate a tumour suppressor role for G0S2 in CML and TKI resistance. Our data suggest that reduced G0S2 protein expression in CML disrupts glycerophospholipid metabolism, correlating with a block of differentiation that renders CML cells resistant to therapy. Altogether, our data unravel a new role for G0S2 in regulating myeloid differentiation and TKI response in CML, and suggest that restoring G0S2 may have clinical utility.

Keywords: G0/G1 switch gene 2 (G0S2); chronic myeloid leukaemia (CML); glycerophospholipid metabolism; tyrosine kinase inhibitor (TKI) resistance.


Conflict of interest statement

B.J.D. serves on scientific advisory boards for Aileron Therapeutics, Therapy Architects (ALLCRON), Cepheid, Vivid Biosciences, Celgene, RUNX1 Research Program, Novartis, Gilead Sciences (inactive), Monojul (inactive); serves on Scientific Advisory Boards and receives stock from Aptose Biosciences, Blueprint Medicines, EnLiven Therapeutics, Iterion Therapeutics, Third Coast Therapeutics, GRAIL (inactive on scientific advisory board); is scientific founder of MolecularMD (inactive, acquired by ICON); serves on the board of directors and receives stock from Amgen, Vincera Pharma; serves on the board of directors for Burroughs Wellcome Fund, CureOne; serves on the joint steering committee for Beat AML LLS; is founder of VB Therapeutics; has a sponsored research agreement with EnLiven Therapeutics; receives clinical trial funding from Novartis, Bristol‐Myers Squibb, Pfizer. The remaining authors have no competing financial interests.

Figures

FIGURE 1
FIGURE 1
G0/G1 switch gene 2 (G0S2) is downregulated in chronic myeloid leukaemia (CML) disease progression and imatinib resistance in a BCR::ABL1 kinase‐independent manner. (A) Bar graph shows G0S2 mRNA levels as quantified by reverse transcription‐quantitative polymerase chain reaction (RT‐qPCR) on primary CD34+ cells from human cord blood (CB) (n = 5), chronic phase CML (CP‐CML) (n = 6), blast phase CML (BP‐CML) (n = 5) and tyrosine kinase inhibitor‐resistant (TKI‐R) patients harbouring native BCR::ABL1 (n = 3). (B) G0S2 protein levels were analysed by immunoblot on primary CD34+ cells from human CB (n = 4) versus CP‐CML patients (n = 3). β‐Actin was analysed as a loading control. Bar graph represents relative densitometric units for primary cell immunoblot data. (C and D) Dot plots from RNAseq data demonstrate reduced G0S2 mRNA levels in mononuclear cells from BP‐CML (n = 13) compared with CP‐CML (n = 53) and accelerated phase CML (AP‐CML) (n = 12) patients (C), and in TKI‐resistant (n = 42) compared with newly diagnosed (n = 21) CP‐CML patients (D). (E) Kaplan–Meier curve shows relative overall survival (OS) of newly diagnosed CP‐CML patients (n = 35) with G0S2 mRNA expression in CD34+ cells (prior to imatinib therapy) above (high, n = 18) or below (low, n = 17) the value at a bimodal separation. (F) Bar graph shows relative G0S2 mRNA levels in CB CD34+ cells engineered for p210 BCR::ABL1 ectopic expression (n = 7) versus the empty vector (EV) control (n = 7). (G) Bar graph demonstrates published microarray data showing G0S2 mRNA expression levels in CP‐CML CD34+ cells before and after in vivo imatinib (IM) therapy (400 mg daily) for 7 days (n = 6) (https://www.ncbi.nlm.nih.gov/geoprofiles, GDS3518, 213524_s_at, p = .3939). (H) Bar graph shows G0S2 mRNA expression in primary CP‐CML CD34+ cells (n = 5) cultured ex vivo ± IM (1 µM, 24 h) as assessed by RT‐qPCR. GUS mRNA levels were used as a loading control. Error bars represent standard error of the mean (SEM).
FIGURE 2
FIGURE 2
MYC/MAX mediates transcriptional repression of G0/G1 switch gene 2 (G0S2) in tyrosine kinase inhibitor‐resistant (TKI‐R) chronic myeloid leukaemia (CML). (A) The heat map represents CpG dinucleotide methylation in the G0S2 promoter region as detected by DNA bisulphite conversion and patch polymerase chain reaction (PCR) sequencing on DNA of CD34+ cells from cord blood (CB) (n = 3) and CML patients (n = 6). (B) Tracks from the University of California at Santa Cruz Genome Browser (https://genome.ucsc.edu/) show a high degree of binding by MYC and MAX at the human G0S2 promoter in K562 cells. (C) Immunoblot shows elevated MYC and decreased G0S2 protein expression in TKI‐R K562R cells compared with TKI‐sensitive K562S controls in the presence of imatinib (IM, 1 µM, 24 h). α/β‐Tubulin was assessed as a loading control. Bar graph represents relative densitometric units for n = 3 replicates of the experiment. (D) Immunoblot shows the level of MYC and G0S2 protein in K562S cells engineered for MYC overexpression. α/β‐Tubulin was assessed as a loading control. Bar graph represents the relative densitometric units for n = 3 replicates of the experiment. (E) Bar graph shows relative G0S2 mRNA expression in K562 cells treated with the MYC inhibitors, MYCi361 or MYCi975 (6 µM) for 0, 6 and 24 h. (F) MYC consensus binding sites were mapped onto the G0S2 promoter, and the presence of MYC or MAX at the relevant site was detected by chromatin immunoprecipitation (ChIP)‐PCR (n = 3). Error bars represent standard error of the mean (SEM). BP‐CML, blast phase CML; CP‐CML, chronic phase CML; EV, empty vector
FIGURE 3
FIGURE 3
G0/G1 switch gene 2 (G0S2) acts as a tumour suppressor in primary chronic myeloid leukaemia (CML) CD34+ cells by impairing survival without affecting apoptosis. (A and B) Primary CD34+ cells isolated from chronic phase CML (CP‐CML) (A, n = 5) or blast phase CML (BP‐CML)/tyrosine kinase inhibitor (TKI)‐resistant (B, n = 3) patients were lentivirally transduced for ectopic G0S2 expression followed by colony formation (left) and apoptosis (right) assays. (C and D) Primary CD34+ cells isolated from normal cord blood (CB) (n = 3) were lentivirally transduced for G0S2 ectopic expression (C) or knockdown (D) followed by colony formation (left) and apoptosis (right) assays. Error bars represent standard error of the mean (SEM). EV, empty vector; IM, imatinib
FIGURE 4
FIGURE 4
Altered G0/G1 switch gene 2 (G0S2) expression impairs growth of chronic myeloid leukaemia (CML) cells in vivo. (A) K562 cells were lentivirally transduced for ectopic G0S2 expression versus the empty vector (EV) control, and 3 × 10⁶ resulting cells were injected subcutaneously into the rear flanks of 6–8‐week‐old nude mice (n = 3 per group). Image shows relative size of subcutaneous tumours excised from recipient mice, and immunoblot analyses confirmed ectopic G0S2 expression at the protein level in vivo. Bar graph shows the tumour weight (g) for n = 3 replicates of the experiment. (B and C) Reverse transcription‐quantitative polymerase chain reaction (RT‐qPCR) (B) and immunoblot (C) analyses demonstrate murine G0s2 mRNA and protein levels, respectively, in 32Dcl3 myeloid precursors upon ectopic expression of p210BCR::ABL1. (D) Similarly, RT‐qPCR shows G0s2 mRNA in lineage‐negative mouse bone marrow (BM) upon ectopic expression of p210BCR::ABL1. (E) Immunoblot shows murine G0s2 protein levels in lineage‐negative mouse BM from wild‐type (WT) versus G0s2−/− [knockout (KO)] mice. β‐Actin was assessed as a loading control. (F and G) Lineage‐negative mouse BM from WT or G0s2−/− mice were either plated directly in colony formation assays (F) or were retrovirally transduced with p210BCR::ABL1 followed by plating in colony formation assays (G). Bar graphs represent the number of colonies per 1000 cells. (H) Lineage‐negative mouse BM from WT or G0s2−/− mice were retrovirally transduced with p210BCR::ABL1 followed by intravenous injection into lethally irradiated recipients (n = 10 per group). Survival over time is shown in the Kaplan–Meier curve. (I) RT‐qPCR confirmed BCR::ABL1 mRNA expression in the peripheral blood of recipient mice (left). Bar graphs show GFP+BCR::ABL1+ cells comparing recipients of WT versus G0S2−/− BM cells (middle), as well as spleen weights of moribund mice after euthanasia (right). (J) Images show spleen morphology as assessed by haematoxylin and eosin staining at 4 weeks post‐transplant (n = 3 per group). Error bars represent standard error of the mean (SEM). BMT, bone marrow transplantation; EV, empty vector; PB, peripheral blood
FIGURE 5
FIGURE 5
G0/G1 switch gene 2 (G0S2) expression correlates with myeloid development, and reduced expression in chronic myeloid leukaemia (CML) occurs within the granulocyte–macrophage progenitor (GMP) population. (A and B) Bar graph shows the number (#) of neutrophils counted in Wright–Geimsa stains of lineage‐negative (Lin) mouse bone marrow (BM) from wild‐type or G0s2−/− mice induced towards neutrophil differentiation with murine granulocyte‐colony stimulating factor (mG‐CSF) (A). The image shows representative morphology for the indicated treatment conditions (B). (C) Bar graph represents relative G0s2 mRNA expression in the bulk Lin BM fraction compared with sorted long‐term (LT) and short‐term (ST) haematopoietic stem cells (HSCs) (n = 3). (D) Bar graph shows G0S2 mRNA expression in haematopoietic cells after in vivo mobilisation with G‐CSF for 7 days (GSE1746, n = 5). (E and F) Bar graphs show G0S2 mRNA expression in cord blood (CB) CD34+ cells induced to differentiate with human G‐CSF (hG‐CSF) (E, n = 5), or THP‐1 cells induced to differentiate with phorbol 12‐myristate 13‐acetate (PMA) for 7 days (F, n = 3). (G) Bar graph shows relative G0S2 mRNA expression in CD34+ cells from normal CB (n = 3, left) or chronic phase CML (CP‐CML) patients (n = 3, right) that were sorted for GMPs, common myeloid progenitors (CMPs), megakaryocyte–erythrocyte progenitors (MEPs), multipotent progenitors (MPPs) or HSCs based on cell surface molecule expression. G0S2 mRNA expression was universally low in normal HSCs and CP‐CML leukaemic stem cells (LSCs), and significantly reduced in CP‐CML versus CB GMPs. Error bars represent standard error of the mean (SEM).
FIGURE 6
FIGURE 6
The effect of G0/G1 switch gene 2 (G0S2) on survival is independent of its known function as an inhibitor of adipose triglyceride lipase (ATGL). (A) Bar graphs show Gene Ontology (GO) analysis for the pathways dysregulated in K562S cells upon ATGL knockdown (left) or ectopic G0S2 expression (right) compared with controls by RNA sequencing (n = 2). * p < .05. (B) Immunoblots show G0S2 and ATGL protein levels in K562S cells upon ectopic G0S2 expression or knockdown ± doxycycline (DOX) (0.1 µg/ml, 72 h). α/β‐Tubulin was assessed as a loading control. (C) Bar graph represents colony forming ability of K562‐shATGL cells ± DOX and ± imatinib (IM) (1 µM, left). The representative histogram shows the effect of shATGL on apoptosis of K562 cells in vitro (right). (D and E) K562S cells were engineered for simultaneous DOX‐inducible ATGL knockdown and ectopic G0S2 expression. Protein levels were confirmed by immunoblot analysis (D) and subject to colony formation (E, left) and apoptosis assays (E, right). (F and H) Dot plots from RNA sequencing data demonstrated reduced ATGL (F), hormone‐sensitive lipase (HSL) (G) and monoacylglycerol lipase (MAG) (H) mRNA levels in mononuclear cells from blast phase chronic myeloid leukaemia (BP‐CML) (n = 14) compared with chronic phase CML (CP‐CML) (n = 53) and/or accelerated phase CML (AP‐CML) (n = 11) patients. Error bars represent standard error of the mean (SEM).
FIGURE 7
FIGURE 7
Loss of G0/G1 switch gene 2 (G0S2) expression in chronic myeloid leukaemia (CML) promotes the accumulation of very long‐chain unsaturated fatty acids and altered glycerophospholipid metabolism. (A) Bar graphs show Gene Ontology (GO) analysis for the pathways that are upregulated upon G0S2 ectopic expression (left) or downregulated upon G0S2 knockdown (right) in K562S cells by RNA sequencing. * p < .05. Consistent pathways are indicated in red. (B and C) K562 cells expressing either the non‐targeting control vector (shNT), shRNA targeting G0S2 (shG0S2), or ectopic G0S2 were analysed by untargeted liquid chromatography (LC)/mass spectrometry (MS)‐based lipidomics. shG0S2 resulted in a reduction of very long‐chain di‐ and triglycerides (B). Ectopic G0S2 promoted the accumulation of triglycerides as well as several cell membrane components, including phosphatidylcholine (PC) and phosphatidylethanolamine (PE) species (C). (D) Lipid pathway enrichment was performed based on KEGG databases comparing K562S cells with G0S2 ectopic expression or knockdown. DAG, diacylglycerol; LPC, lysophosphatidylcholine; LPG, lysophosphatidylglycerol; MAG, monoacylglycerol; PG, phosphatidylglycerol; PI, phosphatidylinositol; PS, phosphatidylserine; TAG, triacylglycerol
FIGURE 8
FIGURE 8
Proposed model for G0/G1 switch gene 2 (G0S2) tumour suppressor activity in chronic myeloid leukaemia (CML). The schematic shows the effect of G0S2 on triaclyglyceride (TAG) accumulation both indirectly through adipose triglyceride lipase (ATGL) inhibition, and directly through lysophosphatidic acid acyltransferase (LPAAT) activity. As ectopic G0S2 resulted in the accumulation of diacylglycerides (DAGs), TAGs, and species of phosphatidylcholine (PC) and phosphatidylethanolamine (PE) (Figure 7), our data suggest that G0S2 contributes to lipid homeostasis either by increasing TAG stores or by inducing membrane lipid remodelling. Pathway enrichment analysis of our K562 lipidomics data demonstrated that the lipid pathways affected most by differential G0S2 expression included glycerophospholipid metabolism, autophagy, glycosylphosphatidylinositol (GPI)‐anchor biosynthesis, ferroptosis and choline metabolism in cancer (Figure S9A,B). However, more work needs to be done to determine where these lipid species are being incorporated.

Similar articles

Cited by

References

    1. Nowell PC, Hungerford D. A minute chromosome in human chronic granulocytic leukemia. Science. 1960;132:1497. - PubMed
    1. Druker BJ, Guilhot F, O'Brien SG, et al. Five‐year follow‐up of patients receiving imatinib for chronic myeloid leukemia. N Engl J Med. 2006;355(23):2408‐2417. - PubMed
    1. Calabretta B, Perrotti D. The biology of CML blast crisis. Blood. 2004;103(11):4010‐4022. - PubMed
    1. O'Hare T, Zabriskie MS, Eiring AM, Deininger MW. Pushing the limits of targeted therapy in chronic myeloid leukaemia. Nat Rev Cancer. 2012;12(8):513‐526. - PubMed
    1. Graham SM, Jorgensen HG, Allan E, et al. Primitive, quiescent, Philadelphia‐positive stem cells from patients with chronic myeloid leukemia are insensitive to STI571 in vitro. Blood. 2002;99(1):319‐325. - PubMed

Publication types

MeSH terms