. 2023 Feb;97(2):e13245.
doi: 10.1111/sji.13245. Epub 2022 Dec 30.

Galectin-3 interacts with PD-1 and counteracts the PD-1 pathway-driven regulation of T cell and osteoclast activity in Rheumatoid Arthritis

Affiliations

Galectin-3 interacts with PD-1 and counteracts the PD-1 pathway-driven regulation of T cell and osteoclast activity in Rheumatoid Arthritis

Kathrine Pedersen et al. Scand J Immunol. 2023 Feb.

Abstract

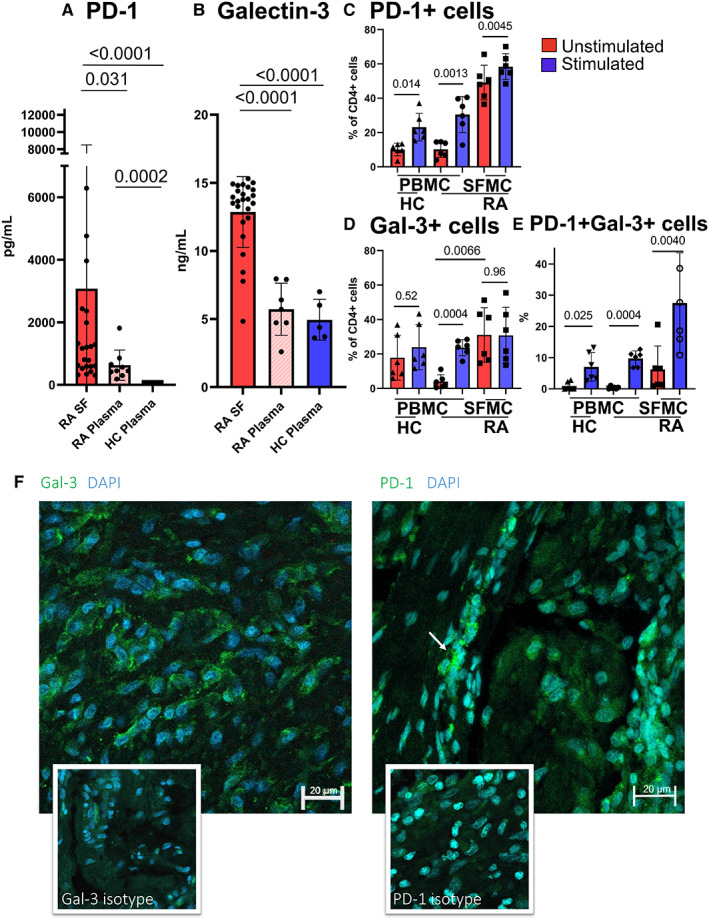
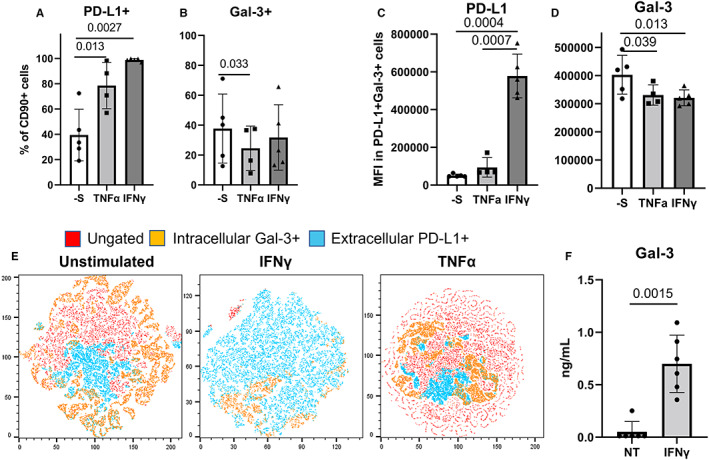
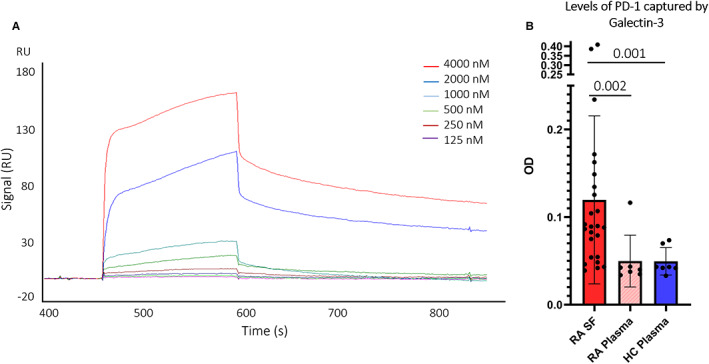
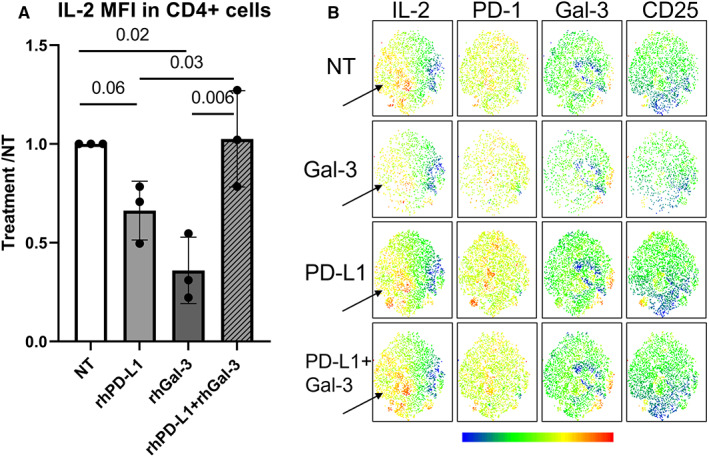
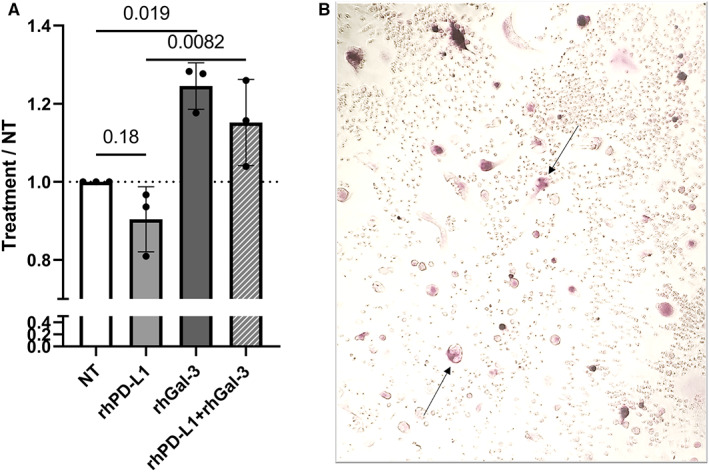
Rheumatoid arthritis (RA) is an autoimmune disease characterized by joint inflammation and bone erosions. The glycosylated programmed death-1 (PD-1) receptor plays an important role in regulating immune responses and maintaining tolerance. In this study, we focus on two features observed in RA: impaired PD-1 signalling and Galectin-3 (Gal-3) upregulation. We hypothesize that Gal-3 binds PD-1 and PD-1 ligands, potentially contributing to impaired PD-1 signalling. PD-1 and Gal-3 levels in RA synovial fluid (SF) and plasma were evaluated by ELISA. PD-1 and Gal-3 interaction was examined by Surface Plasmon Resonance and ELISA. PD-1, PD-L1 and Gal-3 expression on mononuclear cells from SF and peripheral blood as well as fibroblast-like synoviocytes were examined by flow cytometry. Effects of Gal-3 and PD-L1 on osteoclast formation was evaluated by tartrate-resistant acid phosphatase assay. We show that Gal-3 binds PD-1 and PD-L1. Results demonstrated high expression of PD-1 and Gal-3 on mononuclear cells, especially from SF. Gal-3 inhibited PD-1 signalling when PD-L1 was present. Furthermore, a role of Gal-3 in osteoclast formation was observed in vitro, both directly but also through PD-1:PD-L1 inhibition. Effects of Gal-3 on the PD-1 signalling axis are proposed to be inhibitory, meaning high Gal-3 levels in the complex synovial microenvironment are not desirable in RA. Preventing Gal-3's inhibitory role on PD-1 signalling could, therefore, be a therapeutic target in RA by affecting inflammatory T cell responses and osteoclasts.

Keywords: Galectin-3; PD-1; autoimmunity; co-inhibitory receptors; inflammation; rheumatoid arthritis.


Conflict of interest statement

Authors have no disclosures or competing interests.

Figures

FIGURE 1
FIGURE 1
Expression of soluble PD‐1 and Gal‐3 in SF and plasma and extracellular expression on PBMCs and SFMCs. A, PD‐1 ELISA measuring levels of PD‐1 in SF (n = 24) and plasma from RA patients (n = 9) and HC plasma (n = 7). B, Gal‐3 ELISA measuring levels of soluble Gal‐3 in SF (n = 25) and plasma (n = 7) from RA patients, and HC plasma samples (n = 5). C, Levels of PD‐1+, D, Gal‐3+ and E, PD‐1 + Gal‐3+ cells in CD4+ T cells from RA and HC PBMCs and RA SFMCs (n = 6 pr group) either unstimulated or stimulated with anti‐CD3/anti‐CD28. Stimulation upregulated PD‐1 expression in RA and HC cells. Stimulation upregulated Gal‐3 on RA PBMCs. F, Sections of synovial membrane from RA patients (n = 4). Left: Stained for Gal‐3 visualized with AF488. Right: Stained for PD‐1 also visualized with AF488. Nuclei are visualized with DAPI. Isotype controls presented below. P‐values are indicated on graphs.
FIGURE 2
FIGURE 2
PD‐L1 and Gal‐3 expression levels on/in FLS. A, PD‐L1 expression on CD90+ FLS unstimulated (‐S) or treated with TNF‐α or IFN‐γ (n = 5). Stimulation significantly upregulated PD‐L1. B, Gal‐3 expression on CD90+ FLS unstimulated (‐S) or treated with TNF‐α or IFN‐γ (n = 5). Levels of intracellular Gal‐3 were significantly downregulated by TNF‐α treatment. C, MFI of PD‐L1 on PD‐L1 + Gal‐3+ FLS. IFN‐γ stimulation significantly upregulates PD‐L1 levels on PD‐L1 + Gal‐3+ FLS. D, MFI of Gal‐3 in PD‐L1 + Gal‐3+ FLS. TNF‐α and IFN‐γ stimulation resulted in significant downregulation of intracellular levels of Gal‐3 in PD‐L1 + Gal‐3+ cells. E, t‐SNE plot of Unstimulated, IFN‐γ‐ and TNF‐α‐treated FLS. IFN‐γ stimulation significantly upregulates PD‐L1 expression. F, Gal‐3 ELISA on supernatants from FLS either unstimulated or stimulated with IFN‐γ. Stimulation significantly increased levels of Gal‐3 in FLS supernatants (n = 5).
FIGURE 3
FIGURE 3
Binding of Gal‐3 to PD‐1 and PD‐L1. A, Sensorgram of Gal‐3 interaction with PD‐1 coupled to the chip. Concentrations of Gal‐3 in buffer ranges from 125‐4000 nM. Binding visualized by rise in signal (response units, RU). Gal‐3 is capable of binding PD‐1. B, Combinatorial ELISA. Levels of soluble PD‐1 in RA SF (n = 25) and plasma and HC plasma (n = 7, each) capable of binding immobilized rhGal‐3. Levels expressed as blanked OD values. Significantly higher PD‐1 levels in SF detected by rhGal‐3 compared to RA plasma and HC plasma.
FIGURE 4
FIGURE 4
Functions of Gal‐3 on cellular inflammation (IL‐2) and the PD‐1 signalling axis. A, Levels of IL‐2 evaluated by MFI in CD4+ T cells treated with rhPD‐L1, rhGal‐3 or rhGal‐3 combined with rhPD‐L1. IL‐2 MFI expressed as ratios calculated as: Treated / NT. rhPD‐L1 slightly decreased intracellular IL‐2 levels, while rhGal‐3 significantly decreased intracellular IL‐2 levels. B, t‐SNE plot. Horizontal labels represent flow cytometric markers, whereas vertical labels represent cellular treatments before flow cytometry. IL‐2 levels are downregulated in a specific cellular subset in CD4+ T cells treated with rhGal‐3 or rhPD‐L1 only, whereas the population reappears when cells are treated with both rhPD‐L1 and rhGal‐3 in combination (black arrows). N = 3.
FIGURE 5
FIGURE 5
Osteoclast formation assay. A, TRAP assay on supernatants from SFMC osteoclast cultures after 21 days of stimulation with RANKL and M‐CSF (NT) and indicated treatments. Formation presented as ratio, calculated: Treatment / NT. Cells treated with rhPD‐L1 demonstrated a tendency towards decreased levels of TRAP activity. rhGal‐3 significantly increased TRAP activity .rhPD‐L1 and rhGal‐3 in combination significantly increased TRAP activity compared to rhPD‐L1 treatment only. RA SFMCs (n = 3). b) Image of osteoclasts generated from RA SFMCs. Black arrows marking examples of osteoclasts, identified as pink TRAP positive, multinucleated cells.

Similar articles

Cited by

References

    1. Bullock J, Rizvi SAA, Saleh AM, et al. Rheumatoid arthritis: a brief overview of the treatment. Med Princ Pract. 2019;27:501‐507. - PMC - PubMed
    1. Heidari B. Rheumatoid arthritis: early diagnosis and treatment outcomes. Casp J Intern Med. 2011;2:161‐170. - PMC - PubMed
    1. Li S, Yin H, Zhang K, et al. Effector T helper cell populations are elevated in the bone marrow of rheumatoid arthritis patients and correlate with disease severity. Sci Rep. 2017;7:1‐11. - PMC - PubMed
    1. Sarkar S, Cooney LA, Fox DA. The role of T helper type 17 cells in inflammatory arthritis. Clin Exp Immunol. 2010;159:225‐237. - PMC - PubMed
    1. Lee A, Qiao Y, Grigoriev G, et al. Tumor necrosis factor α induces sustained signaling and a prolonged and unremitting inflammatory response in rheumatoid arthritis synovial fibroblasts. Arthritis Rheum. 2013;65:928‐938. - PMC - PubMed

MeSH terms