Cross-talk between red blood cells and plasma influences blood flow and omics phenotypes in severe COVID-19
- PMID: 36537079
- PMCID: PMC9767455
- DOI: 10.7554/eLife.81316
Cross-talk between red blood cells and plasma influences blood flow and omics phenotypes in severe COVID-19
Abstract
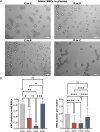
Coronavirus disease 2019 (COVID-19) is caused by the Severe Acute Respiratory Syndrome Coronavirus 2 (SARS-CoV-2) and can affect multiple organs, among which is the circulatory system. Inflammation and mortality risk markers were previously detected in COVID-19 plasma and red blood cells (RBCs) metabolic and proteomic profiles. Additionally, biophysical properties, such as deformability, were found to be changed during the infection. Based on such data, we aim to better characterize RBC functions in COVID-19. We evaluate the flow properties of RBCs in severe COVID-19 patients admitted to the intensive care unit by using microfluidic techniques and automated methods, including artificial neural networks, for an unbiased RBC analysis. We find strong flow and RBC shape impairment in COVID-19 samples and demonstrate that such changes are reversible upon suspension of COVID-19 RBCs in healthy plasma. Vice versa, healthy RBCs resemble COVID-19 RBCs when suspended in COVID-19 plasma. Proteomics and metabolomics analyses allow us to detect the effect of plasma exchanges on both plasma and RBCs and demonstrate a new role of RBCs in maintaining plasma equilibria at the expense of their flow properties. Our findings provide a framework for further investigations of clinical relevance for therapies against COVID-19 and possibly other infectious diseases.
Keywords: COVID-19; blood; cell biology; human; microfluidics; omics; physics of living systems; red blood cells.
© 2022, Recktenwald, Simionato et al.
Conflict of interest statement
SR, GS, LK, SQ Though unrelated to the contents of this manuscript, the authors declare that SMR, GS, LK, and SQ are co-founders of Cysmic GmbH, ML Affiliated with Cysmic GmbH; the author has no financial interests to declare, FG, MD, PM, KZ, Av, CW No competing interests declared, AD Though unrelated to the contents of this manuscript, AD is a founder of Omix Technologies Inc and Altis Biosciences LLC, and a scientific advisory board member for Hemanext Inc and Forma Therapeutics
Figures


Similar articles
-
Microconfined flow behavior of red blood cells.Med Eng Phys. 2016 Jan;38(1):11-6. doi: 10.1016/j.medengphy.2015.05.007. Epub 2015 Jun 10. Med Eng Phys. 2016. PMID: 26071649
-
Even patients with mild COVID-19 symptoms after SARS-CoV-2 infection show prolonged altered red blood cell morphology and rheological parameters.J Cell Mol Med. 2022 May;26(10):3022-3030. doi: 10.1111/jcmm.17320. Epub 2022 Apr 13. J Cell Mol Med. 2022. PMID: 35419946 Free PMC article.
-
The relationship between red blood cell deformability metrics and perfusion of an artificial microvascular network.Clin Hemorheol Microcirc. 2014;57(3):275-89. doi: 10.3233/CH-131719. Clin Hemorheol Microcirc. 2014. PMID: 23603326 Free PMC article.
-
Deformability of Heterogeneous Red Blood Cells in Aging and Related Pathologies.Aging Dis. 2024 Jun 19;16(3):1242-1264. doi: 10.14336/AD.2024.0526. Aging Dis. 2024. PMID: 39012672 Free PMC article. Review.
-
Blood rheology and hemodynamics.Semin Thromb Hemost. 2003 Oct;29(5):435-50. doi: 10.1055/s-2003-44551. Semin Thromb Hemost. 2003. PMID: 14631543 Review.
Cited by
-
Marginated aberrant red blood cells induce pathologic vascular stress fluctuations in a computational model of hematologic disorders.bioRxiv [Preprint]. 2023 May 18:2023.05.16.541016. doi: 10.1101/2023.05.16.541016. bioRxiv. 2023. Update in: Sci Adv. 2023 Dec;9(48):eadj6423. doi: 10.1126/sciadv.adj6423. PMID: 37293094 Free PMC article. Updated. Preprint.
-
Exploring unconventional attributes of red blood cells and their potential applications in biomedicine.Protein Cell. 2024 May 7;15(5):315-330. doi: 10.1093/procel/pwae001. Protein Cell. 2024. PMID: 38270470 Free PMC article. No abstract available.
-
Big Data in Transfusion Medicine and Artificial Intelligence Analysis for Red Blood Cell Quality Control.Transfus Med Hemother. 2023 May 25;50(3):163-173. doi: 10.1159/000530458. eCollection 2023 Jun. Transfus Med Hemother. 2023. PMID: 37408647 Free PMC article. Review.
-
Effect of Cell Age and Membrane Rigidity on Red Blood Cell Shape in Capillary Flow.Cells. 2023 Jun 1;12(11):1529. doi: 10.3390/cells12111529. Cells. 2023. PMID: 37296651 Free PMC article.
-
Erythrocytes Functionality in SARS-CoV-2 Infection: Potential Link with Alzheimer's Disease.Int J Mol Sci. 2023 Mar 17;24(6):5739. doi: 10.3390/ijms24065739. Int J Mol Sci. 2023. PMID: 36982809 Free PMC article. Review.
References
Publication types
MeSH terms
Grants and funding
LinkOut - more resources
Full Text Sources
Medical
Miscellaneous

