. 2022 Dec;11(12):e12294.
doi: 10.1002/jev2.12294.

TGFβ+ small extracellular vesicles from head and neck squamous cell carcinoma cells reprogram macrophages towards a pro-angiogenic phenotype

Affiliations

TGFβ+ small extracellular vesicles from head and neck squamous cell carcinoma cells reprogram macrophages towards a pro-angiogenic phenotype

Nils Ludwig et al. J Extracell Vesicles. 2022 Dec.

Abstract

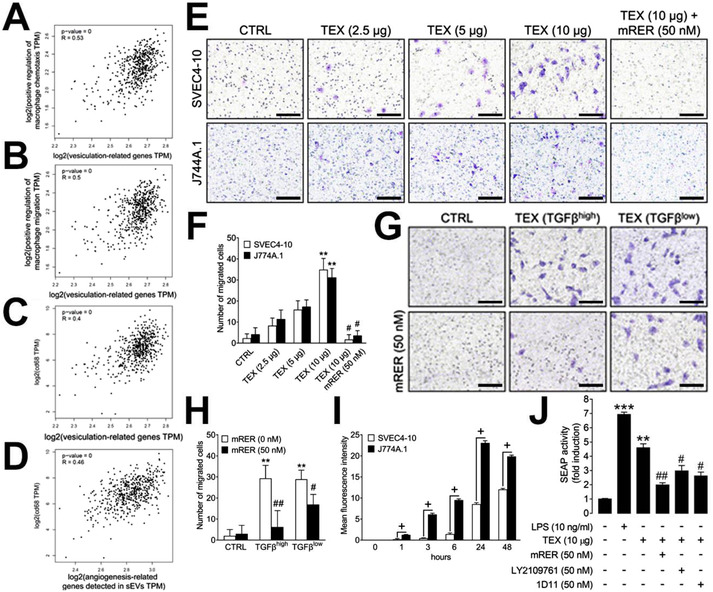
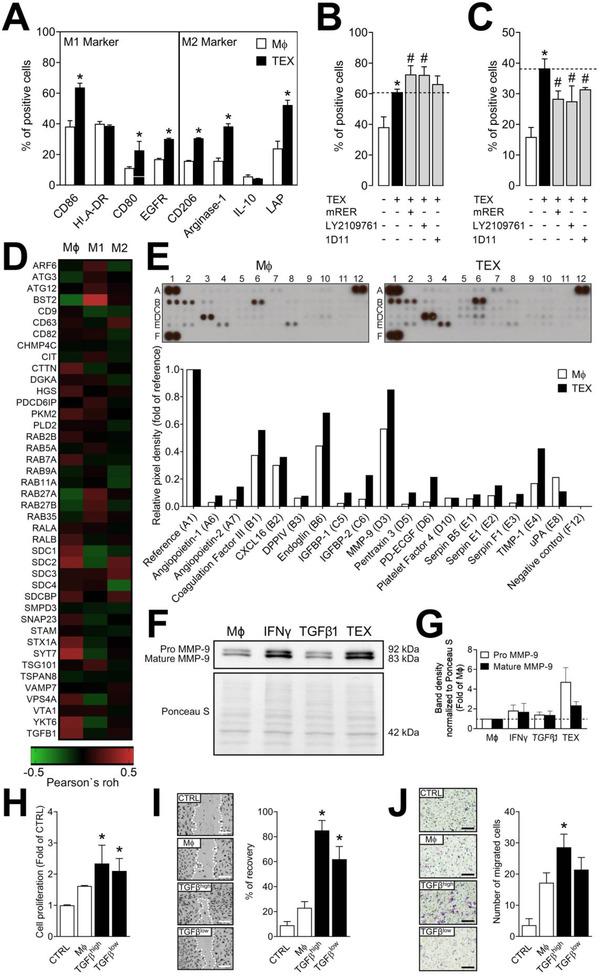
Transforming growth factor β (TGFβ) is a major component of tumor-derived small extracellular vesicles (TEX) in cancer patients. Mechanisms utilized by TGFβ+ TEX to promote tumor growth and pro-tumor activities in the tumor microenvironment (TME) are largely unknown. TEX produced by head and neck squamous cell carcinoma (HNSCC) cell lines carried TGFβ and angiogenesis-promoting proteins. TGFβ+ TEX stimulated macrophage chemotaxis without a notable M1/M2 phenotype shift and reprogrammed primary human macrophages to a pro-angiogenic phenotype characterized by the upregulation of pro-angiogenic factors and functions. In a murine basement membrane extract plug model, TGFβ+ TEX promoted macrophage infiltration and vascularization (p < 0.001), which was blocked by using the TGFβ ligand trap mRER (p < 0.001). TGFβ+ TEX injected into mice undergoing the 4-nitroquinoline-1-oxide (4-NQO)-driven oral carcinogenesis promoted tumor angiogenesis (p < 0.05), infiltration of M2-like macrophages in the TME (p < 0.05) and ultimately tumor progression (p < 0.05). Inhibition of TGFβ signaling in TEX with mRER ameliorated these pro-tumor activities. Silencing of TGFβ emerges as a critical step in suppressing pro-angiogenic functions of TEX in HNSCC.

Keywords: TGFβ; angiogenesis; exosomes; head and neck squamous cell carcinoma; macrophages; small extracellular vesicles.


Conflict of interest statement

Dr. Andrew Hinck is the Co‐Inventor of RER, which is covered by U.S. patent 9,611,306, and holds royalty rights for the clinical deployment of RER, which is currently being pursued.

Figures

FIGURE 1
FIGURE 1
Characterization of HNSCC cell‐derived TEX. (A) Representative TEM image of TEX. (B) Representative TRPS (qNano) size and concentration distribution plot of TEX. (C) Western blots of TEX for small extracellular vesicle markers Alix, CD63, and TSG101 as well as negative markers Calnexin and Grp94 carried by TEX; each lane was loaded with 5 μg protein of TEX lysate. (D) Characterization of TEX proteome by LC‐MS/MS – shown are detected TEX proteins associated with GO term <vasculature development> (GO:0001944); actual and putative functional interactions between these proteins (marked with lines) were found by the STRING database (https://string‐db.org). (E) The relative abundance of the selected vesiculation/angiogenesis‐related proteins in TEX produced by the 5 different HNSCC cell lines; abundances are sorted regarding deciles of all normalized signals and are color‐coded (common sEV markers CD9 and CD63 are shown for reference). (F) Analysis of gene expression of the protein signature shown in E in the TCGA data base for HNSCCs using the GEPIA2 analytical tool. Comparison of normal solid tissue (n = 44) and primary HNSCC tumors (n = 519). (G) Correlation of the gene expression of the protein signature shown in E with vesiculation‐related genes in TCGA database for HNSCCs. (H) Correlation of the gene set HALLMARK_ANGIOGENESIS (GSEA, Molecular Signatures Database M5944) with vesiculation‐related genes in TCGA database for HNSCCs. (I) Correlation of the gene set HALLMARK_TGF_BETA_SIGNALING (GSEA, Molecular Signatures Database, M5896) with vesiculation‐related genes in TCGA database for HNSCCs. (J) Correlation of the TGFB1 gene expression with vesiculation‐related genes in TCGA database for HNSCCs.
FIGURE 2
FIGURE 2
Characterization of TEX‐associated TGFβ. (A) Dot blot analysis shows that TGFβ is present on the surface of TEX derived from UMSCC47 cells and is also enclosed in the vesicle lumen. (B) Representative histograms for TGFβ expression on TEX derived from UMSCC47 cells and analyzed by flow cytometry. (C) Quantification of bioactive TGFβ at the indicated concentrations of TEX derived from UMSCC47 cells using MFB‐F11 reporter cells. (D) Quantification of bioactive TGFβ in 20 μg of total TEX protein isolated from supernatants of the indicated cancer cell lines using MFB‐F11 reporter cells; 10 pg of recombinant TGFβ1 was used as a reference. (E) The response of MFB‐F11 reporter cells to TEX derived from UMSCC47 cells in the presence or absence of the indicated EV uptake inhibitors; no differences were observed between EV uptake inhibitors alone and CTRL (data omitted for simplicity). (F) The response of MFB‐F11 reporter cells to TEX derived from UMSCC47 cells in the presence or absence of the indicated TGFβ inhibitors; no differences were observed between TGFβ inhibitors alone and CTRL (data omitted for simplicity). All experiments were performed at least three times in triplicates. All values represent means ± SEM; **p < 0.01 vs. CTRL;# p < 0.05 vs. TEX; ## p < 0.01 vs. TEX.
FIGURE 3
FIGURE 3
TEX interact with endothelial cells and macrophages and promote their chemotaxis. (A) Correlation of the gene set positive regulation of macrophage chemotaxis (GSEA, Molecular Signatures Database M13699) with vesiculation‐related genes in TCGA database for HNSCCs. (B) Correlation of the gene set positive regulation of macrophage migration (GSEA, Molecular Signatures Database M25365) with vesiculation‐related genes in TCGA database for HNSCCs. (C) Correlation of CD68 gene expression with vesiculation‐related genes in TCGA database for HNSCCs. (D) Correlation of CD68 gene expression with gene expression of the protein signature shown in Figure 1E in TCGA database for HNSCCs. (E) Representative images of migration of SVEC4–10 lymphendothelial cells or J744A.1 macrophages towards serum‐free media (CTRL), 2.5, 5 and 10 μg of TEX protein (derived from SCCVII cells) or a combination of 10 μg of TEX protein and the TGFβ inhibitor mRER (50 nM). Scale bars = 100 μm. (F) Quantification of migrated cells after 6 h of incubation. (G) Representative images of migration of SVEC4–10 cells towards serum‐free media (CTRL), 10 μg of TGFβhigh (UMSCC47) and 10 μg of TGFβlow (UMSCC90) TEX in the presence or absence of mRER (50 nM). Scale bars = 100 μm. (H) Quantification of migrated cells after 6 h of incubation. (I) Internalization of TEX derived from the supernatant of SCCVII cells by SVEC4‐10 or J744A.1 cells; internalization was quantified by flow cytometry at the indicated time points. (H) Raw‐Blue™ NF‐ĸB reporter cells were treated with PBS (Neg. CTRL), LPS (100 ng/ml, Pos. CTRL), TEX from UMSCC47 cells (20 μg/ml TEX protein) and TEX in the presence of indicated TGFβ inhibitors. Experiments were performed two times in triplicates. All values represent means ± SEM; *p < 0.05 vs. CTRL; **p < 0.01 vs. CTRL; ***p < 0.001 vs. CTRL; + p < 0.05 vs. SVEC4‐10; # p < 0.05 vs. TEX; ## p < 0.01 vs. TEX.
FIGURE 4
FIGURE 4
TGFβ+ TEX interact with macrophages and reprogram them to a pro‐angiogenic phenotype. (A) Expression of established M1‐ and M2‐markers was analyzed by flow cytometry in naïve human primary macrophages (Mϕ) and macrophages treated with TEX (UMSCC47‐derived). (B) Expression of CD86 by macrophages treated with UMSCC47‐derived TEX in the presence or absence of the TGFβ inhibitors mRER, LY2109761 or 1D11 (all used at 50 nM). (C) Expression of Arginase‐1 by macrophages treated with UMSCC47‐derived TEX in the presence or absence of the TGFβ inhibitors mRER, LY2109761 or 1D11 (all used in 50 nM). (D) Correlation of vesiculation‐related genes with infiltration of Mϕ, M1, and M2 macrophages in the TCGA head and neck cancer cohort analyzed using TIMER2.0. (E) Cell lysates of naïve macrophages or macrophages treated with UMSCC47‐derived TEX were analyzed by human angiogenesis arrays; the arrays were quantified using ImageJ, values are normalized to reference spots on the membranes (A1, A12, and F1). (F) Immunoblotting of MMP‐9 in macrophages treated with PBS (Mϕ CTRL), IFNγ (M1 CTRL), TGFβ1 (M2 CTRL) and TEX (UMSCC47‐derived). (G) Quantification of band intensities shown in F normalized to Ponceau S staining. (H) Proliferation of SVEC4‐10 cells in response to the treatment with conditioned medium from macrophages treated with PBS (Mϕ), TGFβhigh TEX (UMSCC47‐derived) or TGFβlow TEX (UMSCC90‐derived); proliferation was determined after 48 h, values are presented as fold of CTRL. (I) Wound healing of SVEC4‐10 cells after 12 h of incubation with PBS (CTRL) or with conditioned medium from macrophages treated with PBS (Mϕ), TGFβhigh TEX (UMSCC47‐derived) or TGFβlow TEX (UMSCC90‐derived). The left panel shows representative images 12 h after scratching; dotted lines indicate the border of SVEC4‐10, scale bars = 100 μm. The right panel shows quantified data expressed as a percent of the recovery. (J) The left panel shows representative images of SVEC4–10 cell migration towards serum‐free media (CTRL) or conditioned medium from macrophages treated with PBS (Mϕ), TGFβhigh TEX (UMSCC47‐derived) or TGFβlow TEX (UMSCC90‐derived); scale bars = 100 μm. The right panel shows the quantification of migrated cells after 6 h incubation. Experiments in A, B, C were performed two times in duplicates. Experiments in F and G were performed in duplicates. Experiments in H, I and J were performed three times in triplicates. All values in this figure represent means ± SEM. *p < 0.05 vs. Mϕ; # p < 0.05 vs. TEX.
FIGURE 5
FIGURE 5
TEX promote TGFβ‐dependent angiogenesis in vivo. Mice received subcutaneous injections of growth‐factor depleted Cultrex®. Each animal received 2 plugs (CTRL: 500 μl Cultrex® + 100 μl PBS; TEX: 500 μl Cultrex® + 50 μg TEX protein in 50 μl PBS). TEX derived either from SCCVII cells (TEX murine) or from UMSCC47 cells (TEX). Plugs were harvested after 7 days. (A) Representative photographs of harvested plugs and representative images of immunofluorescence staining for CD31 for the detection of vascular structures and CD68 for the detection of macrophages (green fluorescence); nuclei were counterstained with DAPI (blue fluorescence). (B) Representative images of immunofluorescence staining for CD31 or CD68 (green fluorescence) in combination with staining for pSmad2 (red fluorescence); nuclei were counterstained with DAPI (blue fluorescence). (C) Hemoglobin content in plugs. (D) Representative images of immunofluorescence staining for CD68 (green fluorescence) in combination with iNOS or ARG1 (red fluorescence) and DAPI (blue fluorescence). (E) Histology‐based quantification of macrophage infiltration into plugs. The following phenotypes were quantified: CD68 positive cells, CD68/iNOS double‐positive cells, and CD68/ARG1 double‐positive cells. Black scale bars = 1 cm. White scale bars = 100 μm. Data are presented as means ± SEM. ***p < 0.001 vs. CTRL; ## p < 0.01 vs. TEX; + p < 0.05 vs. TEX; & p < 0.01 vs. TEX.
FIGURE 6
FIGURE 6
TGFβ+ TEX promote reprogramming of macrophages of tumors in 4‐NQO‐treated mice. (A) A schematic is provided for 4‐NQO oral administration in water for the initiation of oral carcinomas. Green arrow indicates time‐point for intravenous injection of TEX or daily intraperitoneal injections of mRER into mice. (B) Number of tumors per mouse at the experimental end‐point. (C) Aggregate volumes of tumors in mm3 per mouse at the experimental end‐point. (D) Representative immunofluorescence staining of tumor sections at week 27/28 from the various indicated treatment cohorts for CD31 and CD68 (green fluorescence), TGFβ, iNOS, and ARG1 (red fluorescence) and counterstaining of nuclei with DAPI (blue fluorescence). Scale bars = 100 μm. (E) Quantitative analysis of immunofluorescence staining for TGFβ. All data are expressed as the percentage of the area positively stained from the region of interest (% ROI). (F) Quantitative analysis of immunofluorescence staining for CD31. All data are expressed as the area positively stained from the region of interest (% ROI). (G) Histology‐based quantification of macrophages at the border zones of the tumor. The following phenotypes were quantified: CD68 positive cells, CD68/iNOS double‐positive cells, and CD68/ARG1 double‐positive cells. Values represent means ± SEM. *p < 0.05 vs. CTRL; # p < 0.05 vs. number of CD68+/ARG1+ cells in CTRL.

References

    1. Abnaof, K. , Mallela, N. , Walenda, G. , Meurer, S. K. , Seré, K. , Lin, Q. , Smeets, B. , Hoffmann, K. , Wagner, W. , Zenke, M. , Weiskirchen, R. , & Fröhlich, H. (2014). TGF‐β stimulation in human and murine cells reveals commonly affected biological processes and pathways at transcription level. BMC Systems Biology, 8, 1–14. - PMC - PubMed
    1. Batlle, E. , & Massagué, J. (2019). Transforming Growth Factor‐β Signaling in Immunity and Cancer. Immunity, 50, 924–940. - PMC - PubMed
    1. Bhatta, M. , Shenoy, G. N. , Loyall, J. L. , Gray, B. D. , Bapardekar, M. , Conway, A. , Minderman, H. , Kelleher Jr, R. J. , Carreno, B. M. , Linette, G. , Shultz, L. D. , Odunsi, K. , Balu‐Iyer, S. V. , Pak, K. Y. , & Bankert, R. B. (2021). Novel phosphatidylserine‐binding molecule enhances antitumor T‐cell responses by targeting immunosuppressive exosomes in human tumor microenvironments. Journal for ImmunoTherapy of Cancer, 9, 1–13. - PMC - PubMed
    1. Carmeliet, P. (2003). Angiogenesis in health and disease. Nature Medicine, 9, 653–660. - PubMed
    1. Carmeliet, P. , & Jain, R. K. (2011). Molecular mechanisms and clinical applications of angiogenesis. Nature, 473, 298–307. - PMC - PubMed

Publication types

Substances