. 2023 Apr 6;32(8):1380-1400.
doi: 10.1093/hmg/ddac295.

Human TrkAR649W mutation impairs nociception, sweating and cognitive abilities: a mouse model of HSAN IV

Affiliations

Human TrkAR649W mutation impairs nociception, sweating and cognitive abilities: a mouse model of HSAN IV

Paola Pacifico et al. Hum Mol Genet. .

Abstract

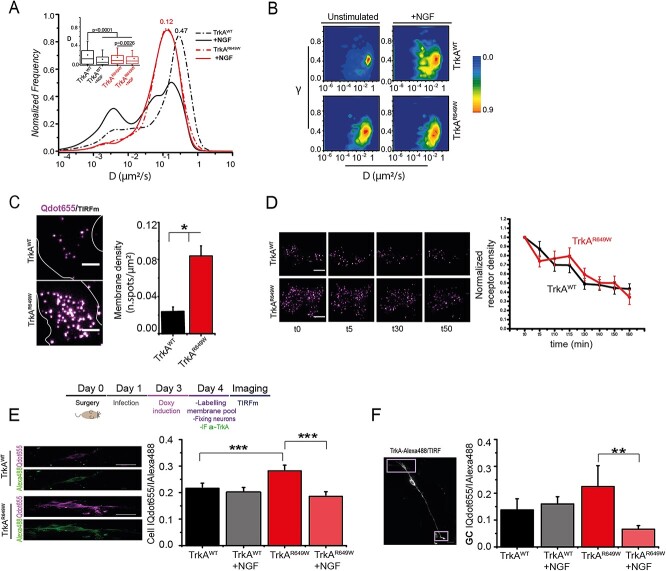
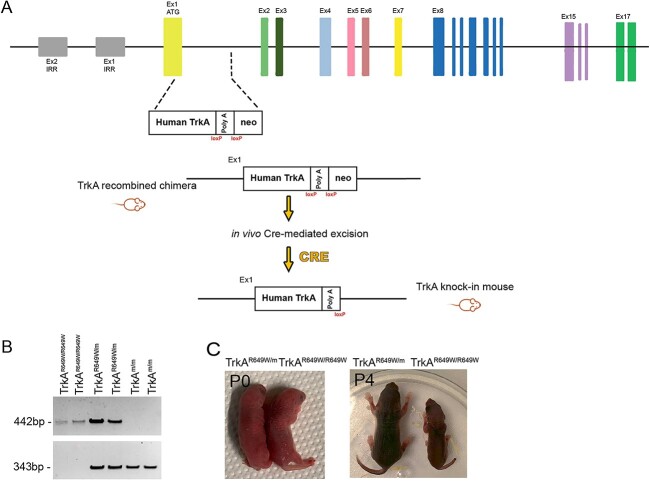
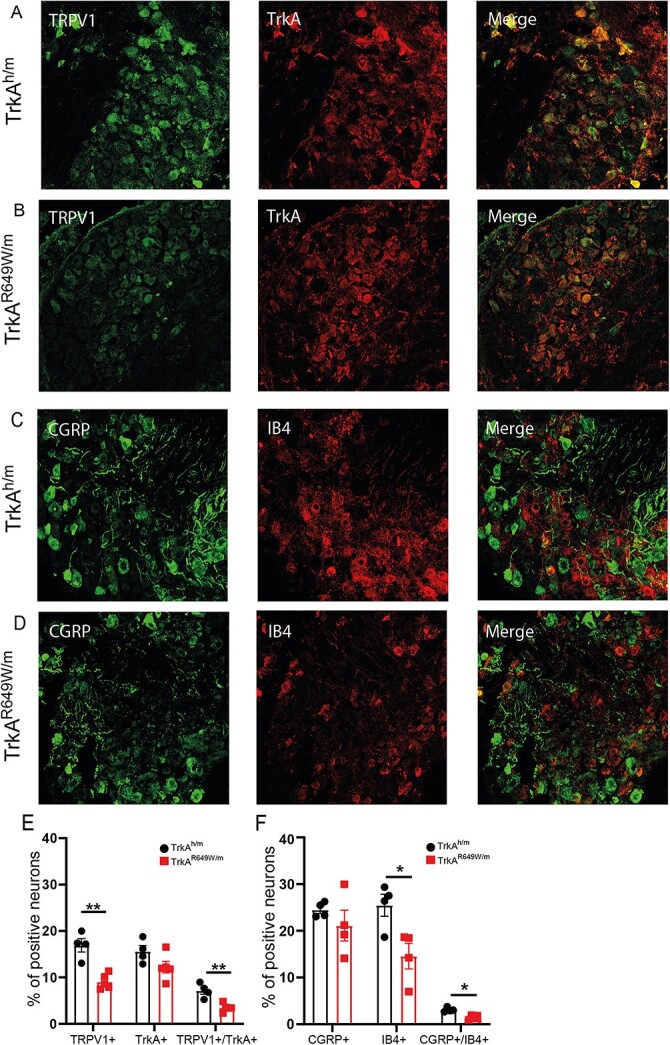
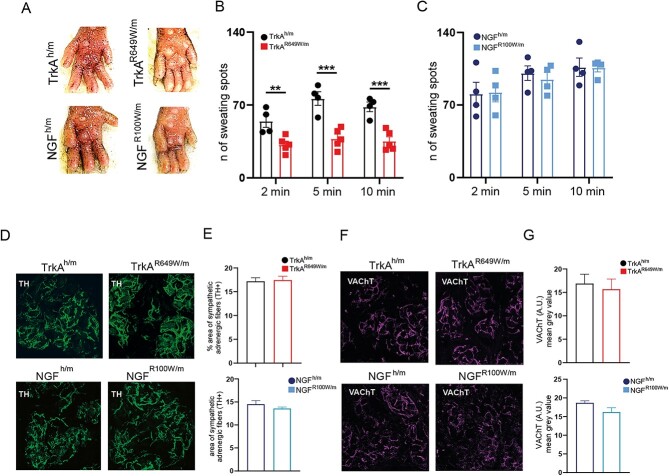
A functional nerve growth factor NGF-Tropomyosin Receptor kinase A (TrkA) system is an essential requisite for the generation and maintenance of long-lasting thermal and mechanical hyperalgesia in adult mammals. Indeed, mutations in the gene encoding for TrkA are responsible for a rare condition, named Hereditary Sensory and Autonomic Neuropathy type IV (HSAN IV), characterized by the loss of response to noxious stimuli, anhidrosis and cognitive impairment. However, to date, there is no available mouse model to properly understand how the NGF-TrkA system can lead to pathological phenotypes that are distinctive of HSAN IV. Here, we report the generation of a knock-in mouse line carrying the HSAN IV TrkAR649W mutation. First, by in vitro biochemical and biophysical analyses, we show that the pathological R649W mutation leads to kinase-inactive TrkA also affecting its membrane dynamics and trafficking. In agreement with the HSAN IV human phenotype, TrkAR649W/m mice display a lower response to thermal and chemical noxious stimuli, correlating with reduced skin innervation, in addition to decreased sweating in comparison to TrkAh/m controls. Moreover, the R649W mutation decreases anxiety-like behavior and compromises cognitive abilities, by impairing spatial-working and social memory. Our results further uncover unexplored roles of TrkA in thermoregulation and sociability. In addition to accurately recapitulating the clinical manifestations of HSAN IV patients, our findings contribute to clarifying the involvement of the NGF-TrkA system in pain sensation.


Figures

None
Graphical abstract
Figure 1
Figure 1
The R649W mutation affects TrkA phosphorylation and ubiquitination. (A) Schematic cartoon of TrkA domains. The asterisk shows the position of the R649W mutation. Bottom: Amino acid sequence alignment of the TKD of human TrkA. The mutated residue is indicated in red. (SP: signal peptide. Cys: cysteine-rich domains. LRR: Leucine-rich region. Ig: immunoglobulin-like domain. TM: transmembrane domain. TKD: tyrosine kinase domain). (B) Representative WB and quantification showing TrkA phosphorylation and total TrkA levels in Hek293 cells transfected with human TrkAWT and human TrkAR649W, in the presence (+) or absence (−) of stimulation with 100 ng/ml of NGF for 30 min. Tubulin was used as a loading control in WB. The mutation severely affects the response of mutant TrkA to NGF stimulation. Two-way ANOVA F(2,12) = 22.264, P ≤ 0.001 followed by Bonferroni post-hoc test (***P ≤ 0.001); TrkA: Two-way ANOVA F(2,9) = 0.226, P ≤ 0.001 followed by Bonferroni post-hoc test (***P ≤ 0.001). (C) Representative WB with anti-ubiquitin antibodies showing that constitutive ubiquitination of TrkAR649W is significantly reduced with respect to TrkAWT.
Figure 2
Figure 2
Effect of R649W mutation on TrkA membrane dynamics: biophysical studies. (A) SPT of TrkAWT and TrkAR649W receptors on the membrane of living human neuroblastoma SK-N-BE cells, viewed by TIRF microscopy. Distribution of diffusion coefficient (D) obtained from TrkAWT trajectories before (black solid curve, n = 3369 trajectories from 25 cells) and after NGF administration (125 ng/ml for 15 min) (black dotted curve, n = 3283 trajectories from 28 cells) and for TrkAR649W trajectories before (red solid curve, n = 3638 trajectories from 31 cells) and after NGF administration (red dotted curve, n = 3375 trajectories from 27 cells). On the left: box-plot for D values retrieved from the same trajectories (at least six frames long) of TrkAWT before (black solid) and after NGF administration (black dotted) and for TrkAR649W before (red solid) and after NGF administration (red dotted). Trajectories are pooled from two independent measures. Boxes: 25th–75th percentiles; whiskers: 10th–90th percentile; line: median; square: mean. P < 0.0001 and P = 0.0026 according to Kruskal-Wallis test, with Dunn’s means comparison. (B) Total D-γ distributions according to MSS-TAD analysis of the same trajectories reported in A, for TrkAWT and TrkAR649W before and after NGF administration. On the right, logarithmic-scale color code for the frequency of the total D-γ distributions, normalized to 1 at the peak. (C) TIRF images of Qdot-labeled single receptor molecules of TrkAWT (upper) and TrkAR649W (lower); scale bar = 10 μm. On the right: quantification of density of labeled receptors per cell area (n.spots/μm2) in SHSY5Y cells, obtained from three experimental replicates (n = 22 cells for TrkAWT  n = 12 cells for TrkAR649W). *P < 0.05 according to two-tailed Mann–Whitney test. (D) Left: Representative TIRF images of single receptor spots of TrkAWT (top) and TrkAR649W (bottom) during a time-course after NGF stimulation. Every image corresponds to a time point of the same cell: t0 (time of NGF administration), t5, t30, t50 min. Scale bar = 10 μm. Right: Normalized membrane density for TrkAWT (black) and rTrkAR649W (red) is reported as mean ± SEM from cells acquired at each time point normalized for the respective density at time 0. Pconstruct > 0.05, Ptime < 0.001, and Pconstructxtime > 0.05 according to a two-way ANOVA test. All data are pools from 36 (TrkAWT) and 59 (TrkAR649W) cells, collected in two independent replicas. (E) Schematic timeline of the experimental procedure for the detection of the TrkA membrane pool in DRG neurons. Left: TIRF images of Qdot-labeled membrane TrkAWT and TrkAR649W receptors (magenta) and corresponding immunostained DRG neurons (green) infected with lentiviral particles bearing S6-tagged TrkAWT and TrkAR649W transgenes. Scale bar: 20 m. Right: Quantification of the membrane pool fraction on the total pool of TrkAWT and TrkAR649W in DRG neurons before and after 1 h of NGF stimulation (125 ng/ml). Quantification is obtained from the ratio between the intensity of Qdot signal (membrane receptors) against the intensity of Alexa488 (TrkA immunostaining) measured in the whole neuron (TrkAWT  n = 102 neurons; TrkAWT + NGF n = 21 neurons; TrkAR649W  n = 87 neurons, TrkAR649W + NGF n = 43 neurons). ***P < 0.001 according to Kruskal-Wallis Test. (F) Left: representative TIRF image of DRG neuron immunostained against TrkA with secondary antibody conjugated with Alexa488; growth cones are within the light purple boxes; scale bar: 20 nm. Right: quantification of TrkA membrane pool at growth cones before (TrkAWT  n = 17 neurons and TrkAR649W  m = 11 neurons) and after 1 h of NGF stimulation (125 ng/ml) (TrkAWT  n = 10 neurons and TrkAR649W  n = 10 neurons); **P < 0.01 according to Kruskal-Wallis test.
Figure 3
Figure 3
Generation of human TrkA R649W knock-in mice. (A) Molecular strategy to generate the human TrkAR649W knock-in mouse. Diagram illustrating the gene-targeting strategy to produce the TrkAR649W knock-in mice. Human TrkA cDNA cassette harboring the missense C-to-T mutation at the 1945 position replaced the murine TrkA exon 1 locus (corresponding to the R649W amino acid substitution). (B) PCR genotyping of homozygous (TrkAR649W/R649W), heterozygous (TrkAR649W/m) and wild-type (TrkAm/m) mice; wild-type band: 343 bp, mutant band: 442 bp. (C) Representative pictures of TrkAR649W knock-in mice. Homozygous mice appeared normal at birth (P0), but failed to grow during early postnatal life (e.g. at P4) compared to TrkAR649W/m.
Figure 4
Figure 4
The R649W mutation specifically affects the response to noxious-thermal stimuli and the response to a mechanical innocuous stimulus. Comparable response to noxious thermal stimuli in TrkA +/− mice. (A and B) Decreased cold sensitivity of TrkAR649W/m mice, analyzed as score and percentage (%) of responses on six trials A: Student’s t two-tailed test (t = 5.970, P ≤ 0.001); B: Mann–Whitney Rank Sum Test (P ≤ 0.001) n = 7 per group (C) Increased latency in TrkAR649W/m mice to respond to thermal stimulus of 48°C. Student’s t two-tailed test (t = −1.281, P = 0.025); TrkAh/m  n = 11; TrkAR649W/m  n = 9. (D and E) Comparable response to cold sensitivity between TrkA+/+ and TrkA+/−, both in the score and percentage (%) of responses D: Student’s t two-tailed test (t = 1.391, P = 0.188); E: Student’s t two-tailed test (t = 0.831, P = 0.421); TrkA+/+  n = 7 and TrkA+/−  n = 8. (F) No differences between TrkA+/+ and TrkA+/− in response to thermal stimulus of 48°C Mann–Whitney rank sum test (P = 0.902) n = 7 per group. (G) Decreased nociceptive behavior in TrkAR649W/m mice after intraplantar injection of capsaicin (9 μg/μl) compared to the control group. Two-way ANOVA (F(1,18) = 6.190, P = 0.023 followed by Holm-Sidak test (*P = 0.032; ***P ≤ 0.001); TrkAh/m  n = 8; TrkAR649W/m  n = 7. (H) Reduced number of bouts in response to a piece of adhesive tape applied to the back neck of HSAN IV mice, compared to controls. Student’s t two-tailed test (t = 2.419, P = 0.034); TrkAh/m  n = 6; TrkAR649W/m  n = 7. (I) No differences between wild type and TrkAR649W/m mice in response to mechanical stimulation measured by von Frey test. Student’s t two-tailed test (t = −0.274, P = 0.789); TrkAh/m  n = 7; TrkAR649W/m  n = 7). Data are presented as mean ± SEM.
Figure 5
Figure 5
Analysis of nociceptive markers in DRG: reduced expression of TRPV1 and IB4 expression. (A–D) Double immunofluorescence of DRG cryosections: for (A and B) TRPV1 and TrkA, (C and D) CGRP and IB4. (E) Significant decrease of TRPV1+/TrkA+ sensory neurons in TrkAR649W/m mice. Student’s t two-tailed test: TRPV1 t = 5.207, P = 0.001; TrkA t = 1.881, P = 0.102; TRPV1/TrkA t = 4.456, P = 0.003; TrkAh/m  n = 4, TrkAR649W/m  n = 5). (F) Reduced number of IB4-positive neurons in TrkAR649W/m mice. Student’s t two-tailed test: CGRP t = 1.089, P = 0.318; Mann–Whitney rank sum test: IB4 P = 0.03; Student’s t two-tailed test CGRP/IB4 t = 4.933, P = 0.003; TrkAh/m  n = 4, TrkAR649W/m  n = 4.
Figure 6
Figure 6
Loss of innervation in hairless and hairy skin in TrkA R649W/m mice. (A, C) Representative images and (B, D) quantification of PGP9.5 expression in glabrous and hairy skin sections. (B) Left: significant reduction of hairless skin innervation measured as the area occupied by PGP9.5-positive fibers. Student’s t two-tailed test: t = 2.947 P = 0.026 TrkAh/m  n = 3, TrkAR649W/m  n = 5. Right: reduction of PGP9.5-postive intraepidermal fibers in TrkAR649W/m compared to TrkAh/m mice. Student’s t two-tailed test: t = 5.045 P = 0.002 TrkAh/m  n = 4, TrkAR649W/m  n = 4. (D) TrkAR649W/m mice exhibit a diminished hairy skin innervation measured as the area occupied by PGP9.5-positive fibers. Student’s t two-tailed test: t = 3.670 P = 0.014 TrkAh/m  n = 4, TrkAR649W/m  n = 3.
Figure 7
Figure 7
Impaired sweating in HSAN IV TrkA R649W/m but not in HSAN V NGF R100W/m mice. (A) Representative images of sweat droplets (dark precipitates from iodine/starch assay) on footpads at 5 min and quantification of sweat droplets at 2, 5 and 10 min. (B) TrkAR649W/m mice show a significant reduction in the number of sweat droplets compared to control mice. Two-way RM ANOVA (F(2,14) = 2.61 P = 0.109), followed by Holm-Sidak test: 2 min P = 0.005; 5 min P ≤ 0.001; 10 min P ≤ 0.001; TrkAh/m  n = 4, TrkAR649W/m  n = 5. (C) Normal sweating in NGFh/m and NGFR100W/m Two-way RM ANOVA (F(2,12) = 0.084 P = 0.920), followed by Holm-Sidak test: 2 min P = 0.940; 5 min P = 0.652; 10 min P = 0.821; NGFh/m  n = 4, NGFR100W/m  n = 4). (D) Representative images showing the innervation of sweat glands in the footpad, revealed by TH immunofluorescence. (E) Unaffected sympathetic innervation of sweat glands in TrkAh/m and TrkAR649W/m mice and in NGFh/m and NGFR100W/m. TrkAh/m and TrkAR649W/m Student’s t two-tailed test t = −0.228, P = 0.826; TrkAh/m  n = 5, TrkAR649W/m  n = 4. While, NGFh/m and NGFR100W/m Student’s t two-tailed test t = 1.116, P = 0.297 n = 5 per group. (F) Representative images showing the sympathetic innervation of sweat glands, revealed by VAChT immunofluorescence. (G) VAChT (A.U) mean gray value revealed no differences of sympathetic innervation in TrkAh/m and TrkAR649W/m mice and in NGFh/m and NGFR100W/m. Histograms summarize the mean immunofluorescence signal intensity measured as the subtraction of the mean gray values and the background. TrkAh/m and TrkAR649W/m Student’s t two-tailed test t = 0.411, P = 0.702; TrkAh/m  n = 3, TrkAR649W/m  n = 3. While, NGFh/m and NGFR100W/m Student’s t two-tailed test t = 1.924, P = 0.127 n = 3 per group.
Figure 8
Figure 8
Impaired cognitive abilities in TrkA R649W/m mice and not in TrkA +/− mice. (A) Decreased percentage (%) of success in Y-maze test in TrkAR649W/m mice. Student’s t two-tailed test, (t = 2.519, P = 0.026), TrkAh/m  n = 8, TrkAR649W/m  n = 7. (B) Decrease of anxiety-related behavior in HSAN IV mice, evaluated in the elevated plus maze. Student’s t two-tailed test, (t = −2.349, P = 0.039); TrkAh/m  n = 7, TrkAR649W/m  n = 6. (C, D) Percentage (%) of success in Y-maze test (C) and anxiety-related behavior (D) are not affected in both TrkA+/+ and TrkA+/− mice. C: Student’s t two-tailed test (t = −1.683, P = 0.136); TrkA+/+  n = 5 and TrkA+/−  n = 4; D: Student’s t two-tailed test (t = −0.229, P = 0.823) n = 7 per group. (E) No differences in the novel object recognition test (Student’s t two-tailed test, t = 0.351, P = 0.732; n = 7 per group).
Figure 9
Figure 9
Reduced sociability in TrkA R649W/m and not in NGF R100W/m mice.(A) Left: TrkAR649W/m mice display reduced social preference in three-chamber test. Two-way ANOVA (F(1,28) = 9.56 P = 0.004), followed by Holm-Sidak method ***P ≤ 0.001 TrkAh/m  n = 8, TrkAR649W/m  n = 8. Right: no differences in social preference in the HSAN V mouse model. Two-way ANOVA (F(1,18) = 9.37 P = 0.346), ***P ≤ 0.001 NGFh/m  n = 4, NGFR100W/m  n = 7. (B) Left: Social novelty behavior is impaired in TrkAR649W/m mice Two-way ANOVA (F(1,28) = 10.63 P = 0.003), followed by Holm-Sidak method **P = 0.012; *P = 0.035; *P = 0.023 TrkAh/m  n = 8, TrkAR649W/m  n = 8. Right: normal social novelty exploration in NGFh/m and NGFR100W/m Two-way ANOVA, (F(1,18) = 4.01 P = 0.060) ***P ≤ 0.001 NGFh/m  n = 4, NGFR100W/m  n = 7.

References

    1. McMahon, S.B. (1996) NGF as a mediator of inflammatory pain. Phil. Trans. R. Soc. A, 351, 431–440. - PubMed
    1. Levi-Montalcini, R. (1952) Effects of mouse tumor transplantation on the nervous system. Ann. N. Y. Acad. Sci., 55, 330–344. - PubMed
    1. Huang, E.J. and Reichardt, L.F. (2001) Neurotrophins: roles in neuronal development and function. Ann. Rev. Neurosci., 24, 677–736. - PMC - PubMed
    1. Levi-Montalcini, R. (1987) Years later. Ann. NY Ac. Sci, 55, 330–344. - PubMed
    1. Kaplan, D.R., Hempstead, B.L., Martin-Zanca, D., Chao, M.V. and Parada, L.F. (1991) The trk proto-oncogene product: a signal transducing receptor for nerve growth factor. Science, 252, 554–558. - PubMed

Publication types