Review
. 2023 Jan;104(1):27-50.
doi: 10.1002/cyto.b.22108. Epub 2022 Dec 20.

Multiparameter flow cytometry in the evaluation of myelodysplasia: Analytical issues: Recommendations from the European LeukemiaNet/International Myelodysplastic Syndrome Flow Cytometry Working Group

Affiliations
Review

Multiparameter flow cytometry in the evaluation of myelodysplasia: Analytical issues: Recommendations from the European LeukemiaNet/International Myelodysplastic Syndrome Flow Cytometry Working Group

Anna Porwit et al. Cytometry B Clin Cytom. 2023 Jan.

Abstract

Multiparameter flow cytometry (MFC) is one of the essential ancillary methods in bone marrow (BM) investigation of patients with cytopenia and suspected myelodysplastic syndrome (MDS). MFC can also be applied in the follow-up of MDS patients undergoing treatment. This document summarizes recommendations from the International/European Leukemia Net Working Group for Flow Cytometry in Myelodysplastic Syndromes (ELN iMDS Flow) on the analytical issues in MFC for the diagnostic work-up of MDS. Recommendations for the analysis of several BM cell subsets such as myeloid precursors, maturing granulocytic and monocytic components and erythropoiesis are given. A core set of 17 markers identified as independently related to a cytomorphologic diagnosis of myelodysplasia is suggested as mandatory for MFC evaluation of BM in a patient with cytopenia. A myeloid precursor cell (CD34+ CD19- ) count >3% should be considered immunophenotypically indicative of myelodysplasia. However, MFC results should always be evaluated as part of an integrated hematopathology work-up. Looking forward, several machine-learning-based analytical tools of interest should be applied in parallel to conventional analytical methods to investigate their usefulness in integrated diagnostics, risk stratification, and potentially even in the evaluation of response to therapy, based on MFC data. In addition, compiling large uniform datasets is desirable, as most of the machine-learning-based methods tend to perform better with larger numbers of investigated samples, especially in such a heterogeneous disease as MDS.

Keywords: ELN; consensus; flow cytometry; myelodysplastic syndromes; standardization.


Conflict of interest statement

The authors declare no conflict of interest.

Figures
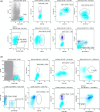
FIGURE 1
FIGURE 1
Aberrant immunophenotype of myeloid precursors in a case of MDS with excess of blasts in comparison to normal BM pattern. Previously published panels (Violidaki et al., 2020) were applied. Debris was removed and singlets were gated resulting in the “LIVE” gate (not shown). (a) MDS case: CD34+ cells were gated on the SSC/CD34 plot (cyan dots, upper left plot). A small population of CD56+ CD34+ cells (blue dots) was identified (upper, middle‐left plot). CD34+ cells were positive for CD11b, CD13, CD117, CD10 (upper middle‐right and right plots) and CD33, but negative for CD19 (lower left plot). A small population of CD7+ CD34+ cells was found (lower middle‐left plot). Most of CD34+ cells we negative for CD38 and HLA‐DR, and a subset of CD36+ CD34+ cells was detected, localized with the CD38+ subset and partly HLA‐DR positive (lower right plots). (b) Corresponding plots obtained with the same panel in a normal bone marrow sample showing normal immunophenotypic profile of CD34+ cells. The frequency of cells found in the areas of aberrant immunophenotypes in (a) is indicated [Color figure can be viewed at wileyonlinelibrary.com]
FIGURE 2
FIGURE 2
Gating procedure of maturing granulocytic cells: Maturing myeloid cells (SSCint/high/CD45int) are shown in green. Most important cell populations, which should be excluded from the maturing myeloid compartment are color coded as follows: myeloid progenitor cells (MyPC in red; SSCloCD45intCD34hi), lymphoid progenitor cells (LyPC in blue; SSCveryloCD45loCD34hi), monocytes (in orange; SSCint/CD45hiCD33hi and/or CD14hi), eosinophils (in black; SSChiCD45hiCD13hiCD16neg) [Color figure can be viewed at wileyonlinelibrary.com]
FIGURE 3
FIGURE 3
Examples of antigen expression in normal bone marrow (upper row) in comparison to immunophenotypic aberrancies in maturing myeloid cells in myelodysplastic syndrome (MDS) and in paroxysmal nocturnal hemoglobinuria (PNH). Left: aberrant CD56 expression (dark green) detected in maturing myeloid cells of MDS (lower row), but was detectable only in a minority of normal bone marrow cells; NK cells (light blue) which regularly express CD56 and T‐/B‐lymphocytes (dark blue) without CD56 expression are displayed as an internal control. Middle: abnormally shaped CD11b/CD16 expression pattern in MDS (lower row) compared to normal bone marrow as CD16neg CD11b+ via CD16+CD11b+ to CD16++CD11b+. Right: partial CD16 deficiency due to PNH (lower row) compared to normal bone marrow as CD16neg CD13+ via CD16neg CD13neg to CD16++ CD13+. Black arrows mark the normal maturation pattern [Color figure can be viewed at wileyonlinelibrary.com]
FIGURE 4
FIGURE 4
Representative examples of blood monocyte subpopulation distribution profiles obtained with the monocyte assay. (a) Immunophenotype in favor of chronic myelomonocytic leukemia (CMML) showing an accumulation of cMo that is, a percentage ≥94. (b) Immunophenotype not in favor of CMML showing no accumulation of cMo that is, a percentage <94. (c) Immunophenotype in favor of CMML with an easily recognized bulbous aspect, due to an increase in iMo fraction combined with the near disappearance of the ncMo subset, leading to a decrease in the cMo percentage below the 94% threshold [Color figure can be viewed at wileyonlinelibrary.com]
FIGURE 5
FIGURE 5
MFC assessments of erythroid dysplasia in MDS. The upper row displays patterns of normal erythroid maturation and a normal homogenous CD71 expression (histogram, right). All plots were generated from assessments of ammoniumchloride‐based lysed bone marrow aspirates. The gray dashed boxes delineate most of the normal erythroid maturation patterns. The most immature erythroid cells are defined as CD71+ CD235a, CD71+ CD105+ and CD36+ CD117+, respectively. Upon maturation, expression follows a pattern upwards in the CD71 versus CD235a plot and downwards in the CD71 versus CD105 and CD36 versus CD117 plots. The normal absence of cells in the box between erythroid progenitors and the remaining mature CD71 CD235+ erythrocytes is marked with an open arrow. The middle row displays an example of dysplastic erythropoiesis in a case of MDS‐MLD with increased CV of CD71 (black arrows) and increased frequency of immature erythroid progenitor cells (%CD117 and %CD105, gray arrows). The expression of CD71 is decreased as well. The bottom row demonstrates an example of MDS‐RS‐MLD where the erythroid cells show heterogeneous and decreased CD36 and CD71 expression as compared to the normal control (indicated by black arrows). The frequency of immature progenitors is relatively low (%CD117 and %CD105, gray arrows); in addition, CD105 expression is decreased. Notably, the displayed results are not typical for either of the WHO classification subtypes, but just an example of possible dysplastic features associated dyserythropoiesis by MFC. CV, coefficient of variation; dim, diminished; LD, multilineage dysplasia; RS, ring sideroblasts [Color figure can be viewed at wileyonlinelibrary.com]

References

    1. Aalbers, A. M. , van den Heuvel‐Eibrink, M. M. , Baumann, I. , Dworzak, M. , Hasle, H. , Locatelli, F. , De Moerloose, B. , Schmugge, M. , Mejstrikova, E. , Nováková, M. , Zecca, M. , Zwaan, C. M. , Te Marvelde, J. G. , Langerak, A. W. , van Dongen, J. J. , Pieters, R. , Niemeyer, C. M. , & van der Velden, V. H. (2015). Bone marrow immunophenotyping by flow cytometry in refractory cytopenia of childhood. Haematologica, 100(3), 315–323. 10.3324/haematol.2014.107706 - DOI - PMC - PubMed
    1. Aalbers, A. M. , van den Heuvel‐Eibrink, M. M. , de Haas, V. , Te Marvelde, J. G. , de Jong, A. X. , van der Burg, M. , Dworzak, M. , Hasle, H. , Locatelli, F. , De Moerloose, B. , Schmugge, M. , Stary, J. , Zecca, M. , Zwaan, C. M. , van de Loosdrecht, A. A. , van Dongen, J. J. , Niemeyer, C. M. , & van der Velden, V. H. (2013). Applicability of a reproducible flow cytometry scoring system in the diagnosis of refractory cytopenia of childhood. Leukemia, 27(9), 1923–1925. 10.1038/leu.2013.81 - DOI - PubMed
    1. Alhan, C. , Westers, T. M. , Cremers, E. M. , Cali, C. , Witte, B. I. , Ossenkoppele, G. J. , & van de Loosdrecht, A. A. (2014). High flow cytometric scores identify adverse prognostic subgroups within the revised international prognostic scoring system for myelodysplastic syndromes. British Journal of Haematology, 167(1), 100–109. 10.1111/bjh.12994 - DOI - PubMed
    1. Alhan, C. , Westers, T. M. , Cremers, E. M. , Cali, C. , Witte, B. I. , Ossenkoppele, G. J. , & van de Loosdrecht, A. A. (2016). The myelodysplastic syndromes flow cytometric score: A three‐parameter prognostic flow cytometric scoring system. Leukemia, 30(3), 658–665. 10.1038/leu.2015.295 - DOI - PubMed
    1. Alhan, C. , Westers, T. M. , van der Helm, L. H. , Eeltink, C. , Huls, G. , Witte, B. I. , Buchi, F. , Santini, V. , Ossenkoppele, G. J. , & van de Loosdrecht, A. A. (2014). Absence of aberrant myeloid progenitors by flow cytometry is associated with favorable response to azacitidine in higher risk myelodysplastic syndromes. Cytometry. Part B: Clinical Cytometry, 86(3), 207–215. 10.1002/cyto.b.21160 - DOI - PubMed