

Inconsistent Partitioning and Unproductive Feature Associations Yield Idealized Radiomic Models
- PMID: 36537895
- PMCID: PMC10068883
- DOI: 10.1148/radiol.220715
Inconsistent Partitioning and Unproductive Feature Associations Yield Idealized Radiomic Models
Abstract
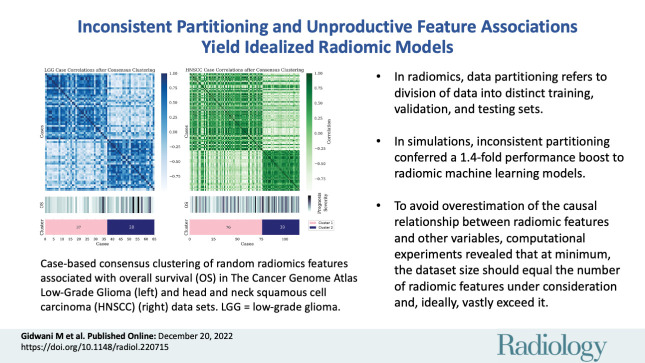
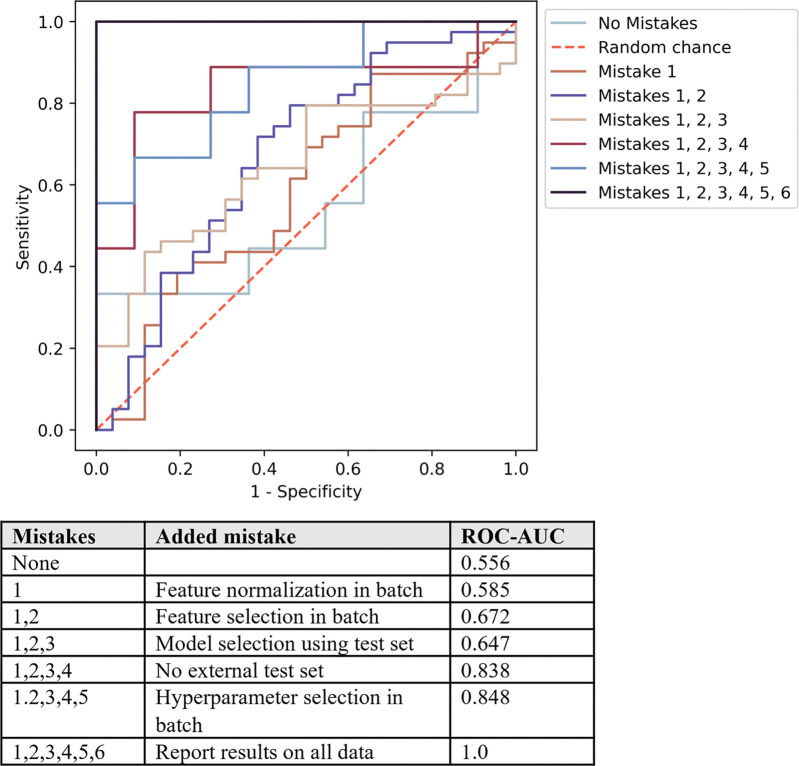
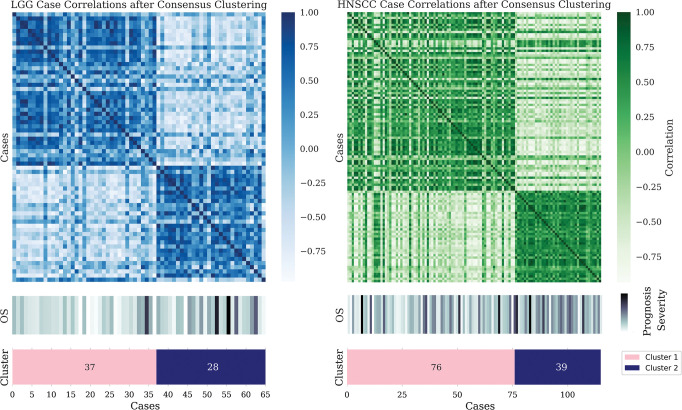
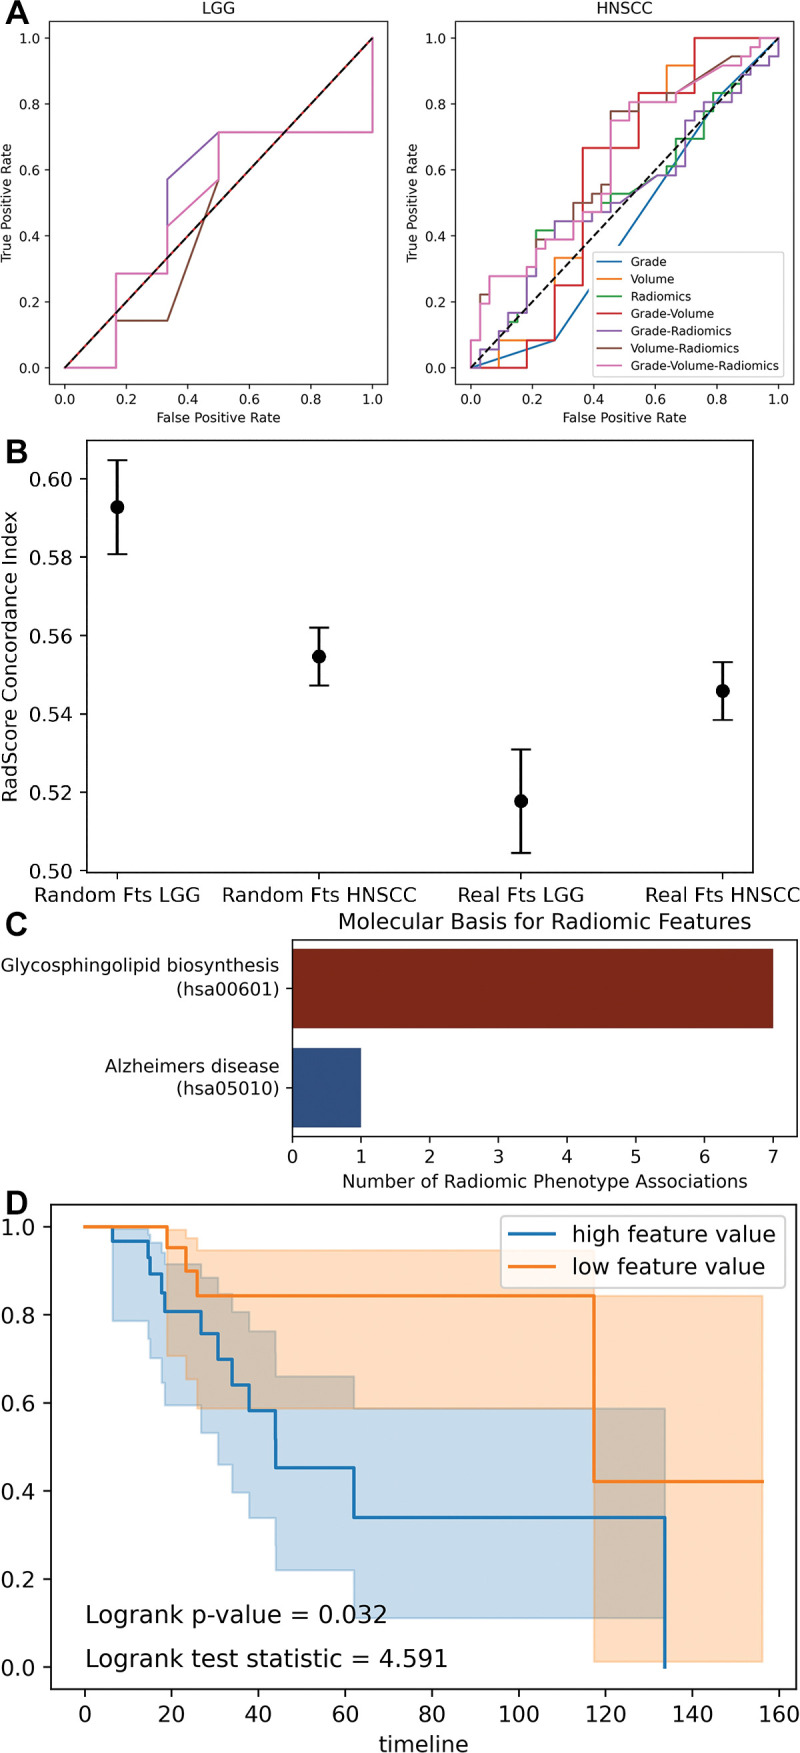
Background Radiomics is the extraction of predefined mathematic features from medical images for the prediction of variables of clinical interest. While some studies report superlative accuracy of radiomic machine learning (ML) models, the published methodology is often incomplete, and the results are rarely validated in external testing data sets. Purpose To characterize the type, prevalence, and statistical impact of methodologic errors present in radiomic ML studies. Materials and Methods Radiomic ML publications were reviewed for the presence of performance-inflating methodologic flaws. Common flaws were subsequently reproduced with randomly generated features interpolated from publicly available radiomic data sets to demonstrate the precarious nature of reported findings. Results In an assessment of radiomic ML publications, the authors uncovered two general categories of data analysis errors: inconsistent partitioning and unproductive feature associations. In simulations, the authors demonstrated that inconsistent partitioning augments radiomic ML accuracy by 1.4 times from unbiased performance and that correcting for flawed methodologic results in areas under the receiver operating characteristic curve approaching a value of 0.5 (random chance). With use of randomly generated features, the authors illustrated that unproductive associations between radiomic features and gene sets can imply false causality for biologic phenomenon. Conclusion Radiomic machine learning studies may contain methodologic flaws that undermine their validity. This study provides a review template to avoid such flaws. © RSNA, 2022 Supplemental material is available for this article. See also the editorial by Jacobs in this issue.
Conflict of interest statement
Figures
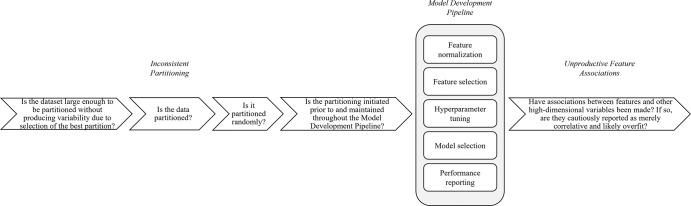
![Diagrams of inconsistent partitioning. Random features (R) based on
published radiomics data form the basis of our experimentation (atypical
from radiomics machine learning [ML] studies). (A) The upper level (blue and
yellow) illustrates consistent partitioning that prevents information leak,
while the lower level (green) demonstrates how the use of the entire data
set for radiomics feature normalization, feature selection, hyperparameter
selection, model selection, and performance reporting will result in an
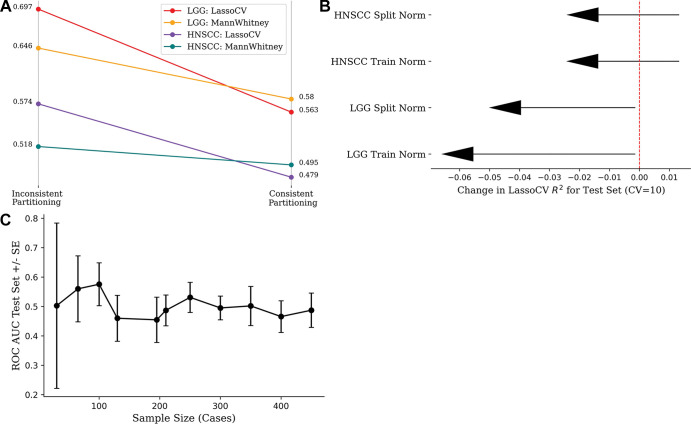
unrealistically optimistic assessment of the radiomics ML model. (B)
Diagrams show normalization strategies. Data set normalization (green) is an
example of inconsistent partitioning, with use of a mean and SD calculated
with use of all samples, both the training and test sets, to scale. Train
normalization (right) and split normalization (bottom) are different
approaches to consistent partitioning (more details in Appendix
S1).](https://cdn.ncbi.nlm.nih.gov/pmc/blobs/ab20/10068883/8c4c089be29a/radiol.220715.fig1.jpg)
Comment in
-
Data Partitioning and Statistical Considerations for Association of Radiomic Features to Biological Underpinnings: What Is Needed.Radiology. 2023 Apr;307(1):e223007. doi: 10.1148/radiol.223007. Epub 2022 Dec 20. Radiology. 2023. PMID: 36537899 Free PMC article. No abstract available.
References
-
- Huang YQ , Liang CH , He L , et al. . Development and Validation of a Radiomics Nomogram for Preoperative Prediction of Lymph Node Metastasis in Colorectal Cancer . J Clin Oncol 2016. ; 34 ( 18 ): 2157 – 216 4 [Published correction appears in J Clin Oncol 2016;34(20):2436.]. - PubMed
-
- Huang Y , Liu Z , He L , et al. . Radiomics Signature: A Potential Biomarker for the Prediction of Disease-Free Survival in Early-Stage (I or II) Non-Small Cell Lung Cancer . Radiology 2016. ; 281 ( 3 ): 947 – 957 . - PubMed
-
- Kaufman S , Rosset S , Perlich C , Stitelman O . Leakage in Data Mining: Formulation, Detection, and Avoidance . ACM Trans Knowl Discov Data 2012. ; 6 ( 4 ): 1 – 21 .
MeSH terms
Grants and funding
LinkOut - more resources
Full Text Sources
