. 2023 Mar;66(3):495-507.
doi: 10.1007/s00125-022-05848-6. Epub 2022 Dec 20.

High-throughput genetic clustering of type 2 diabetes loci reveals heterogeneous mechanistic pathways of metabolic disease

Affiliations

High-throughput genetic clustering of type 2 diabetes loci reveals heterogeneous mechanistic pathways of metabolic disease

Hyunkyung Kim et al. Diabetologia. 2023 Mar.

Abstract

Aims/hypothesis: Type 2 diabetes is highly polygenic and influenced by multiple biological pathways. Rapid expansion in the number of type 2 diabetes loci can be leveraged to identify such pathways.

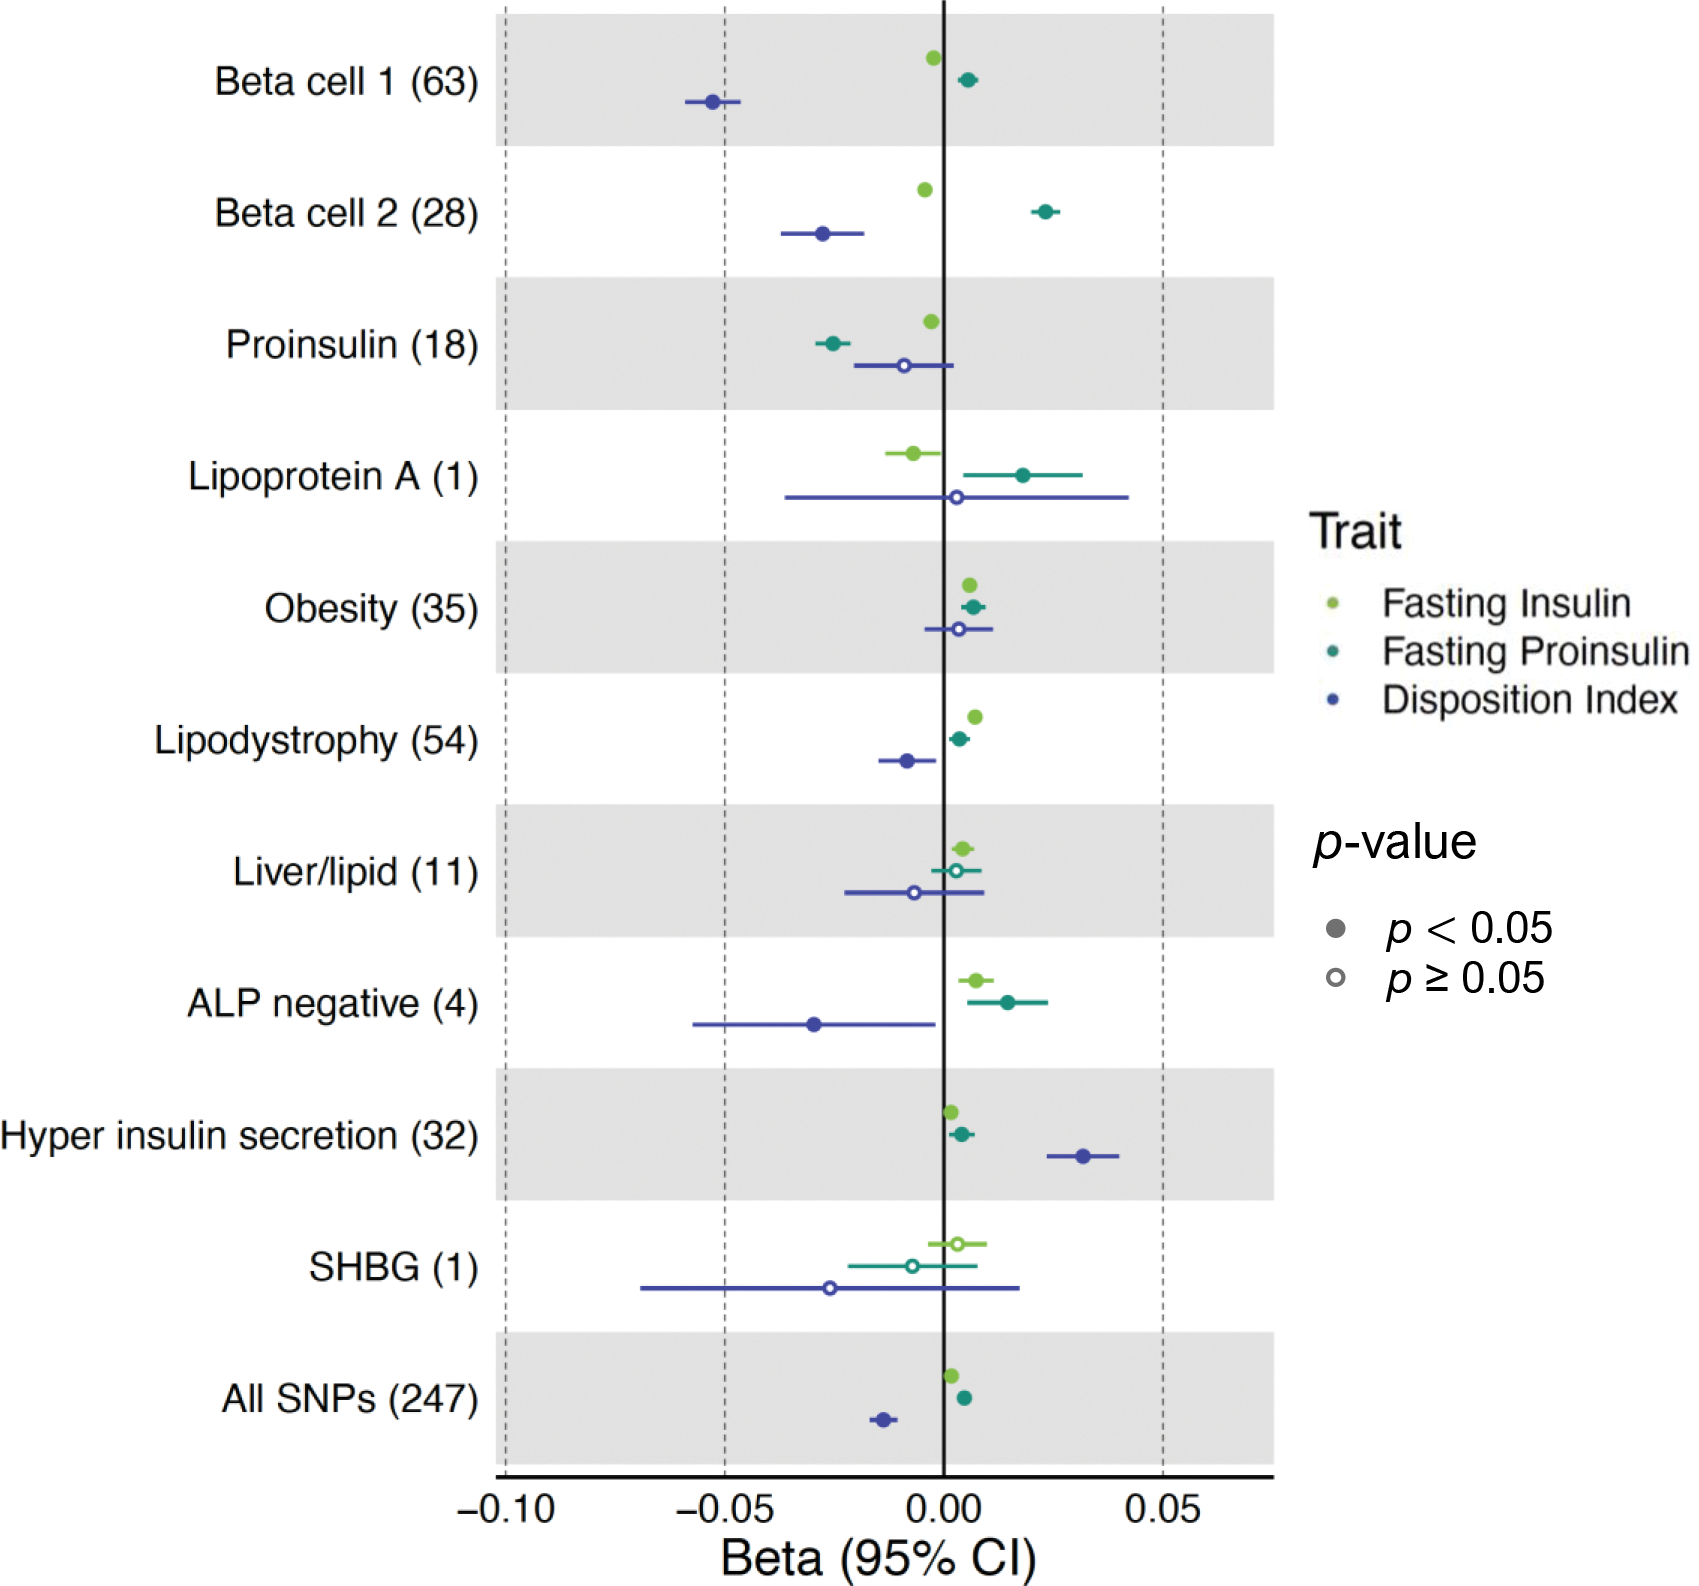
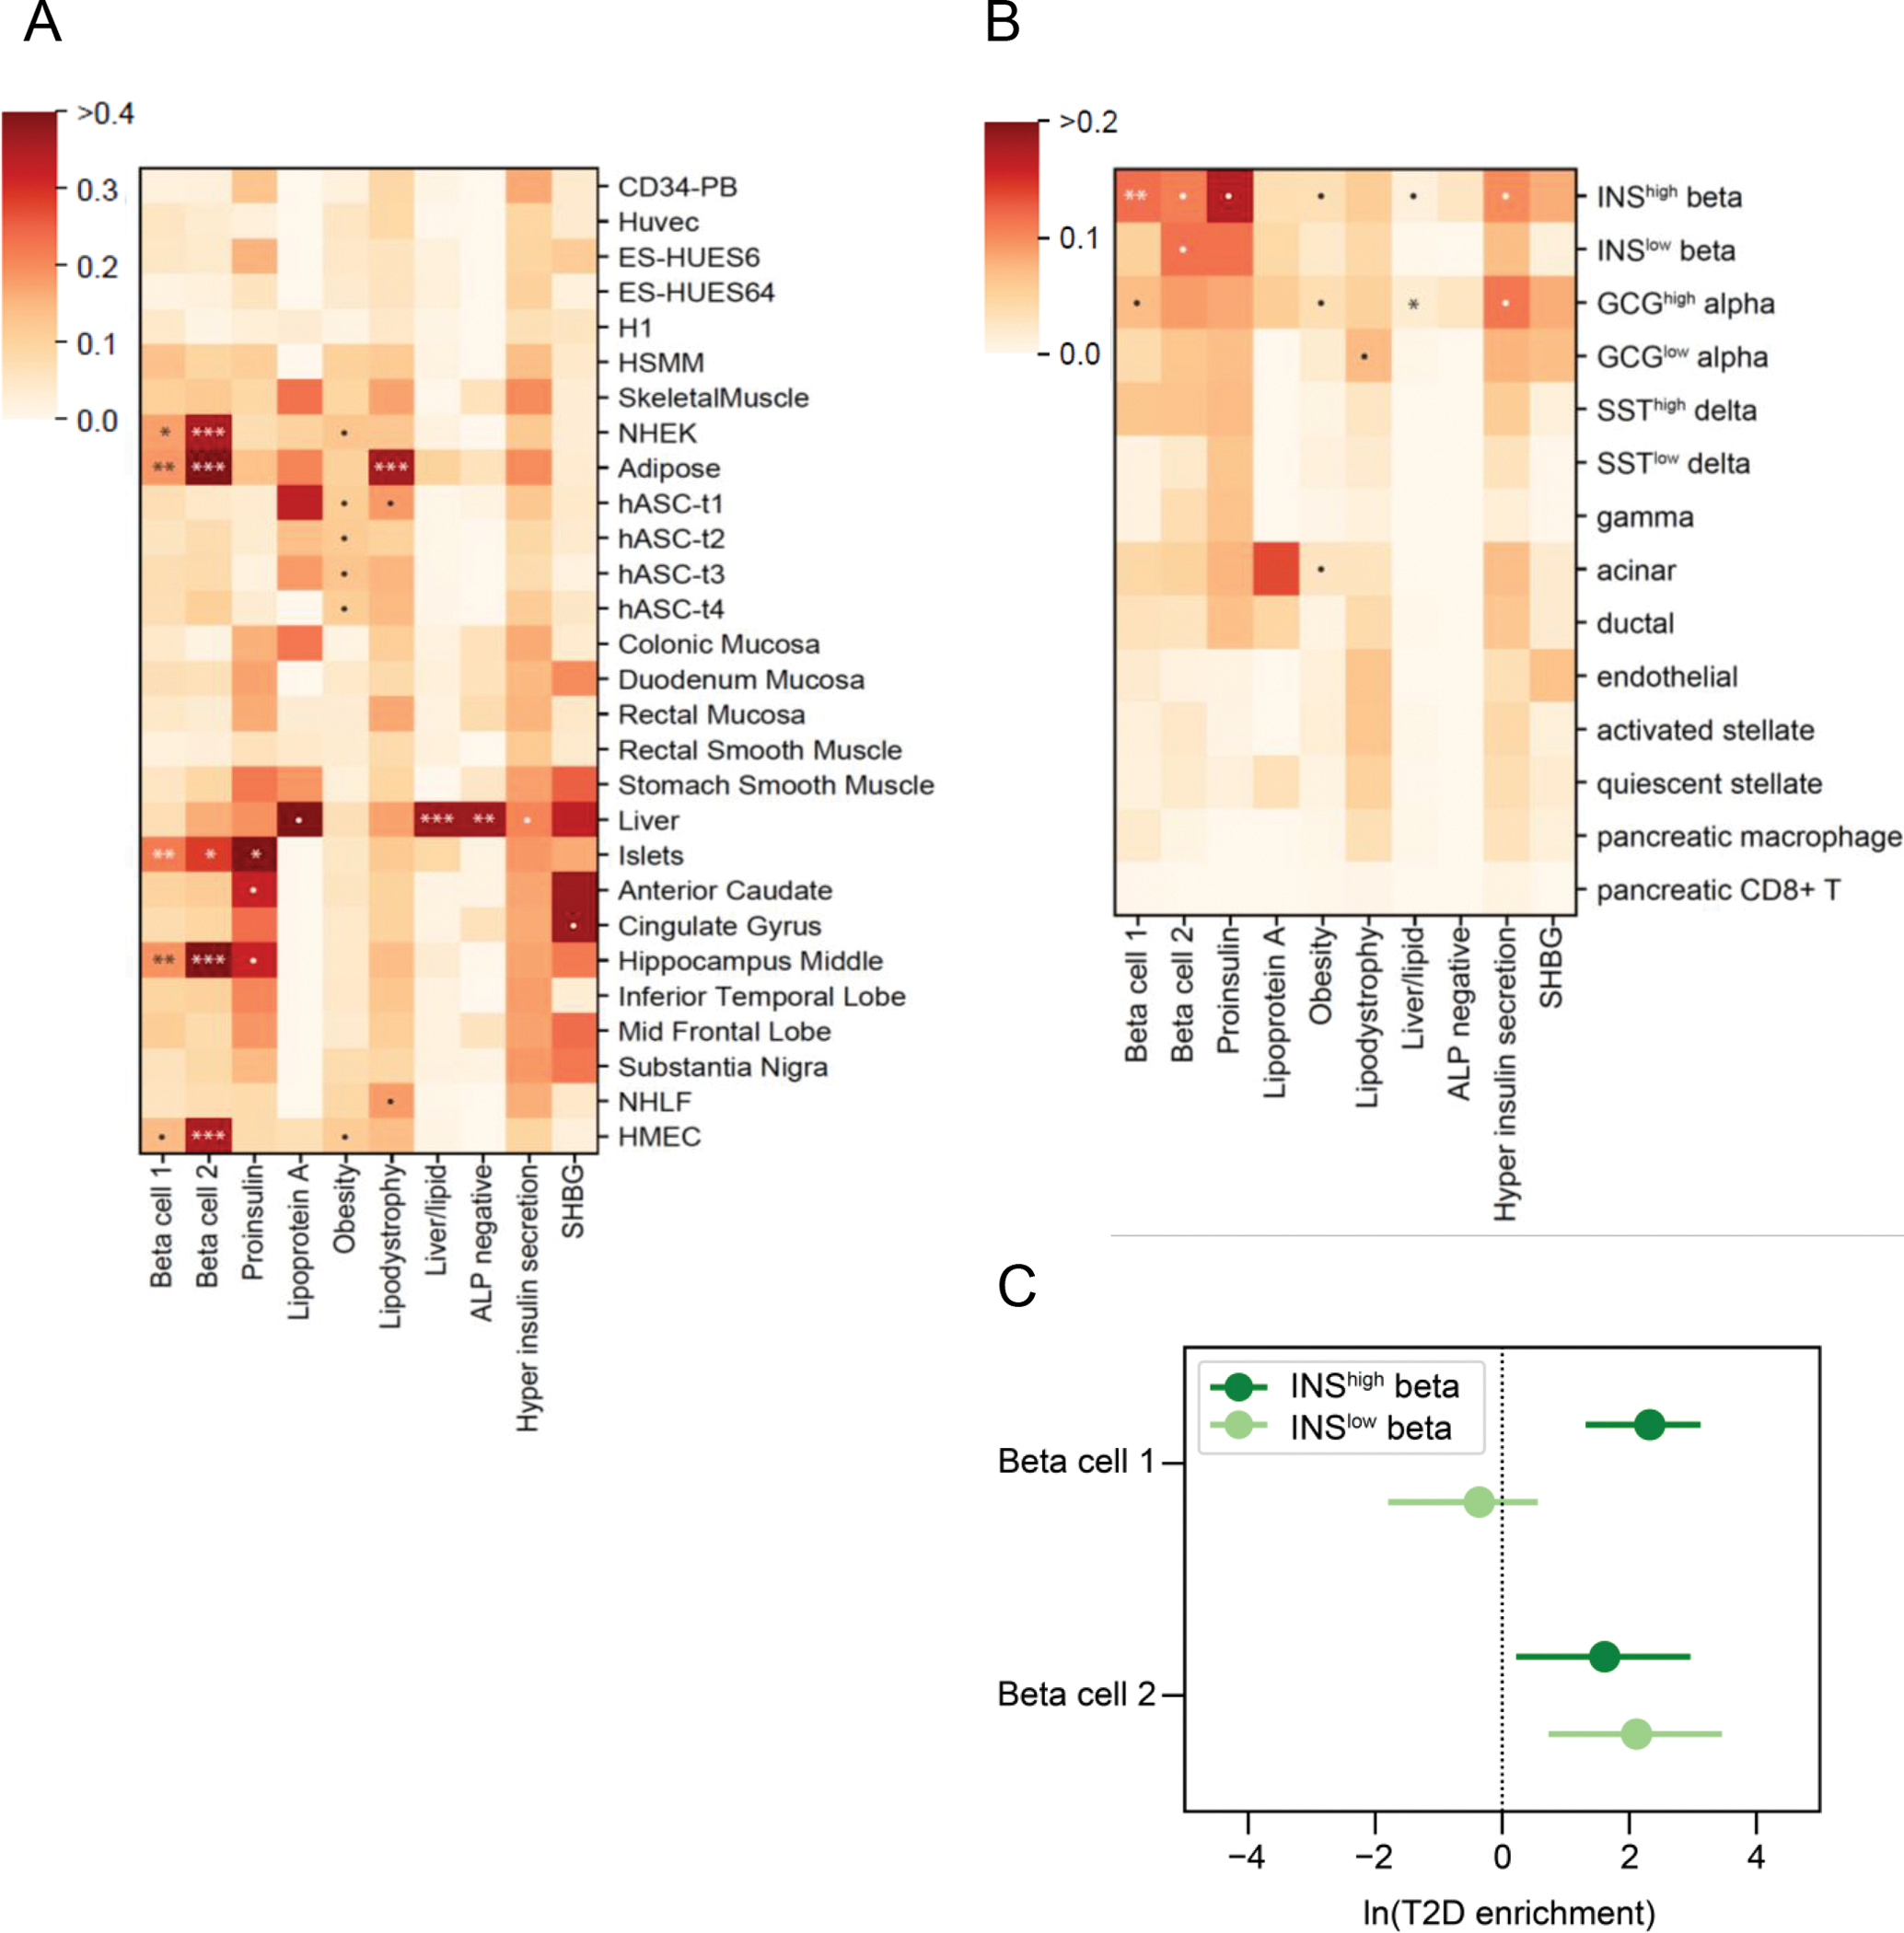
Methods: We developed a high-throughput pipeline to enable clustering of type 2 diabetes loci based on variant-trait associations. Our pipeline extracted summary statistics from genome-wide association studies (GWAS) for type 2 diabetes and related traits to generate a matrix of 323 variants × 64 trait associations and applied Bayesian non-negative matrix factorisation (bNMF) to identify genetic components of type 2 diabetes. Epigenomic enrichment analysis was performed in 28 cell types and single pancreatic cells. We generated cluster-specific polygenic scores and performed regression analysis in an independent cohort (N=25,419) to assess for clinical relevance.

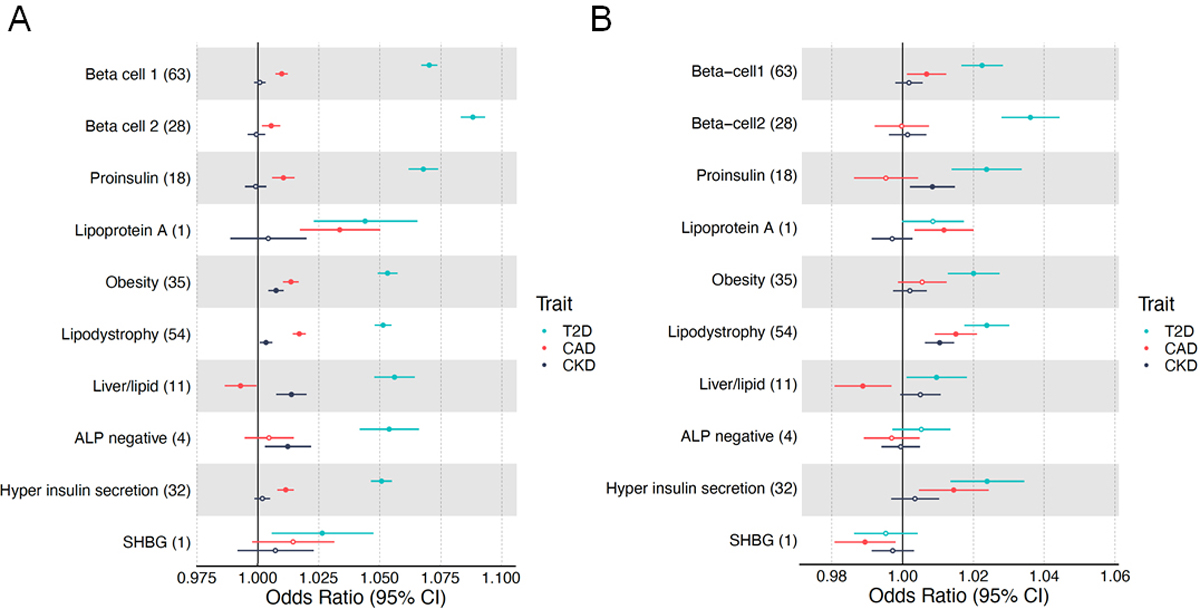
Results: We identified ten clusters of genetic loci, recapturing the five from our prior analysis as well as novel clusters related to beta cell dysfunction, pronounced insulin secretion, and levels of alkaline phosphatase, lipoprotein A and sex hormone-binding globulin. Four clusters related to mechanisms of insulin deficiency, five to insulin resistance and one had an unclear mechanism. The clusters displayed tissue-specific epigenomic enrichment, notably with the two beta cell clusters differentially enriched in functional and stressed pancreatic beta cell states. Additionally, cluster-specific polygenic scores were differentially associated with patient clinical characteristics and outcomes. The pipeline was applied to coronary artery disease and chronic kidney disease, identifying multiple overlapping clusters with type 2 diabetes.

Conclusions/interpretation: Our approach stratifies type 2 diabetes loci into physiologically interpretable genetic clusters associated with distinct tissues and clinical outcomes. The pipeline allows for efficient updating as additional GWAS become available and can be readily applied to other conditions, facilitating clinical translation of GWAS findings. Software to perform this clustering pipeline is freely available.

Keywords: Bayesian non-negative matrix factorisation; Clustering; Disease pathways; GWAS; Genetics; NMF; Polygenic risk scores; Subtypes; Type 2 diabetes; bNMF.


Figures

Fig. 1
Fig. 1
Cluster associations with metabolic traits using GWAS. Forest plot showing standardised effect sizes with 95% CI of cluster pPS–trait associations derived from GWAS summary statistics. Three metabolic traits (fasting insulin, fasting proinsulin adjusted for fasting insulin, and DI) that help discriminate clusters are displayed. The numbers in parentheses next to cluster names indicate the number of variants included in the analysis in each cluster. ‘All SNPs’ includes all the variants that are top-weighted in at least one cluster. Filled points indicate p values <0.05
Fig. 2
Fig. 2
Clusters of type 2 diabetes loci. Top-weighted loci and traits in each of the ten clusters are represented in circular plots: (a) Beta cell 1, (b) Beta cell 2, (c) Proinsulin, (d) Lipoprotein A, (e) SHBG, (f) Obesity, (g) Lipodystrophy, (h) Liver/lipid, (i) ALP negative, (j) Hyper insulin secretion. The length of the bars shows the weights. Green bars represent top-weighted loci, red bars represent increased trait association, and blue bars represent decreased trait association with each cluster. A maximum of 35 elements (loci and traits) based on highest weights are displayed in each cluster. The blue outline indicates clusters associated with decreased fasting insulin levels, and the red outline indicates clusters associated with increased fasting insulin levels
Fig. 3
Fig. 3
Enrichment for tissue-specific enhancers in type 2 diabetes clusters. (a) Heatmap of tissue enhancer/promoter enrichment analysis result. (b) Heatmap of pancreatic islet cell enrichment analysis result. Significance was indicated as follows: *** FDR < 0.001, ** FDR < 0.01, * FDR < 0.1, • p < 0.05. (c) Forest plot of comparison of Beta cell 1 and Beta cell 2 clusters in fgwas enrichment analysis in functional and stressed beta cell states
Fig. 4
Fig. 4
Forest plot of cluster associations with outcomes using (a) GWAS and (b) individual-level data from MGB Biobank. (a) Forest plot showing standardised effect sizes with 95% CI of cluster pPS–outcome associations derived from GWAS summary statistics. Three metabolic outcomes (type 2 diabetes, CAD and CKD, all unadjusted for type 2 diabetes) are displayed. The numbers in parentheses next to cluster names indicate the number of variants included in the analysis in each cluster. Filled points indicate p values <0.05. (b) Forest plot of associations of pPSs in individuals in the MGB Biobank with clinical outcomes. Three outcomes including type 2 diabetes are displayed. T2D, type 2 diabetes

References

    1. Redondo MJ, Hagopian WA, Oram R, et al. (2020) The clinical consequences of heterogeneity within and between different diabetes types. Diabetologia 63(10):2040–2048 - PMC - PubMed
    1. Mahajan A, Taliun D, Thurner M, et al. (2018) Fine-mapping type 2 diabetes loci to single-variant resolution using high-density imputation and islet-specific epigenome maps. Nat Genet 50(11):1505–1513 - PMC - PubMed
    1. Goodarzi MO, Palmer ND, Cui J, et al. (2020) Classification of type 2 diabetes genetic variants and a novel genetic risk score association with insulin clearance. J Clin Endocrinol Metab 105(4):1251–1260 - PMC - PubMed
    1. Mahajan A, Wessel J, Willems SM, et al. (2018) Refining the accuracy of validated target identification through coding variant fine-mapping in type 2 diabetes. Nat Genet 50(4):559–571 - PMC - PubMed
    1. Udler MS, Kim J, von Grotthuss M, et al. (2018) Type 2 diabetes genetic loci informed by multi-trait associations point to disease mechanisms and subtypes: a soft clustering analysis. PLoS Med 15(9):e1002654. - PMC - PubMed

Publication types

MeSH terms