. 2023 Feb 8;8(3):e164489.
doi: 10.1172/jci.insight.164489.

Acute high-fat diet impairs macrophage-supported intestinal damage resolution

Affiliations

Acute high-fat diet impairs macrophage-supported intestinal damage resolution

Andrea A Hill et al. JCI Insight. .

Abstract

Chronic exposure to high-fat diets (HFD) worsens intestinal disease pathology, but acute effects of HFD in tissue damage remain unclear. Here, we used short-term HFD feeding in a model of intestinal injury and found sustained damage with increased cecal dead neutrophil accumulation, along with dietary lipid accumulation. Neutrophil depletion rescued enhanced pathology. Macrophages from HFD-treated mice showed reduced capacity to engulf dead neutrophils. Macrophage clearance of dead neutrophils activates critical barrier repair and antiinflammatory pathways, including IL-10, which was lost after acute HFD feeding and intestinal injury. IL-10 overexpression restored intestinal repair after HFD feeding and intestinal injury. Macrophage exposure to lipids from the HFD prevented tethering and uptake of apoptotic cells and Il10 induction. Milk fat globule-EGF factor 8 (MFGE8) is a bridging molecule that facilitates macrophage uptake of dead cells. MFGE8 also facilitates lipid uptake, and we demonstrate that dietary lipids interfere with MFGE8-mediated macrophage apoptotic neutrophil uptake and subsequent Il10 production. Our findings demonstrate that HFD promotes intestinal pathology by interfering with macrophage clearance of dead neutrophils, leading to unresolved tissue damage.

Keywords: Immunology; Macrophages; Neutrophils.


Figures

Figure 1
Figure 1. Impaired resolution of intestinal damage after acute high-fat diet.
C57BL/6J mice were fed LFD or HFD for 1 week. Mice were then left untreated or treated with 2% DSS in drinking water for 5 days. (A) Body weight (n = 8 mice/group). The following panels are measurements in cecum of mice in A. (B and C) Representative H&E staining and blinded colitis score at indicated day after DSS treatment (n = 8 mice/group). (D and E) Representative image and quantification of proliferating cells (Ki67+) at indicated day after DSS treatment (n = 8 mice/group). An average of 3 high-powered filed (HPF) images per mouse was used for image quantification. Scale bar: 100 μm. Data are presented as mean ± SEM. *P < 0.05, ***P < 0.001, ****P < 0.0001. Statistical comparisons were performed using Student’s t test (A) and 1-way ANOVA with Tukey’s post hoc test (C and E), and if not indicated, a comparison is not significant.
Figure 2
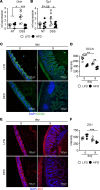
Figure 2. Decreased tight junctions in cecum of HFD-fed mice after DSS.
(A and B) Occludin (Ocln) (n = 4 LFD and HFD, n = 6 LFD DSS, n = 8 HFD DSS) and Zo1 (Tjp1) gene expression at day 7 days after DSS treatment (n = 6 LFD, HFD, LFD DSS; n = 8 HFD DSS). (CF) Representative image and quantification of Occludin (OCLN) (C and D) and ZO1 (E and F) at indicated day after DSS treatment (n = 4 mice/group). An average of 3 high-powered filed (HPF) images per mouse was used for image quantification. Scale bar: 100 μm. Data are presented as mean ± SEM. *P < 0.05, **P < 0.01, ***P < 0.001, ****P < 0.0001. Statistical comparisons were performed using Student’s t test (A and B) and 1-way ANOVA with Tukey’s post hoc test (D and F), and if not indicated, a comparison is not significant.
Figure 3
Figure 3. Decreased mucus production and increased epithelial bacterial encroachment in cecum of HFD-fed mice after DSS.
(AC) Immunofluorescence staining for mucus (MUC2, green) and bacteria (FISH, red) and quantification of MUC2 and bacterial distance from IEC in LFD and HFD mice at indicated day of DSS treatment (n = 3 day 0, n = 4 day 5 and day 9 mice/group). An average measurement of 3 high-powered filed (HPF) images per mouse was used for image quantification. Scale bar: 100 μm or 50 μm, as indicated. Data are presented as mean ± SEM. *P < 0.05, **P < 0.01, ***P < 0.001, ****P < 0.0001. Statistical comparisons were performed using 1-way ANOVA with Tukey’s post hoc test (B and C), and if not indicated, a comparison is not significant.
Figure 4
Figure 4. Continued dead neutrophil accumulation in cecum of HFD-fed mice after DSS.
(AD) Representative staining and quantification of total neutrophils (Ly6G+), total TUNEL+ cells, and TUNEL+ neutrophils in cecum of LFD and HFD control and DSS mice (n = 4 day 0, n = 5 day 5 and day 9 mice/group). An average measurement of 3 high-powered filed (HPF) images per mouse was used for image quantification. Scale bar: 100 μm. Data are presented as mean ± SEM. *P < 0.05,***P < 0.001, ****P < 0.0001. Statistical comparisons were performed using 1-way ANOVA with Tukey’s post hoc test, and if not indicated, a comparison is not significant.
Figure 5
Figure 5. Neutrophil depletion restores damage resolution in HFD-fed mice.
(AC) Cxcl1, Cxcl2, and Cxcr2 gene expression in cecum of LFD- and HFD-fed control and DSS-treated mice (n = 4 mice/group). Data shown are representative of 2 experiments. (DJ) At day 4 of DSS, HFD-fed mice received a single dose of anti-IgG2a isotype control or anti-Ly6g (n = 6 mice/group). (D) Body weight changes. (E) Representative H&E images. (F) Blinded colitis score. (G) Representative staining. (H) Quantification for proliferating cells. (I) Representative Alcian blue/PAS staining. (J) Quantification of goblet cells. An average measurement of 3 high-powered filed (HPF) images per mouse was used for image quantification. Data are presented as mean ± SEM. *P < 0.05, **P < 0.01, ***P < 0.001, ****P < 0.0001. Statistical comparisons were performed using 1-way ANOVA with Tukey’s post hoc test (AC) or Student’s t test (D, F, H, and J), and if not indicated, a comparison is not significant. Scale bar: 100 μm.
Figure 6
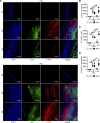
Figure 6. Neutrophil depletion restores mucus production with decreased epithelial bacterial encroachment in cecum of HFD-fed mice after DSS.
(AC) Representative image for nuclei, mucus, and bacteria, and quantification of MUC2 intensity and bacterial encroachment (n = 4 mice/group). (D and E) Representative staining and quantification of TUNEL+ cells. An average measurement of 3 high-powered filed (HPF) images per mouse was used for image quantification. Data are presented as mean ± SEM. **P < 0.01, ***P < 0.001,****P < 0.0001. Statistical comparisons were performed using Student’s t test, and if not indicated, a comparison is not significant. Scale bar: 100 μm or 50 μm, as indicated.
Figure 7
Figure 7. Lipids impair macrophage uptake of dead neutrophils.
(A and B) Representative image and quantification of the percentage of tethered TAMRA+ neutrophils in sorted macrophages from LFD- and HFD-fed mice after DSS treatment. Data shown are representative of 2 experiments (n = 11 LFD DSS and n = 15 HFD DSS HPF images). (C and D) Representative immunofluorescence image and quantification from phagocytosis assay stained for macrophages, nuclei, and dead neutrophils (TAMRA+) in control (Ctrl) or oleic acid (OA) pretreated BMDMs. The percentage of TAMRA+ macrophages is indicative of the percentage of macrophages that phagocytosed TAMRA+ dead neutrophils. (E) Quantification of the percentage of BMDMs that have phagocytosed 1 or 2 or more TAMRA+ neutrophils after Ctrl or OA pretreatment. (F) Quantification of percent of BMDMs with tethered TAMRA+ neutrophils after Ctrl or OA pretreatment. Data shown are representative of 2 experiments (n = 6 control and n = 10 oleic acid HPF images). (GJ) Similar measurements as in BD in Ctrl or palmitic acid (PA) pretreated BMDMs. Data shown are representative of 2 experiments (n = 10 control and palmitic acid HPF images). Data are presented as mean ± SEM. *P < 0.05, **P < 0.01, ***P < 0.001, ****P < 0.0001. Statistical comparisons were performed using Student’s t test, and if not indicated, a comparison is not significant. Scale bar: 100 μm or 10 μm, as indicated.
Figure 8
Figure 8. Lost Il10 expression after HFD feeding and DSS treatment.
(A and B) Il10 gene expression from cecum (n = 4 LFD and HFD, n = 5 LFD DSS and HFD DSS) (A) and intestinal (B) CX3CR1+ macrophages from LFD- and HFD-fed DSS-treated mice (n = 4 samples/group). (C) Il10 gene expression in control (Ctrl), oleic acid (OA), or palmitic acid (PA) pretreated macrophages after exposure to dead neutrophils (2 pooled experiment with n = 4 technical replicates/group). (D) Body weight change in HFD-fed DSS-treated mice after hydrodynamic delivery of control or IL-10–producing plasmid (n = 6 control and n = 9 IL-10 mice/group). (EL) measurements in cecum of mice in D (n = 6 mice per group). (E and F) Representative H&E staining and blinded colitis score. (G and H) Representative staining and quantification of Ki67+ proliferating cells. (I and J) Occludin (Ocln) and Zo1 (Tjp1) expression. (K and L) Representative Alcian blue/PAS staining and quantification of goblet cells. For all imaging, the average of 3 HPF images was taken per mouse. Data are presented as mean ± SEM. *P < 0.05, **P < 0.01,***P < 0.001, ****P < 0.0001. Statistical comparisons were performed using Student’s t test (B, D, F, H–J, and L) and 1-way ANOVA with Tukey’s post hoc test (A and C), and if not indicated, a comparison is not significant. Scale bar: 100 μm.
Figure 9
Figure 9. Il10 overexpression restores mucus production and decreases epithelial bacterial encroachment in cecum of HFD-fed mice after DSS.
(AC) Representative staining for nuclei, mucus, and bacteria and quantification of MUC2 intensity and bacterial encroachment (n = 4 mice/group). (D and E) Representative image and quantification of TUNEL+ cells (n = 6 mice per group). For all imaging, the average of 3 HPF images was taken per mouse. Data are presented as mean ± SEM. *P < 0.05, **P < 0.01, ****P < 0.0001. Statistical comparisons were performed using Student’s t test (B, C, and E), and if not indicated, a comparison is not significant. Scale bar: 100 μm or 50 μm, as indicated.
Figure 10
Figure 10. Dietary lipids impair MFGE8-mediated apoptotic neutrophil uptake.
(A and B) Representative immunofluorescence staining and quantification for MFGE8 and TUNEL in the cecum of LFD- and HFD-fed mice at indicated day after DSS. Average of 3 HPF images (n = 4 D0 and D5, n = 8 D9) mice/group. (C) Representative images for TAMRA (apoptotic neutrophils) in control-treated BMDMs or BMDMs. (D) Representative images for BODIPY (lipid droplets) in control-treated BMDMs or BMDMs. (E) Quantification of TAMRA+ BMDMs in C. (F) Quantification of BODIPY in BMDMs in D. Data are representative of 2 experiments with 2 images per 3 technical replicates (E and F). (G) IL-10 gene expression in control- or oleic acid–treated BMDMs after exposure to apoptotic neutrophils alone or in the presence of rmMFGE8 (2 mg/mL). Two experiments were performed, with 4 technical replicates/group. Data are presented as mean ± SEM. *P < 0.05, **P < 0.01, ***P < 0.001, ****P < 0.0001. Statistical comparisons were performed using 1-way ANOVA with Tukey’s post hoc test (B and EG), and if not indicated, a comparison is not significant. Scale bars: 100 μm or 10 μm, as indicated.

References

    1. Soehnlein O, Lindbom L. Phagocyte partnership during the onset and resolution of inflammation. Nat Rev Immunol. 2010;10(6):427–439. doi: 10.1038/nri2779. - DOI - PubMed
    1. Grainger JR, Grencis RK. Neutrophils worm their way into macrophage long-term memory. Nat Immunol. 2014;15(10):902–904. doi: 10.1038/ni.2990. - DOI - PubMed
    1. Kim ND, Luster AD. The role of tissue resident cells in neutrophil recruitment. Trends Immunol. 2015;36(9):547–555. doi: 10.1016/j.it.2015.07.007. - DOI - PMC - PubMed
    1. Szabady RL, McCormick BA. Control of neutrophil inflammation at mucosal surfaces by secreted epithelial products. Front Immunol. 2013;4:220. - PMC - PubMed
    1. Fournier BM, Parkos CA. The role of neutrophils during intestinal inflammation. Mucosal Immunol. 2012;5(4):354–366. doi: 10.1038/mi.2012.24. - DOI - PubMed

Publication types