The microbiome shifts throughout the gastrointestinal tract of Bradford cattle in the Pampa biome
- PMID: 36538559
- PMCID: PMC9767327
- DOI: 10.1371/journal.pone.0279386
The microbiome shifts throughout the gastrointestinal tract of Bradford cattle in the Pampa biome
Abstract
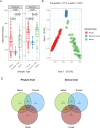
A deep understanding of the cattle gastrointestinal microbiome is crucial to selective breeding high-efficiency animals that produce more and generate less environmental damage. Here we performed the taxonomic identification of Bacterial and Archaeal communities using high throughput 16SrRNA gene sequencing from critical compartments of the gastrointestinal tract of Bradford cattle raised in a natural grassland in the Pampa biome, Brazil. We analyzed 110 samples, including saliva, ruminal fluid, and feces from 36 months old Bradford heifers (weighing on average 343 ± 30 kg by the sampling time). To reduce unexpected variation and confounders, we selected the animals from the same breed, submitted them to the same food source, and collected the samples for three consecutive years from different animals in the same season. Our main goal was to analyze the microbial shifts throughout the gastrointestinal tract to reference future works proposing management strategies and interventions to improve animal nutrition and increase production in the Pampa Biome. To accomplish our objective, we accessed the microbial community differences in groups with a high and low weight gain controlling for food ingestion and quality of grazed pasture. Few taxa were shared among the samples. About 40% of the phyla and 60% of the genera were unique from saliva samples, and 12.4% of the microbial genera were uniquely found in feces. All samples shared only 36.1% of phyla and 7.5% of genera. Differences in microbial diversity and taxa counts were observed. The ruminal fluid presented the lowest microbial richness, while saliva and feces presented the highest microbial richness. On the other hand, saliva and feces also presented more distinct communities between themselves when compared with ruminal samples. Our data showed that the saliva microbiome is not representative of the rumen microbiome and should not be used as an easy-to-collect sample for studies about the rumen microbiome.
Copyright: © 2022 de Freitas et al. This is an open access article distributed under the terms of the Creative Commons Attribution License, which permits unrestricted use, distribution, and reproduction in any medium, provided the original author and source are credited.
Conflict of interest statement
The authors have declared that no competing interests exist.
Figures


References
-
- Groen AF. Cattle breeding goals and production circumstances. phd, Groen. 1989. Available: https://library.wur.nl/WebQuery/wurpubs/10592
-
- Roesch LFW, Vieira FCB, Pereira VA, Schünemann AL, Teixeira IF, Senna AJT, et al.. The Brazilian Pampa: a fragile biome. Diversity. 2009;1: 182–198.
Publication types
MeSH terms
Substances
LinkOut - more resources
Full Text Sources

