. 2022 Dec 19;57(24):2714-2730.e8.
doi: 10.1016/j.devcel.2022.11.015.

ΔNp63/p73 drive metastatic colonization by controlling a regenerative epithelial stem cell program in quasi-mesenchymal cancer stem cells

Affiliations

ΔNp63/p73 drive metastatic colonization by controlling a regenerative epithelial stem cell program in quasi-mesenchymal cancer stem cells

Arthur W Lambert et al. Dev Cell. .

Abstract

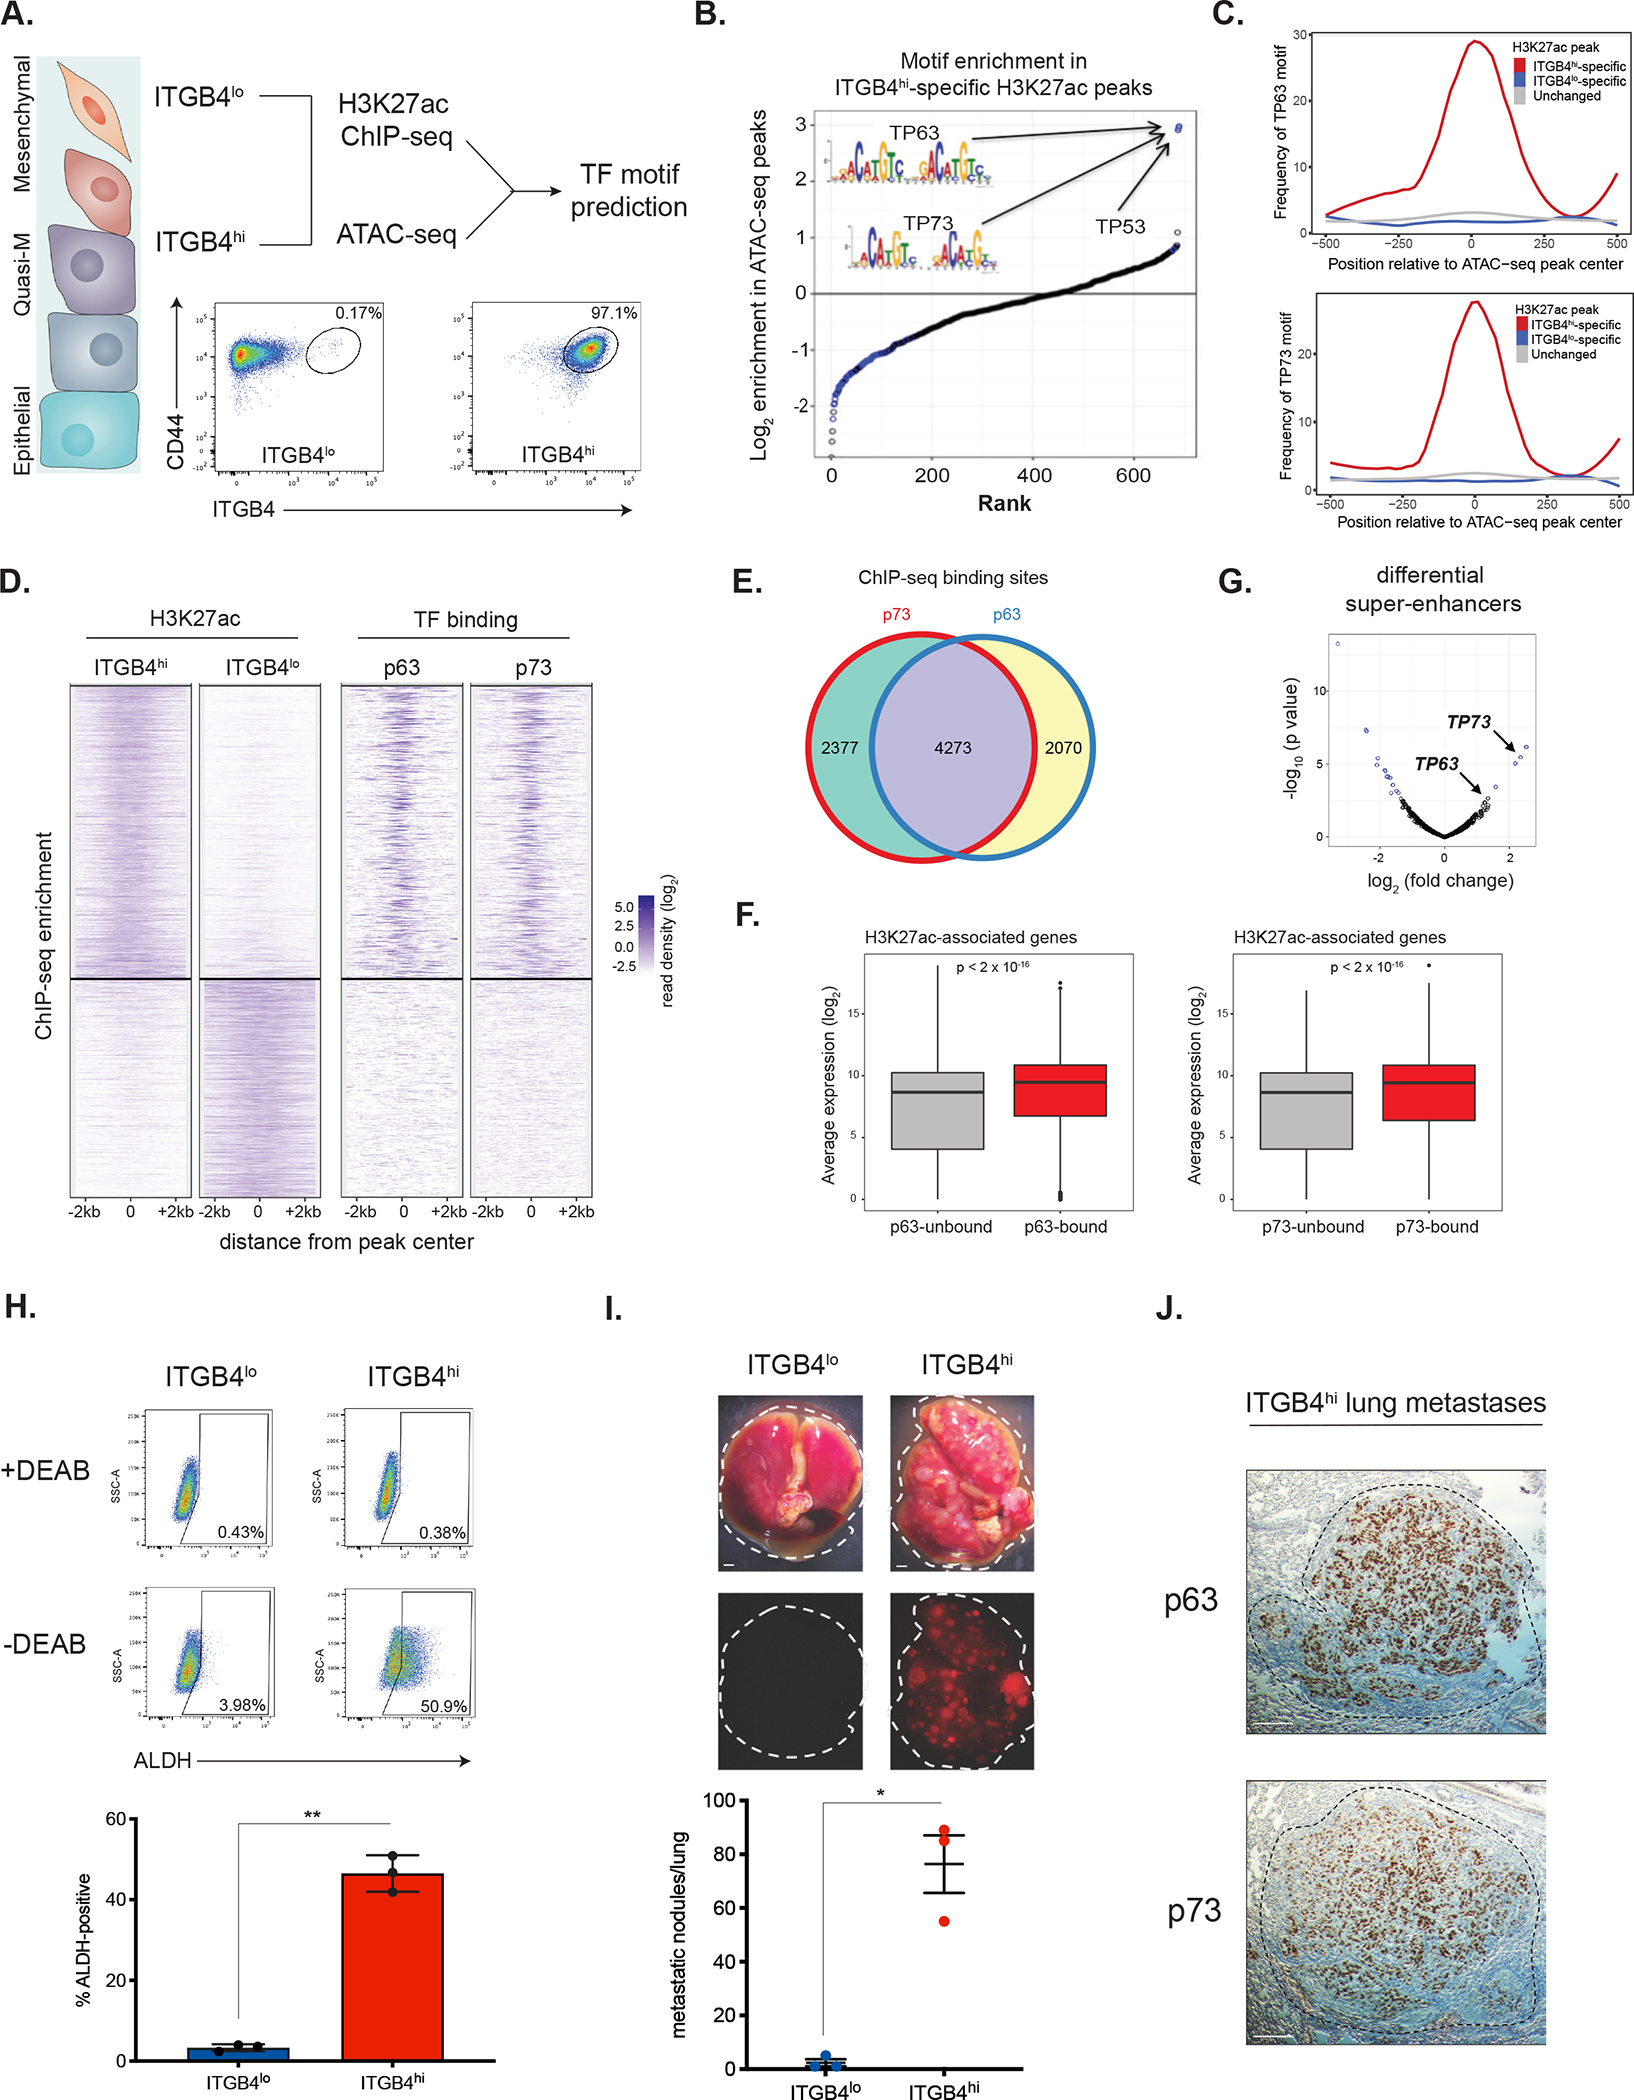
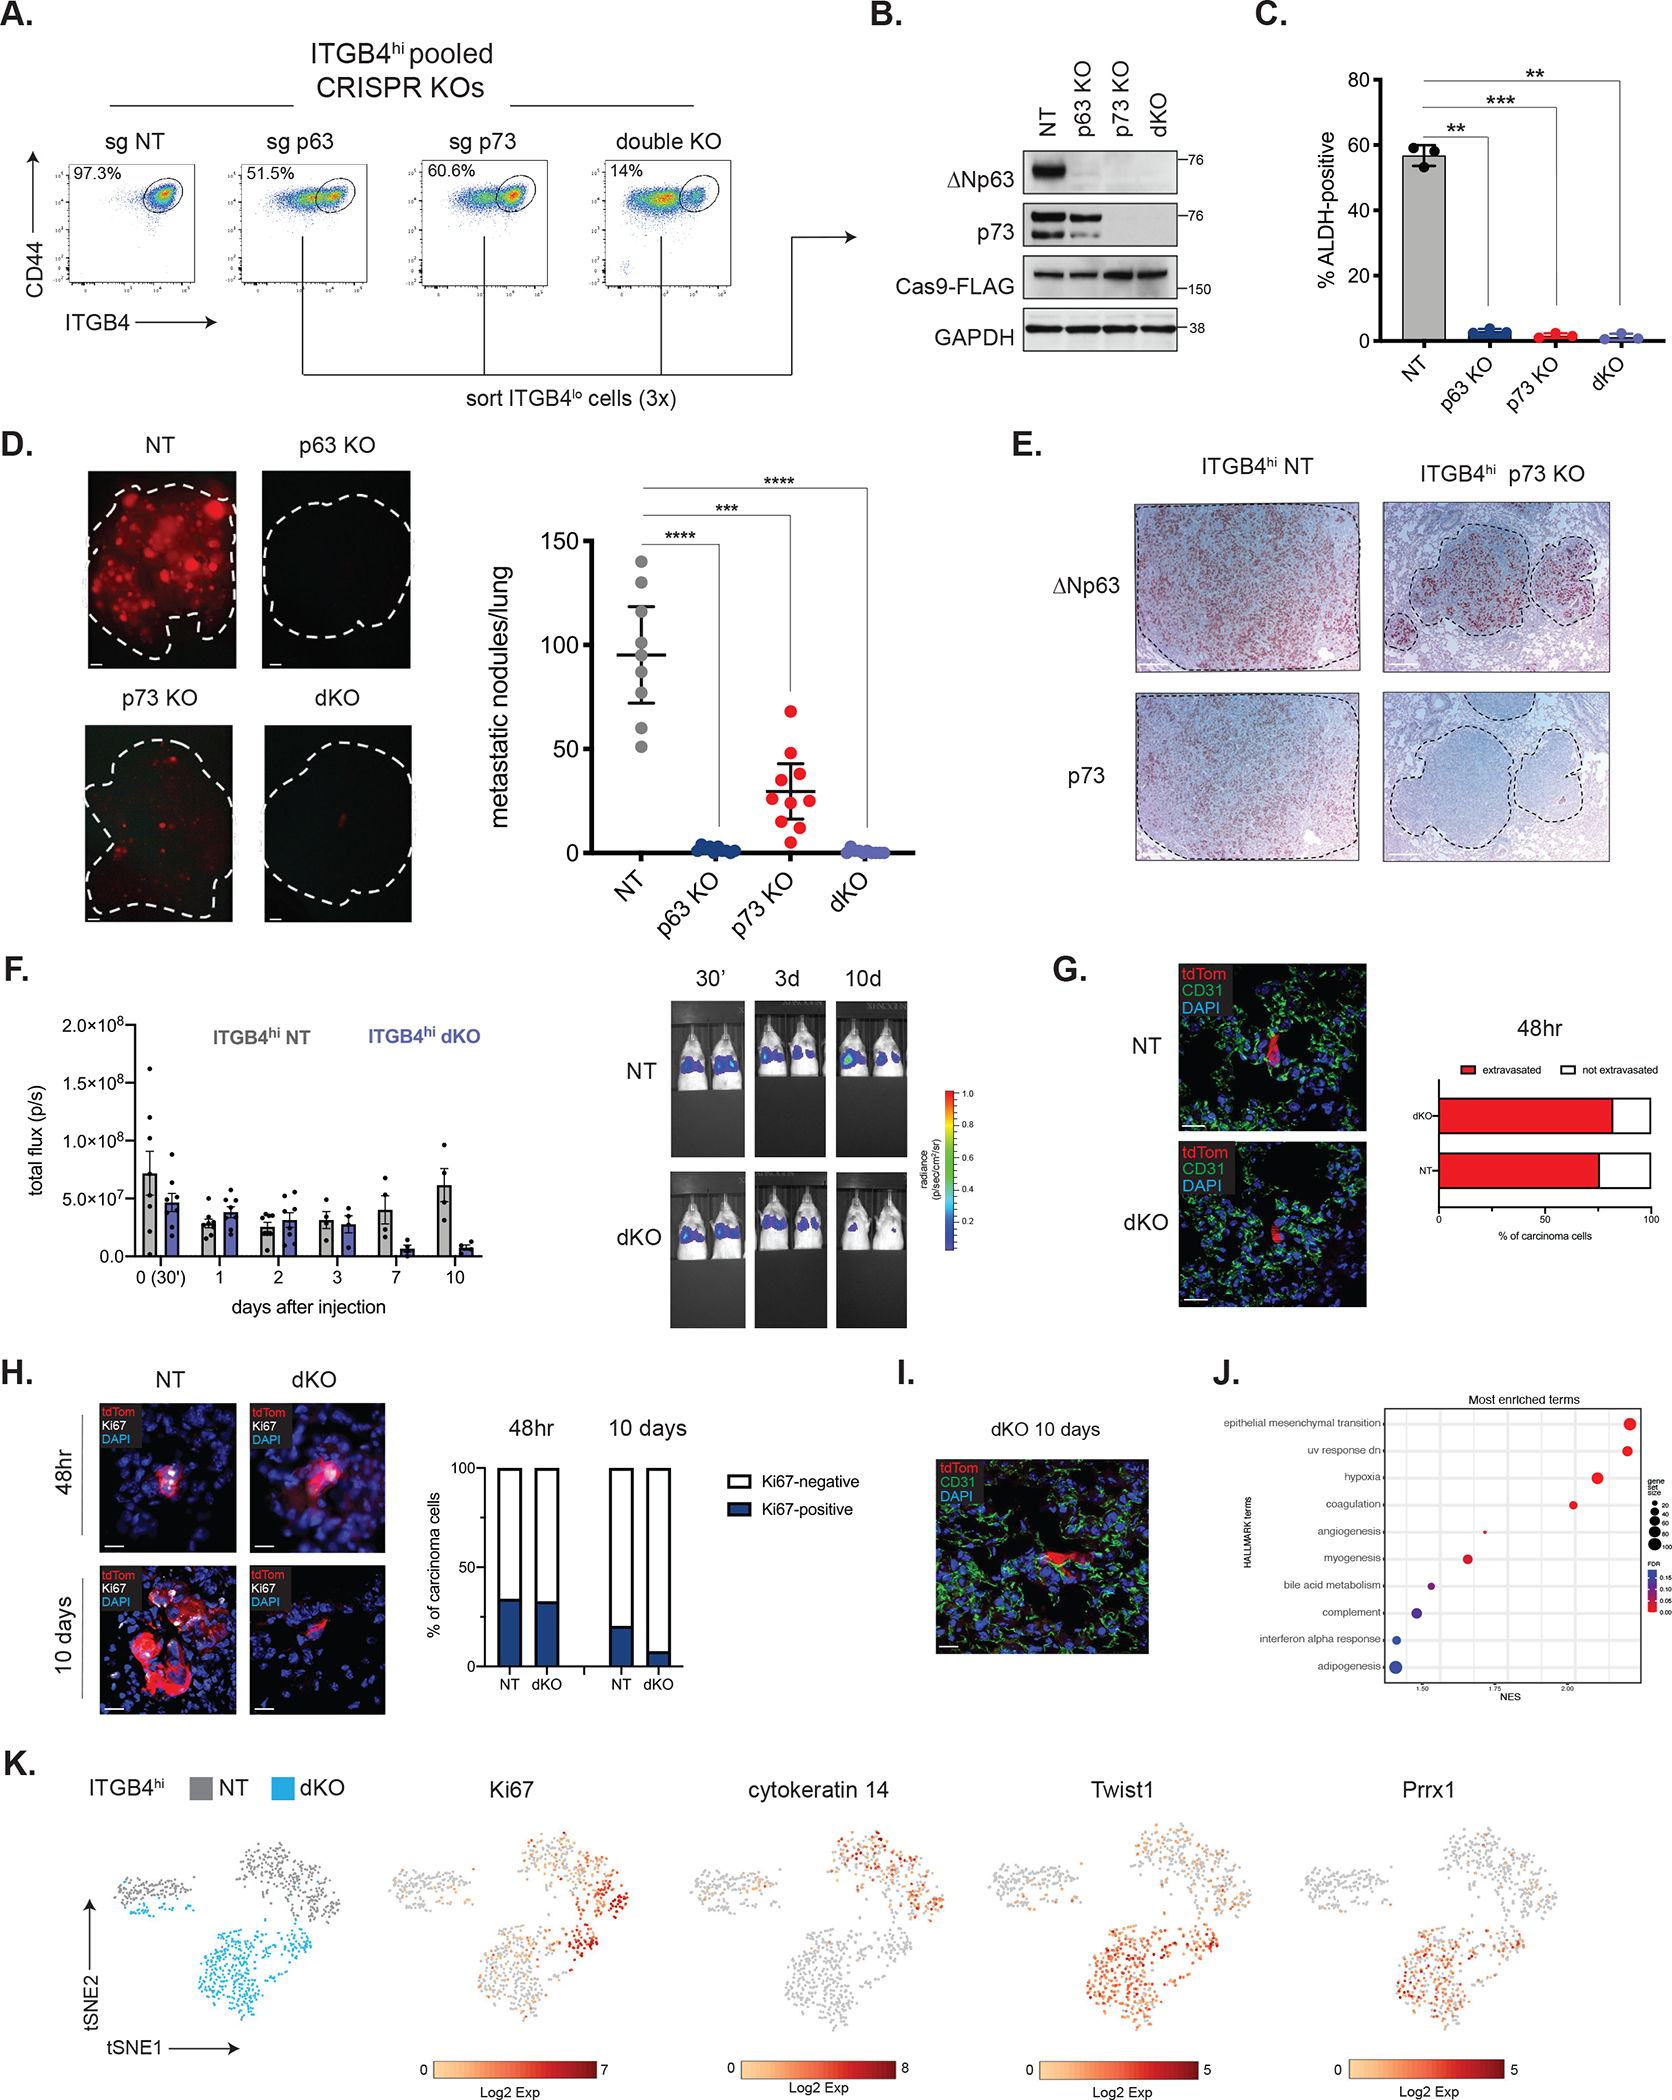
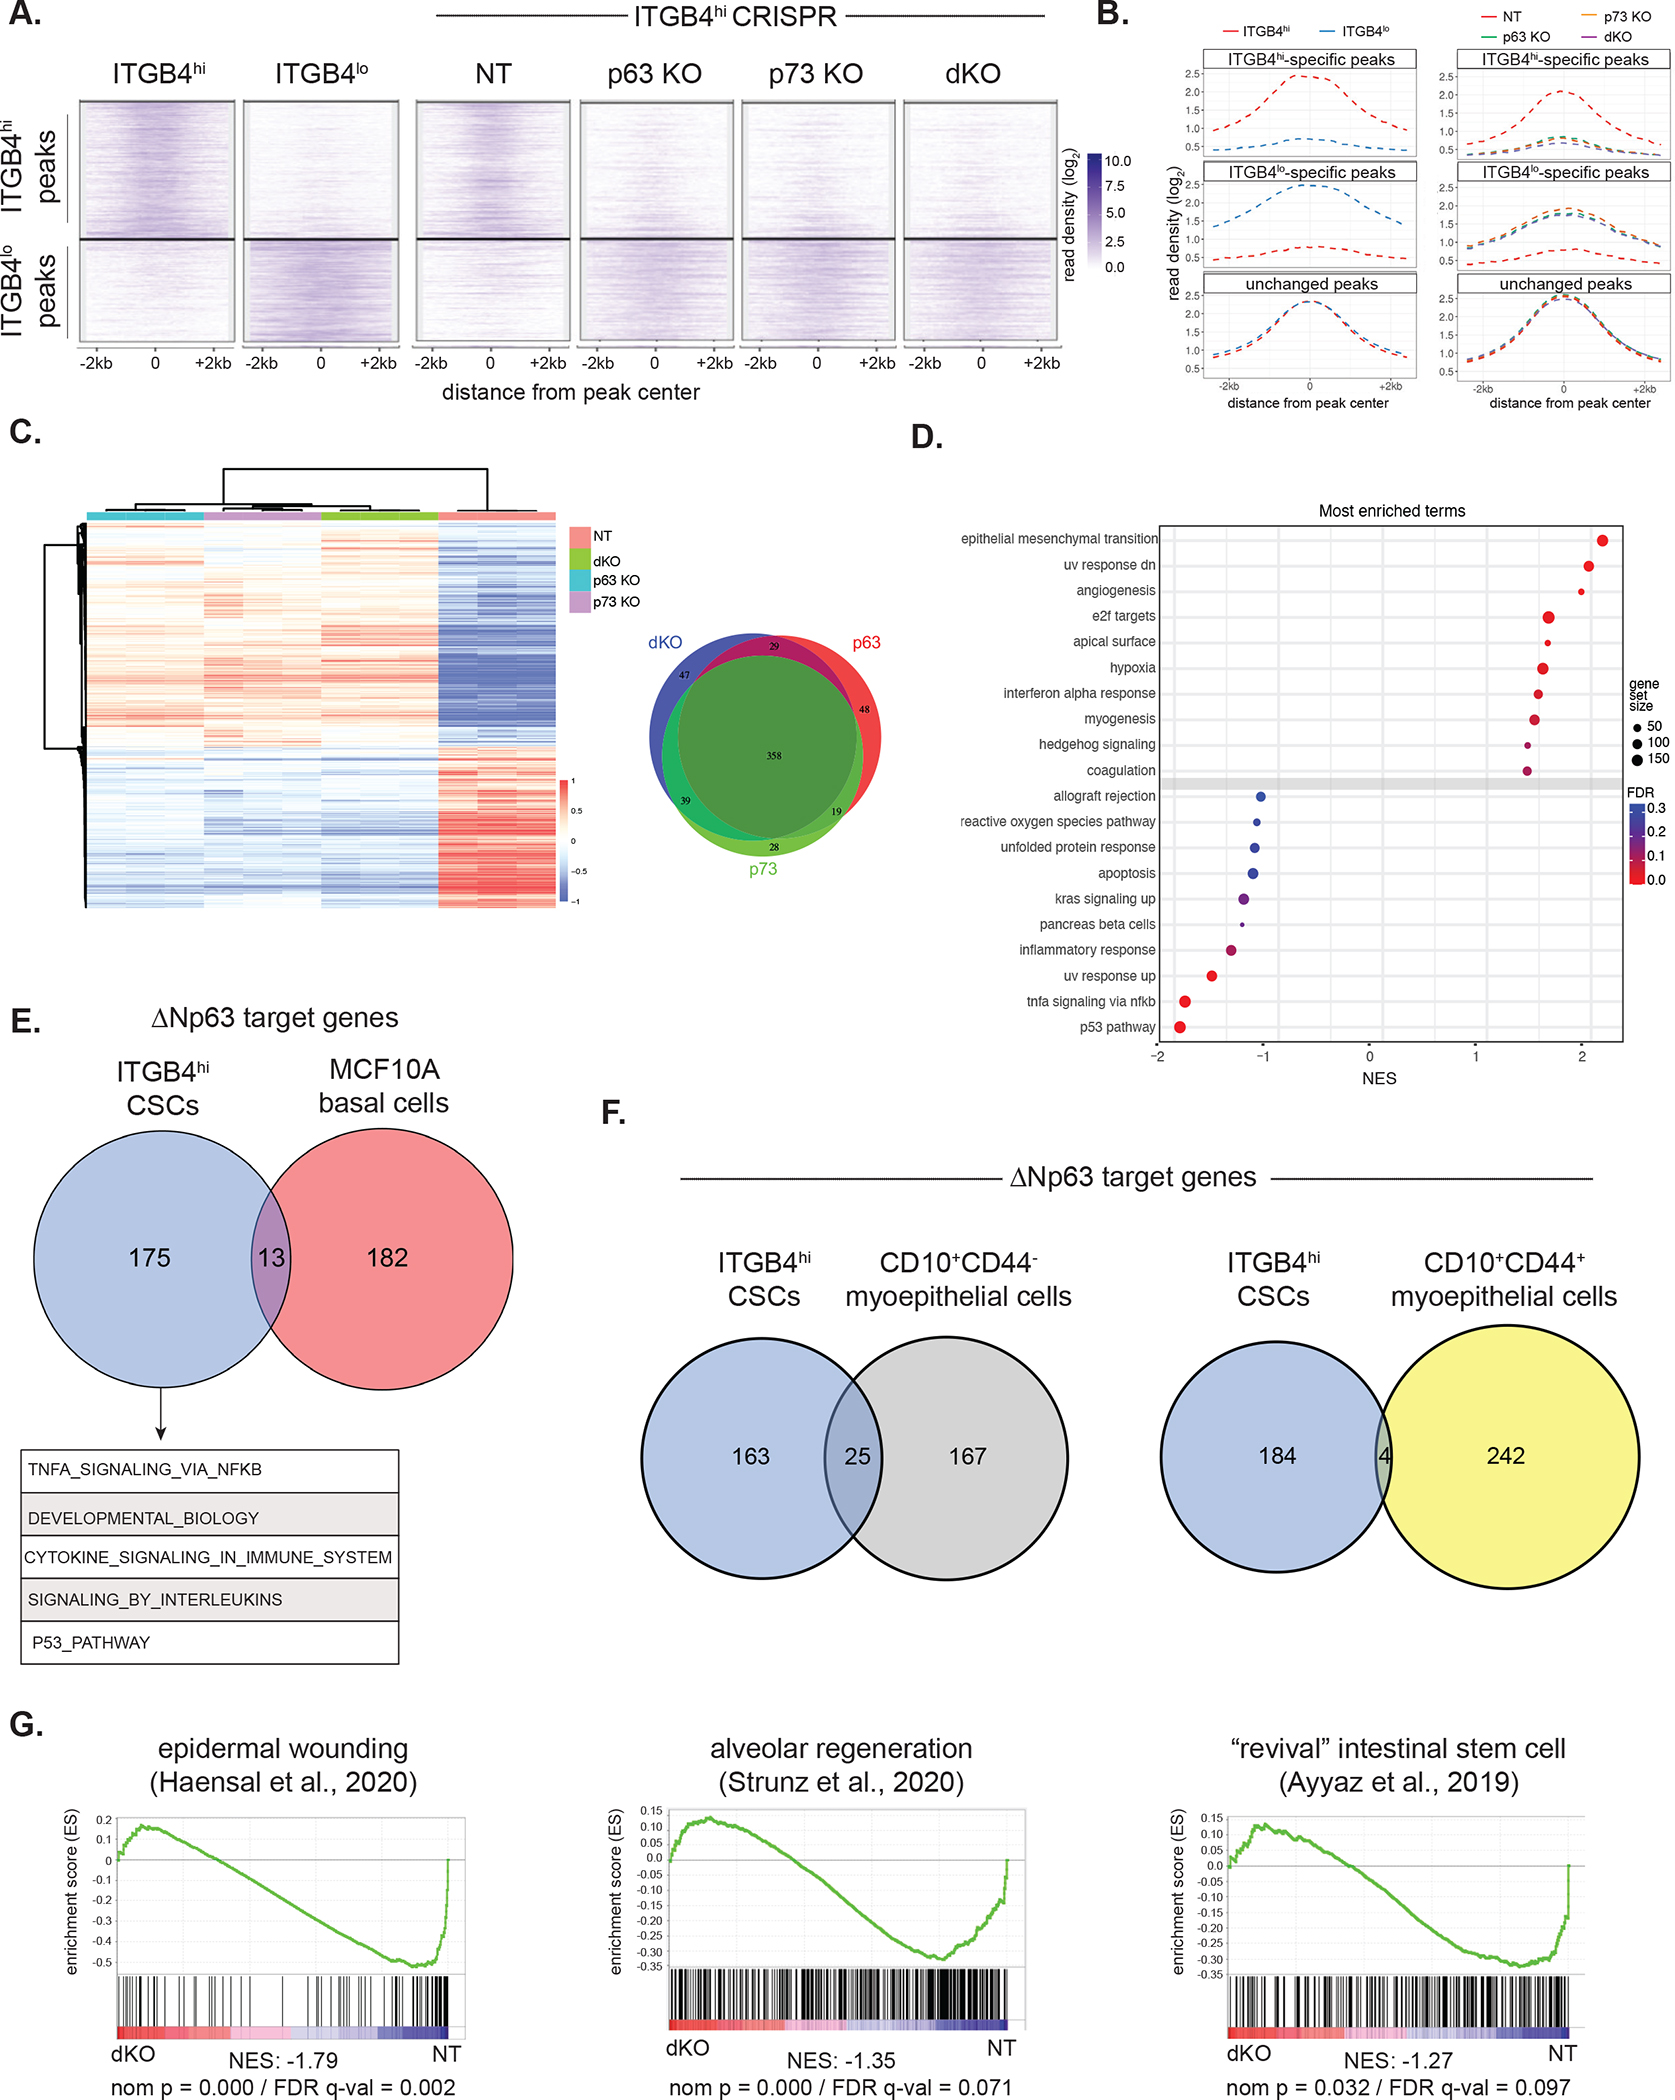
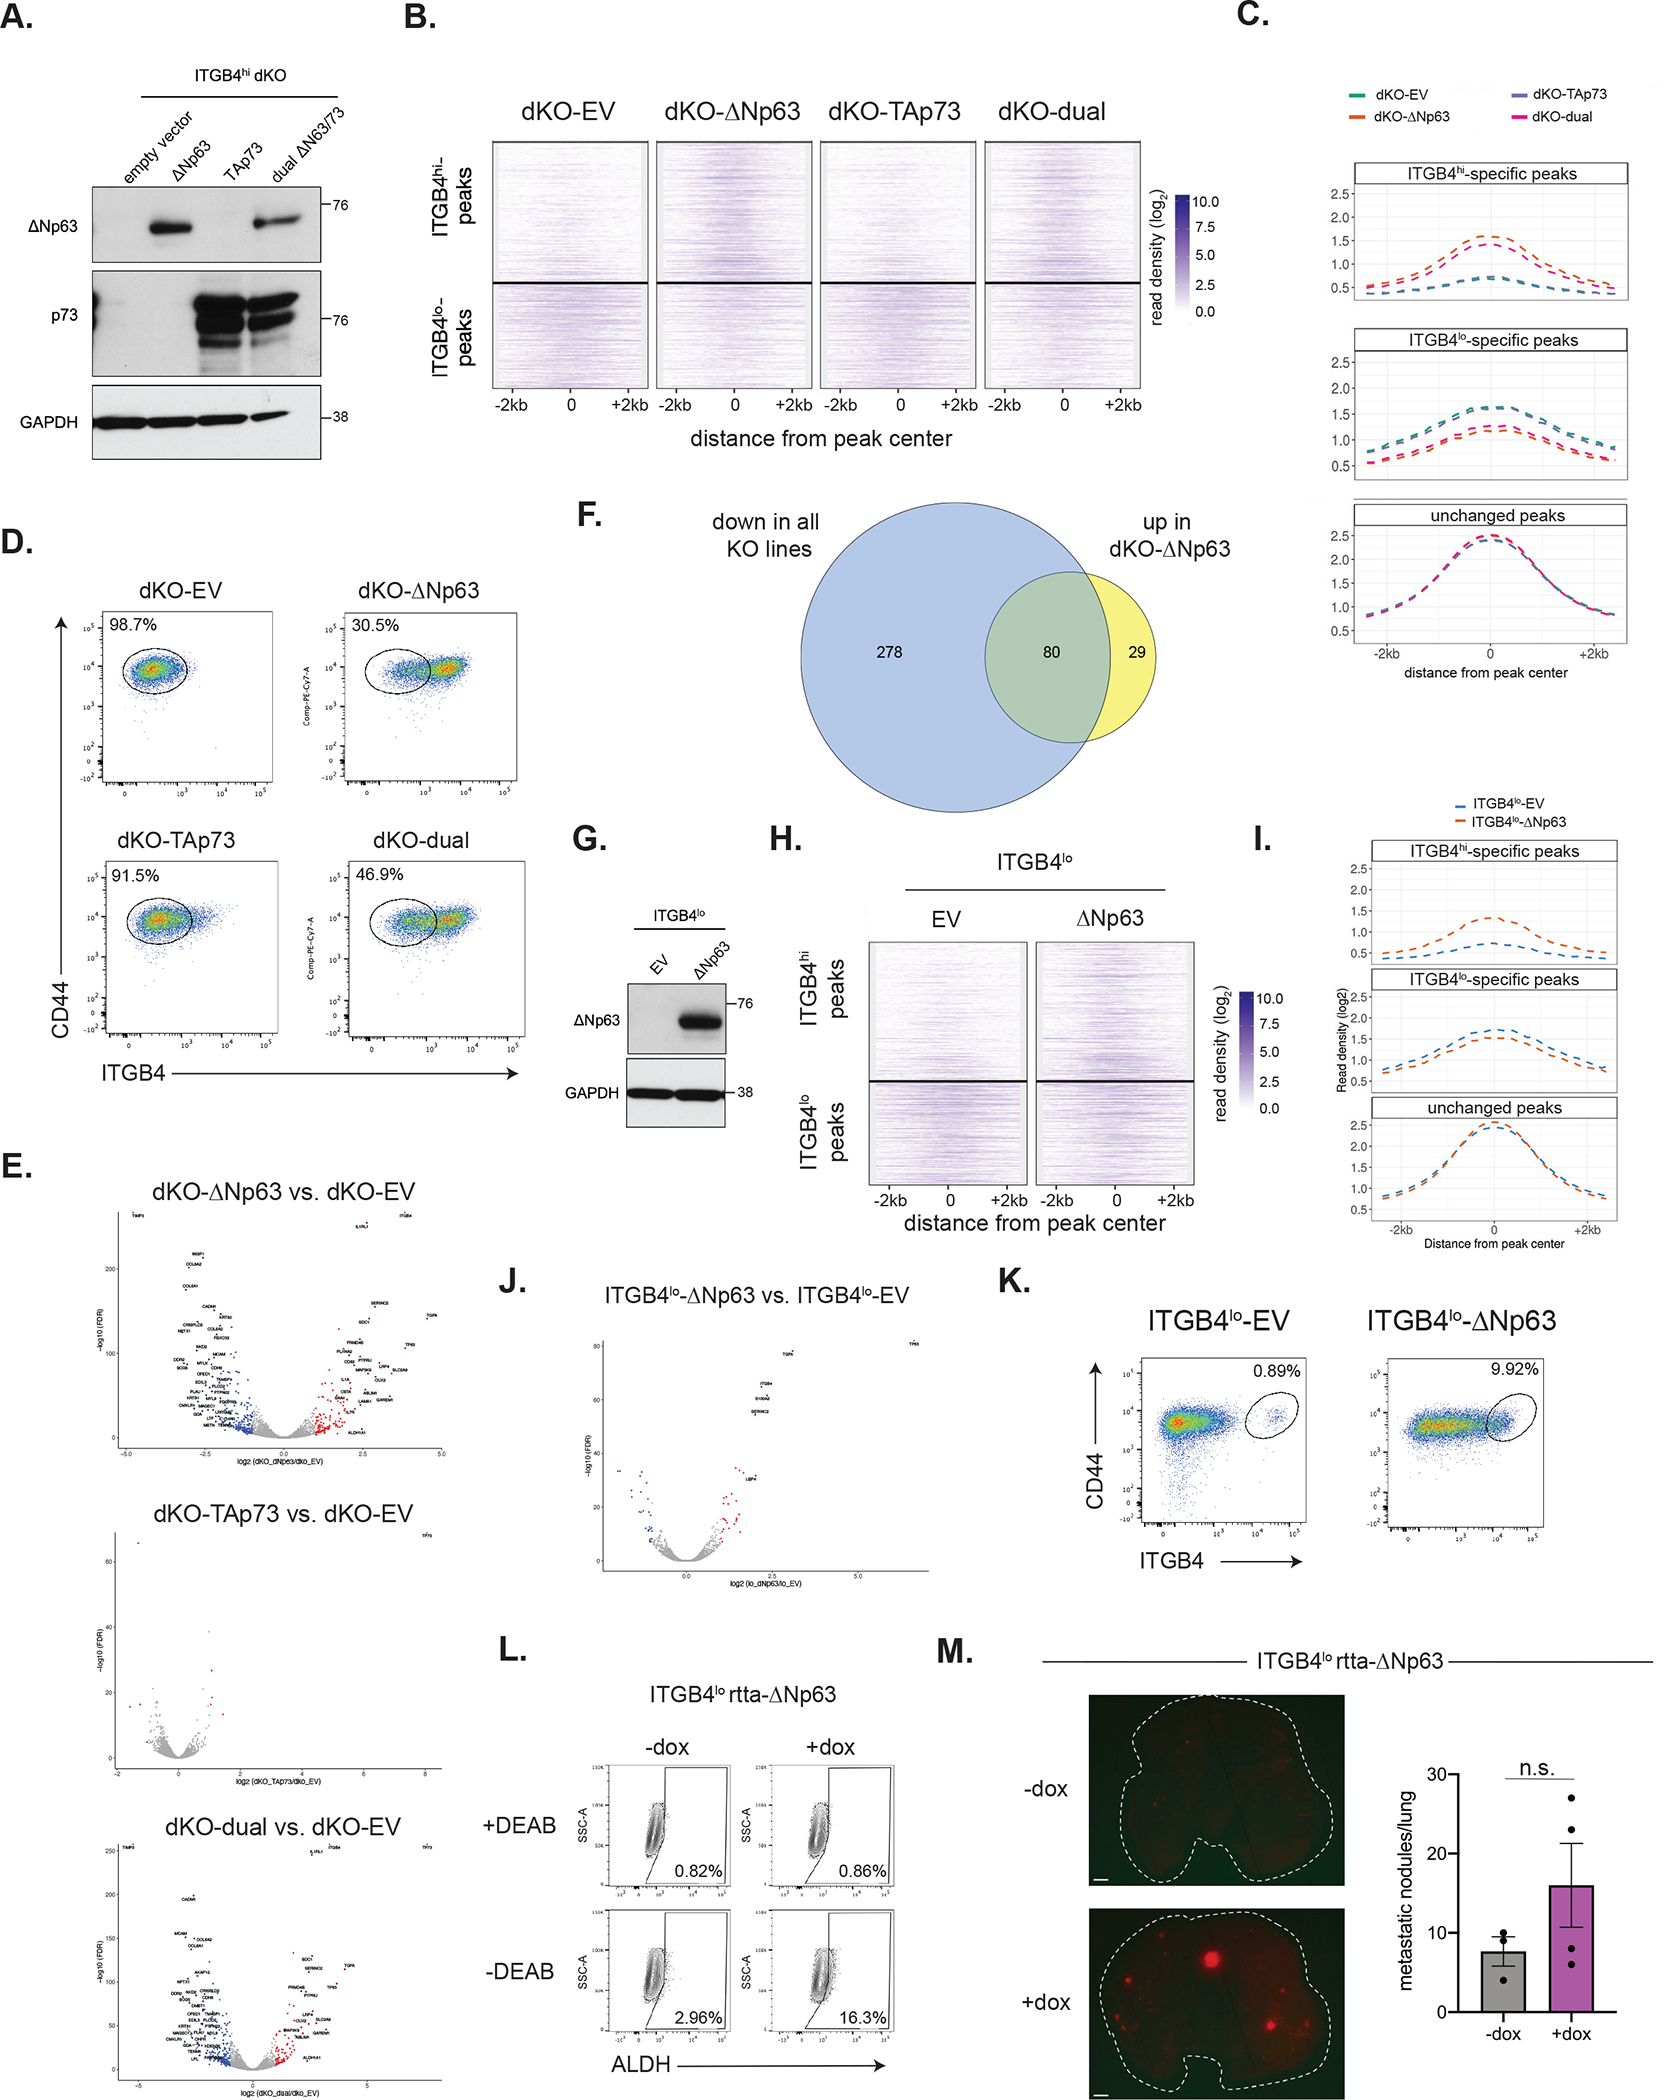
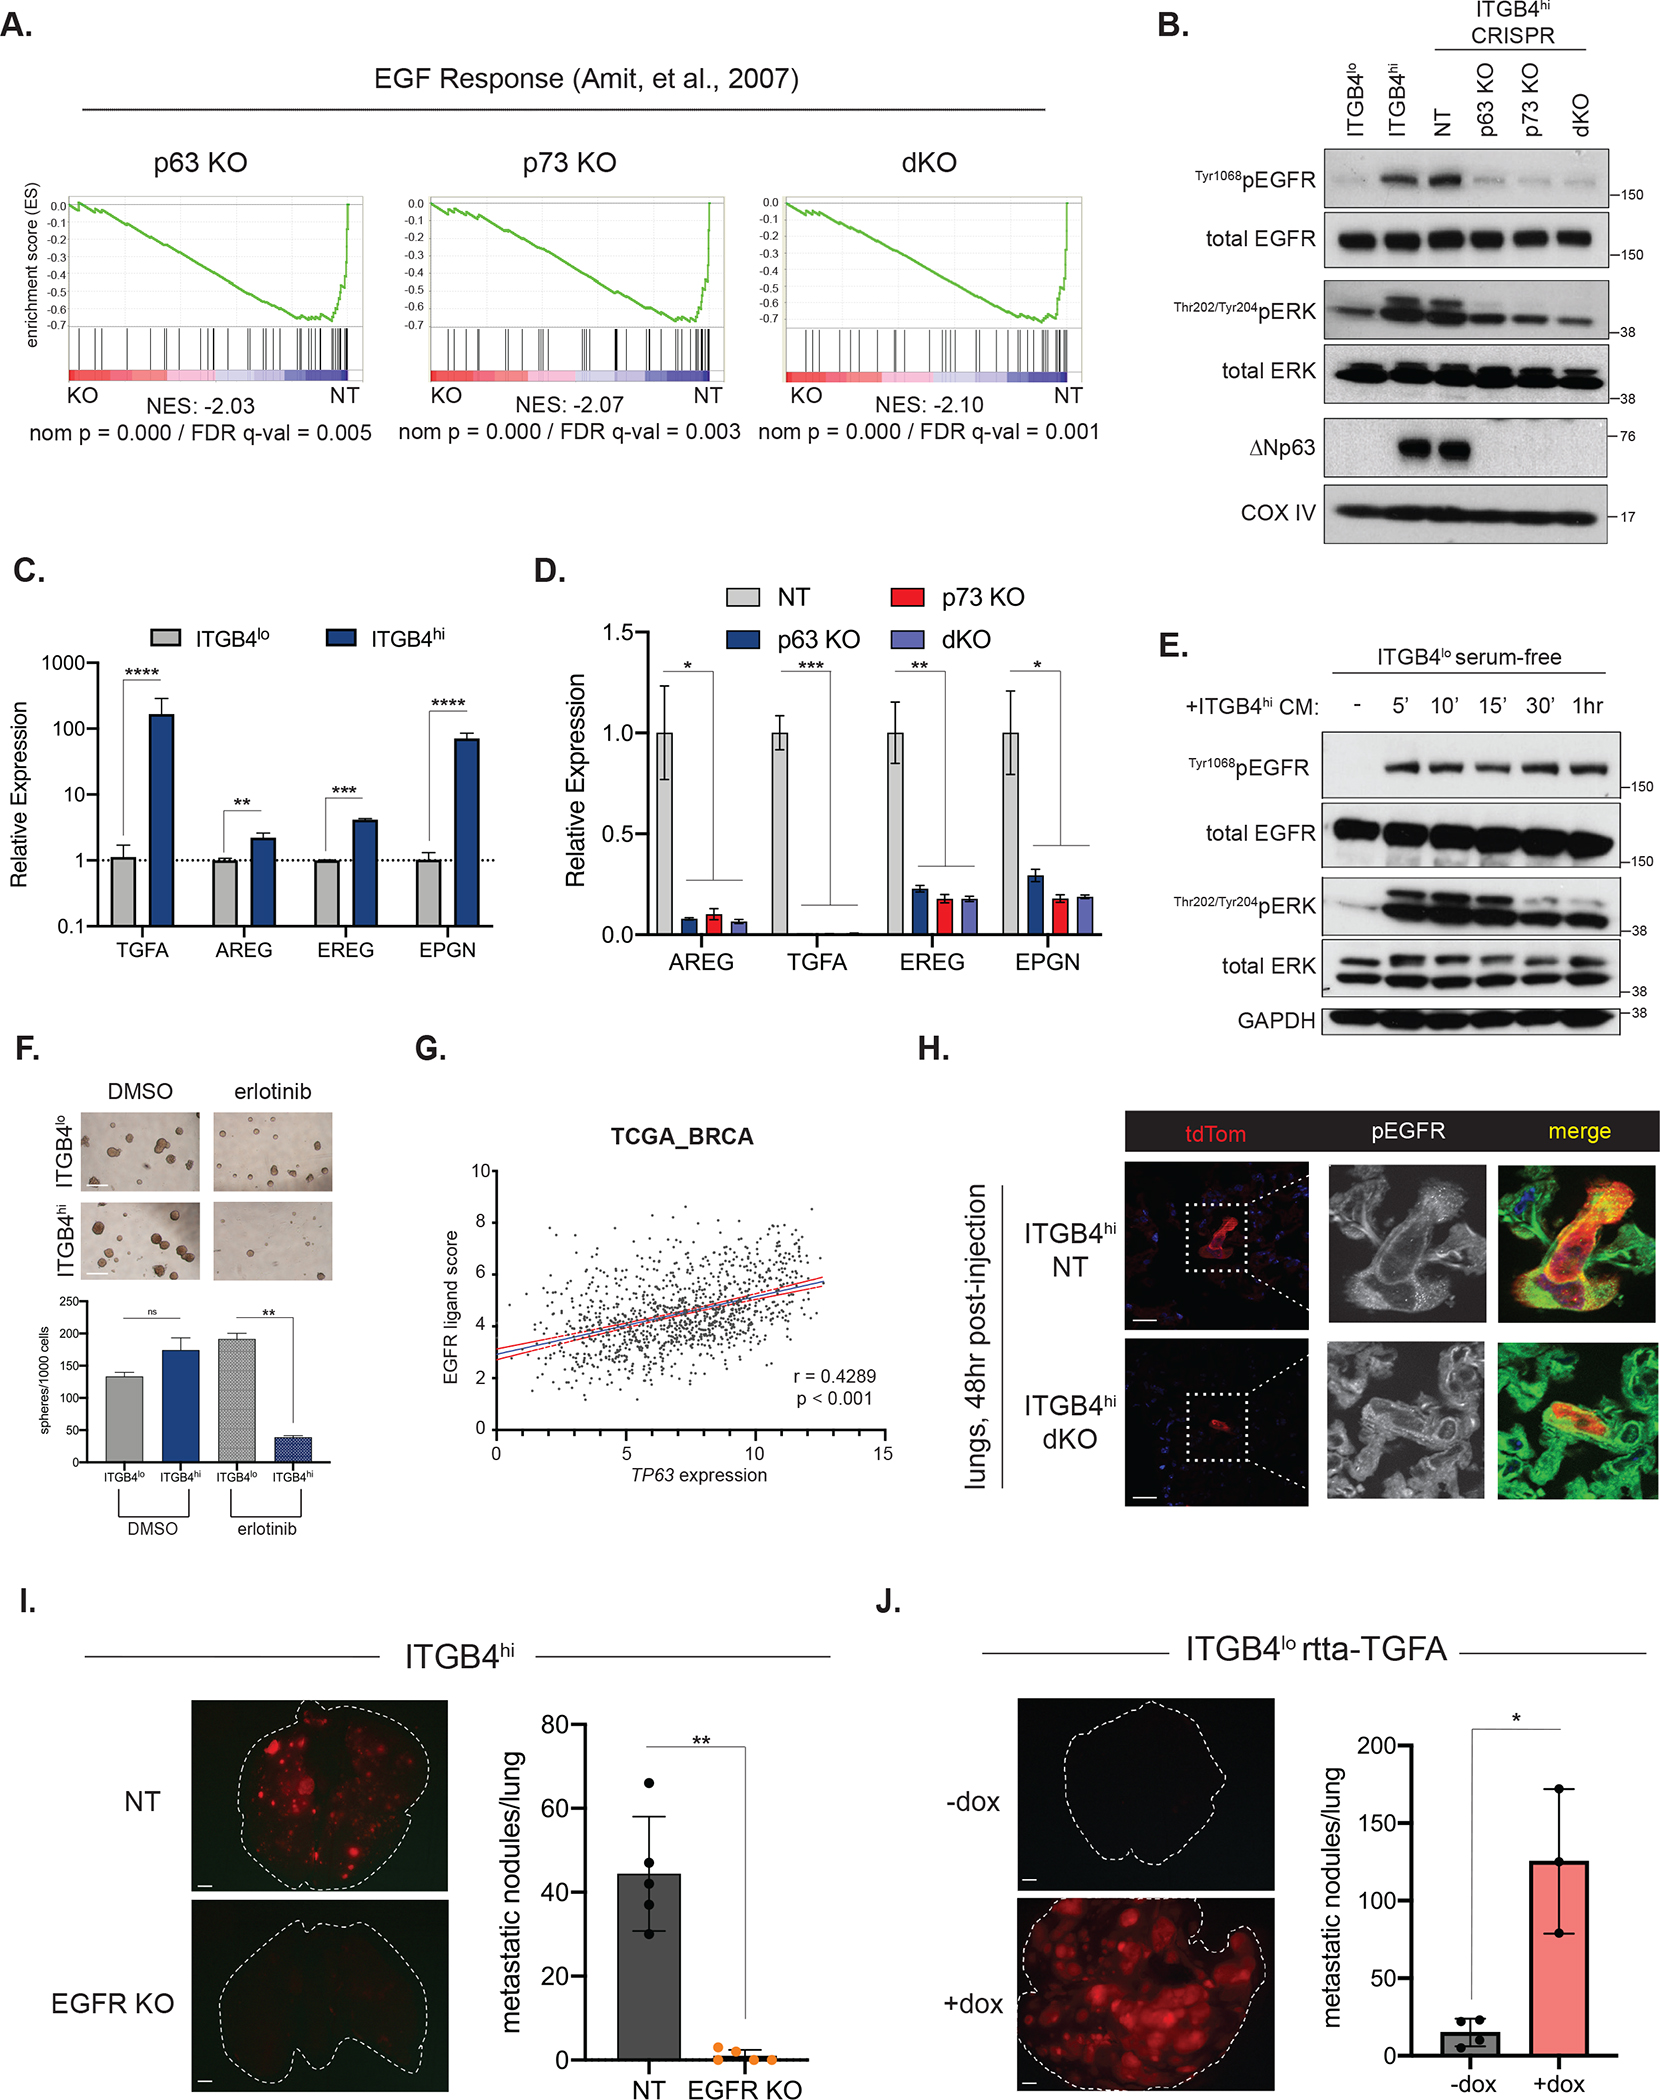
Cancer stem cells (CSCs) may serve as the cellular seeds of tumor recurrence and metastasis, and they can be generated via epithelial-mesenchymal transitions (EMTs). Isolating pure populations of CSCs is difficult because EMT programs generate multiple alternative cell states, and phenotypic plasticity permits frequent interconversions between these states. Here, we used cell-surface expression of integrin β4 (ITGB4) to isolate highly enriched populations of human breast CSCs, and we identified the gene regulatory network operating in ITGB4+ CSCs. Specifically, we identified ΔNp63 and p73, the latter of which transactivates ΔNp63, as centrally important transcriptional regulators of quasi-mesenchymal CSCs that reside in an intermediate EMT state. We found that the transcriptional program controlled by ΔNp63 in CSCs is largely distinct from the one that it orchestrates in normal basal mammary stem cells and, instead, it more closely resembles a regenerative epithelial stem cell response to wounding. Moreover, quasi-mesenchymal CSCs repurpose this program to drive metastatic colonization via autocrine EGFR signaling.

Keywords: EMT; breast cancer; cancer stem cells; epigenetics; metastasis.


Conflict of interest statement

Declaration of interests R.A.W. has a consulting agreement with Verastem Inc., and he has held shares of this company. C.F., Y.C., M.W.C., B.W., M.E., D.F., J.C., E.R.O., and M.G.G. were or are employees of Syros Pharmaceuticals.

Figures

Figure 1.
Figure 1.. p63 and p73 are transcriptional drivers of quasi-mesenchymal metastatic CSCs.
(A) Experimental approach used in this study. (B) Motif enrichment scores across 547 open chromatin regions specific to ITGB4hi cells. (C) Enrichment of TP63 and TP73 motifs in the indicated H3K27ac regions. (D) Clustergram heatmap showing ITGB4hi- and ITGB4lo-specific H3K27ac ChIP-seq peaks (left) and p63/p73 binding at these sites in ITGB4hi cells (right). (E) Venn diagram comparing p73 and p63 binding sites defined by ChIP-seq. (F) Average gene expression of H3K27ac-associated genes bound or unbound by p63 (left) or p73 (right) in ITGB4hi cells. (G) Differential super-enhancers (SEs) in the ITGB4hi vs. ITGB4lo cells. Statistically significant SEs are shown in blue. (H) ALDH activity in ITGB4lo and ITGB4hi cells. Representative flow cytometry plots (above) and quantification (below). Data are ± SEM (n = 3), ** p ≤ 0.01. (I) Metastatic colonization of ITGB4lo and ITGB4hi cells. Representative lung images (top) and quantification (below). Data are ± SEM (n = 3), * p ≤ 0.05. Scale bars, 1 mm. (J) Immunohistochemistry (IHC) staining for p63 and p73 in representative ITGB4hi lung metastases. Scale bars, 100 μm. See also Figure S1.
Figure 2.
Figure 2.. Loss of ΔNp63 and p73 impairs the post-extravasation proliferation of CSCs.
(A) Representative flow cytometry plots in the indicated ITGB4hi CRISPR-KO cells. (B) Western blot analysis of the indicated proteins in control or KO cells that were successively sorted for loss of ITGB4 expression. (C) Quantification of ALDH-positive cells in ITGB4hi control (NT) or KO cells. Data are ± SEM (n = 3), ** p ≤ 0.01, *** p ≤ 0.001. (D) Metastatic colonization of ITGB4hi control or KO cells. Representative lung images (left) and quantification (right). Data are ± SEM (n = 10), *** p ≤ 0.001, **** p ≤ 0.0001. Scale bars, 1 mm. (E) IHC staining for ΔNp63 and p73 in metastatic lung lesions. Scale bars, 100 μm. (F) Quantification of luminescence after injection of ITGB4hi NT or dKO cells (n=8, days 0–2, n=4, days 3–10) and representative IVIS images (right). (G) Representative IF staining for tdTom and CD31 in lung cryosections and quantification of extravasated ITGB4hi NT (n=29 cells from 2 mice) and dKO cells (n=28 cells from 2 mice) 48 hours after tail-vein injection (right). Scale bars, 20 μm. (H) Representative IF staining for tdTom and Ki67 in lung cryosections and quantification of Ki67-positive cells 48 hours or 10 days after injection of ITGB4hi NT or dKO cells. 48hr: ITGB4hi NT (n=41 cells from 2 mice), dKO (n=79 cells from 2 mice). 10 days: ITGB4hi NT (n=166 cells from 2 mice), dKO (n=26 cells from 2 mice). Scale bars, 20 μm. (I) Representative IF staining for tdTom and CD31 in lung cryosections 10 days after tail-vein injection of ITGB4hi dKO cells. Scale bar, 20 μm. (J) GSEA of single-cell RNA-seq data comparing ITGB4hi NT and dKO cells isolated from the lungs of mice 3 days after tail-vein injection. Positive enrichment indicates higher expression in ITGB4hi dKO cells. (K) t-SNE plot of tdTom-positive ITGB4hi NT and dKO cells isolated from the lungs. Corresponding plots show expression of genes of interest. See also Figure S2 and S3.
Figure 3.
Figure 3.. ΔNp63 regulates a distinct transcriptional program in CSCs and normal basal cells.
(A) Clustergram heatmap showing ITGB4hi- and ITGB4lo-specific H3K27ac ChIP-seq peaks (left) in the indicated ITGB4hi CRISPR KO cells (right). (B) Metagene plot showing H3K27ac ChIP-seq reads in parental ITGB4lo and ITGB4hi cells (left) and ITGB4hi cells with the indicated CRSIPR KOs (right). (C) Heatmap of the top differentially expressed genes (log2 fold-change ±1, p ≤ 0.01) in control (NT) ITGB4hi cells compared to the indicated KO lines (left). Venn diagram of genes downregulated across the three KO cell lines (right). (D) GSEA based on RNA-seq data comparing ITGB4hi NT and dKO cells. Positive enrichment indicates higher expression in ITGB4hi dKO cells. (E) Venn diagram showing ΔNp63 target genes in ITGB4hi cells and MCF10A cells . Top gene ontology (GO) terms of the ITGB4hi-specific ΔNp63 targets are shown below. (F) Venn diagram showing ΔNp63 target genes in ITGB4hi cells and two subpopulations of CD10+ myoepithelial/basal . (G) GSEA of RNA-seq data comparing ITGB4hi NT and dKO cells using the indicated epithelial wounding signatures. See also Figure S4.
Figure 4.
Figure 4.. ΔNp63 is sufficient to activate the CSC transcriptional circuit.
(A) Western blot analysis of ΔNp63 and p73 in ITGB4hi cells ectopically expressing the indicated vectors. (B) Clustergram heatmap showing ITGB4hi- and ITGB4lo-specific H3K27ac ChIP-seq peaks in the indicated ITGB4hi dKO overexpression cells. (C) Metagene plot showing H3K27ac ChIP-seq peaks in the indicated ITGB4hi dKO overexpression cells. (D) Flow cytometry analysis of the indicated ITGB4hi dKO overexpression cells. (E) Volcano plots showing genes differentially expressed between ITGB4hi dKO cells expressing the indicated overexpression vectors compared to cells expressing an empty vector (EV). Genes with significant expression changes are highlighted in blue (down) or red (up). (F) Venn diagram showing the genes downregulated in all ITGB4hi KO lines and those upregulated upon re-expression of ΔNp63 in dKO cells. (log2 fold-change ±1, p ≤ 0.01). (G) Western blot analysis of ΔNp63 and p73 in ITGB4lo cells ectopically expressing the indicated vectors. (H) Clustergram heatmap showing ITGB4hi- and ITGB4lo-specific H3K27ac ChIP-seq peaks in control or ΔNp63-expressing ITGB4lo cells. (I) Metagene plot showing H3K27ac ChIP-seq peaks in control or ΔNp63-expressing ITGB4lo cells. (J) Volcano plot showing genes differentially expressed between ITGB4lo ΔNp63 and control EV cells. (K) Flow cytometry analysis of control or ΔNp63-expressing ITGB4lo cells. (L) ALDH activity in ITGB4lo cells expressing a doxycycline-inducible ΔNp63 expression vector. (M) Representative lung images after injection of ITGB4lo cells expressing a doxycycline-inducible ΔNp63 expression vector (left) and quantification of macrometastatic lesions (right). Data are ± SEM (n = 3 in −dox group and n=4 in +dox group). Scale bars, 1 mm.
Figure 5.
Figure 5.. ITGB4hi CSCs are dependent on EGFR signaling for metastatic colonization.
(A) GSEA of RNA-seq data comparing ITGB4hi NT and the indicated KO lines using an EGF response signature. (B) Western blot analysis of EGFR and ERK activation in the indicated parental or KO cell lines. (C) Representative qRT-PCR analysis of the indicated EGFR ligands in the ITGB4lo and ITGB4hi cells. Data are ± SEM, ** p ≤ 0.01, *** p ≤ 0.001, **** p ≤ 0.0001. (D) Relative expression of the indicated EGFR ligands (from RNA-seq data) in control ITGB4hi cells (NT) or KO cell lines. Data are ± SEM (n=3), * p ≤ 0.05, ** p ≤ 0.01, *** p ≤ 0.001, (E) Western blot analysis of EGFR and ERK activation in serum-starved ITGB4lo cells treated with media conditioned from ITGB4hi cells. Negative control (−)cells were maintained in serum-free media. (F) ITGB4lo or ITGB4hi tumorsphere growth after treatment with DMSO or erlotinib (1 μM). Representative images (left) and quantification (right). Data are ± SEM (n = 3), ** p ≤ 0.01. Scale bars, 100 μm. (G) Correlation of TP63 expression with a 4 gene EGFR ligand score (TGFA, EREG, AREG, EPGN) in breast cancer specimens from the TCGA database. (H) Representative IF staining for tdTom and pEGFR in lung cryosections prepared 48 hours after tail-vein injection of the indicated cell lines. Scale bars, 20 μm. (I) Metastatic colonization of ITGB4hi control or EGFR KO cells. Representative lung images (left) and quantification (right). Data are ± SEM (n = 5), ** p ≤ 0.01. Scale bars, 1 mm. (J) Metastatic colonization of ITGB4lo cells expressing a doxycycline-inducible TGFA expression vector. Representative lung images (left) and quantification (right). Data are ± SEM (n = 4 in −dox group and n=3 in +dox group), * p ≤ 0.05. Scale bars, 1 mm. See also Figure S5.

References

    1. Al-Hajj M, Wicha MS, Benito-Hernandez A, Morrison SJ, and Clarke MF (2003). Prospective identification of tumorigenic breast cancer cells. Proc Natl Acad Sci U S A 100, 3983–3988. 10.1073/pnas.0530291100. - DOI - PMC - PubMed
    1. Beck B, and Blanpain C (2013). Unravelling cancer stem cell potential. Nat Rev Cancer 13, 727–738. 10.1038/nrc3597. - DOI - PubMed
    1. Batlle E, and Clevers H (2017). Cancer stem cells revisited. Nat Med 23, 1124–1134. 10.1038/nm.4409. - DOI - PubMed
    1. Lytle NK, Barber AG, and Reya T (2018). Stem cell fate in cancer growth, progression and therapy resistance. Nat Rev Cancer 18, 669–680. 10.1038/s41568-018-0056-x. - DOI - PMC - PubMed
    1. Pattabiraman DR, and Weinberg RA (2014). Tackling the cancer stem cells - what challenges do they pose? Nat Rev Drug Discov 13, 497–512. 10.1038/nrd4253. - DOI - PMC - PubMed

Publication types