. 2023 Jan:246:109209.
doi: 10.1016/j.clim.2022.109209. Epub 2022 Dec 17.

Tracking the clonal dynamics of SARS-CoV-2-specific T cells in children and adults with mild/asymptomatic COVID-19

Affiliations

Tracking the clonal dynamics of SARS-CoV-2-specific T cells in children and adults with mild/asymptomatic COVID-19

Weng Hua Khoo et al. Clin Immunol. 2023 Jan.

Abstract

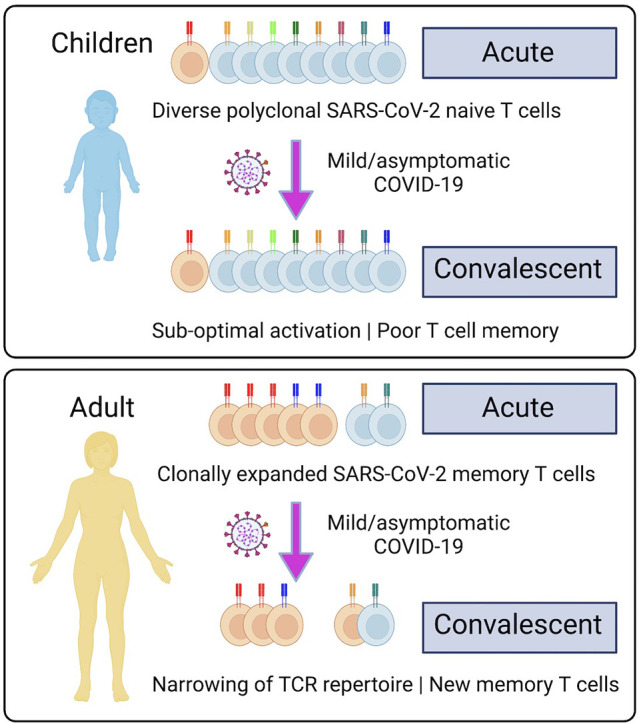
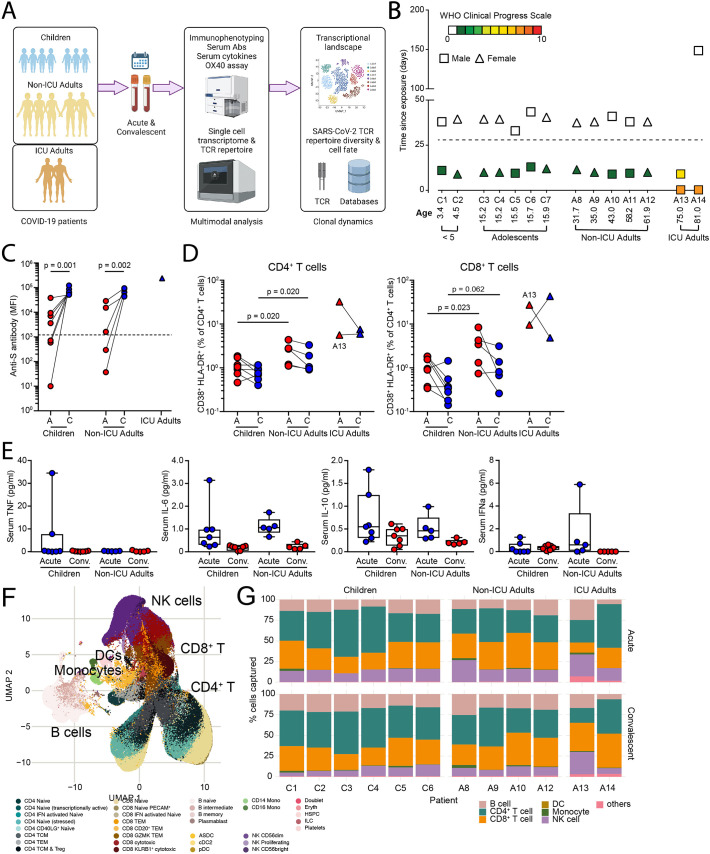
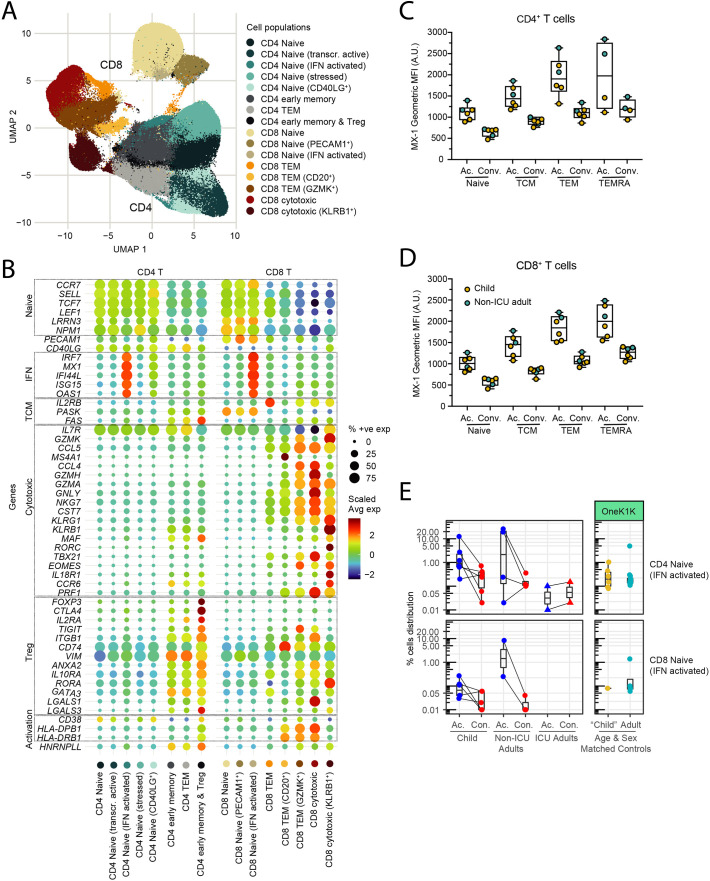
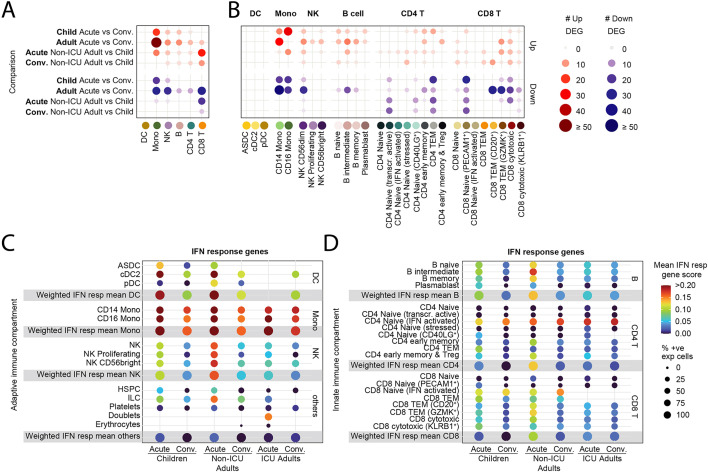
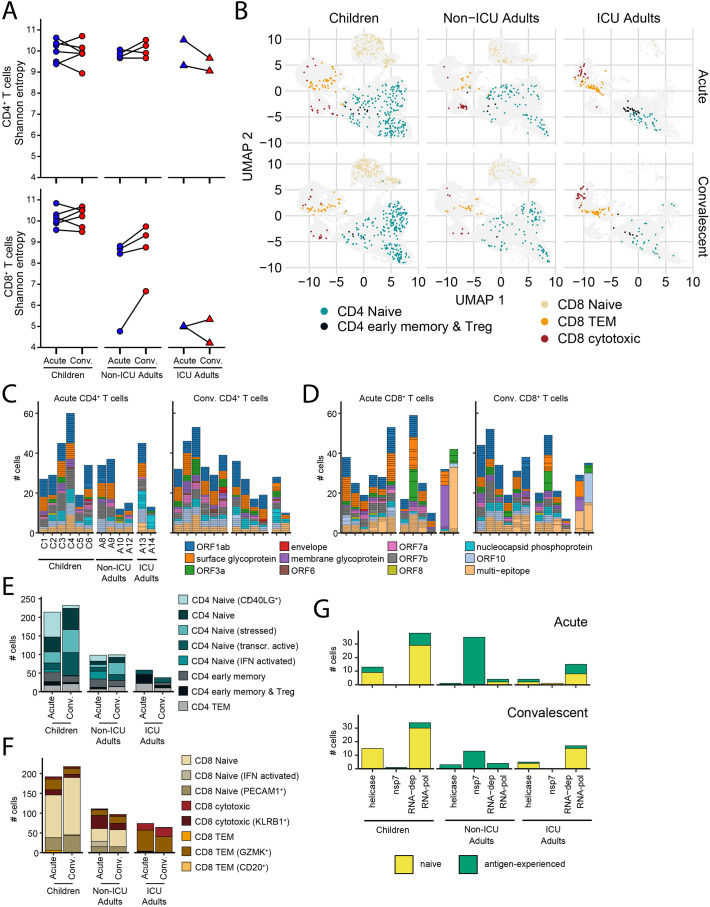
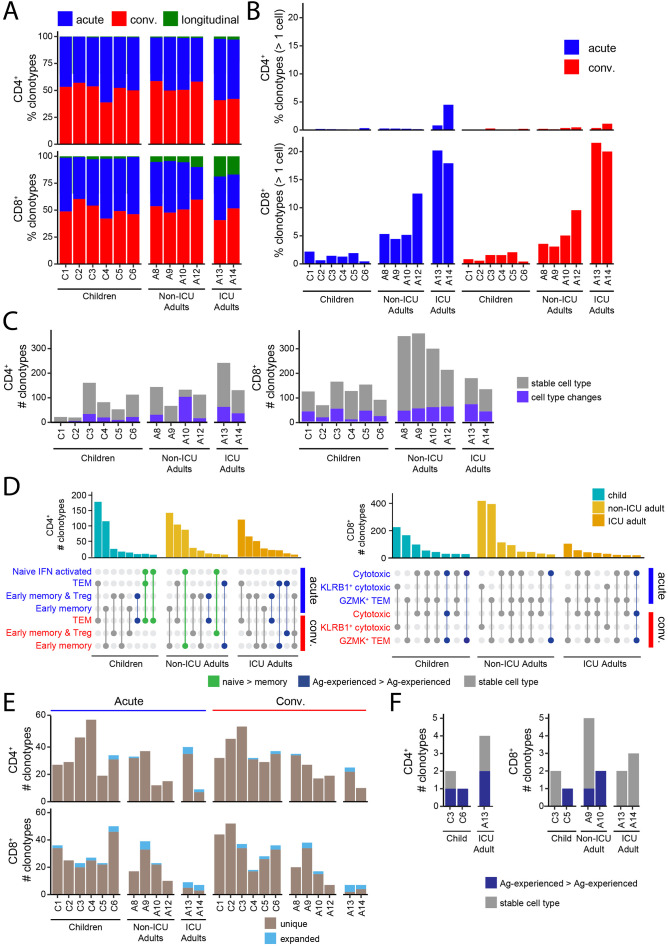
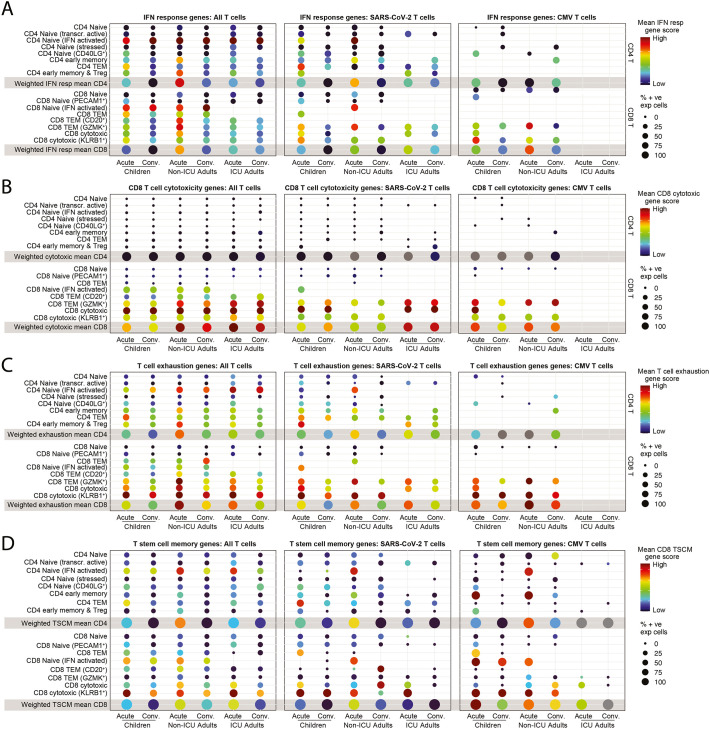
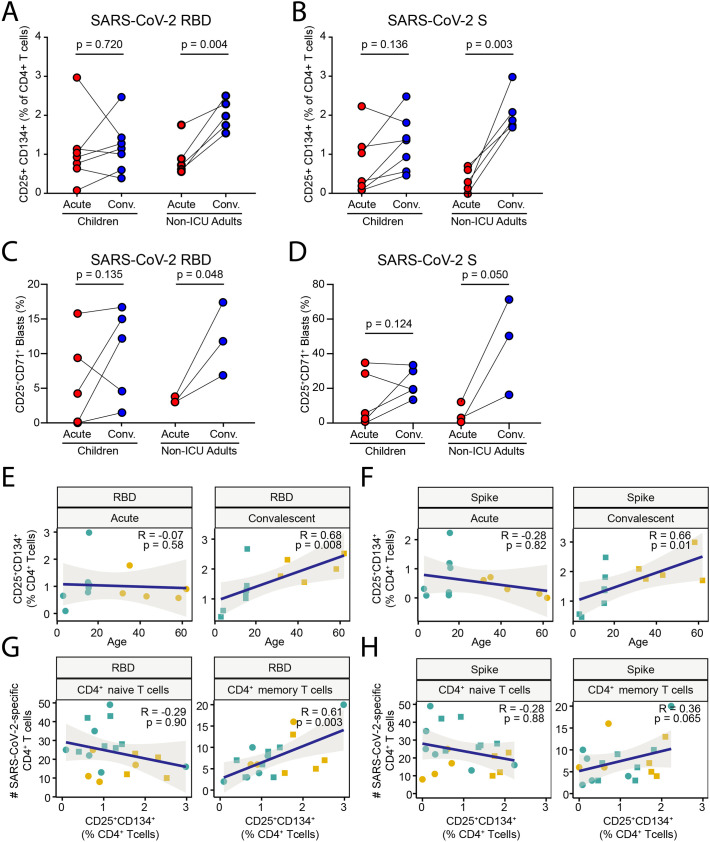
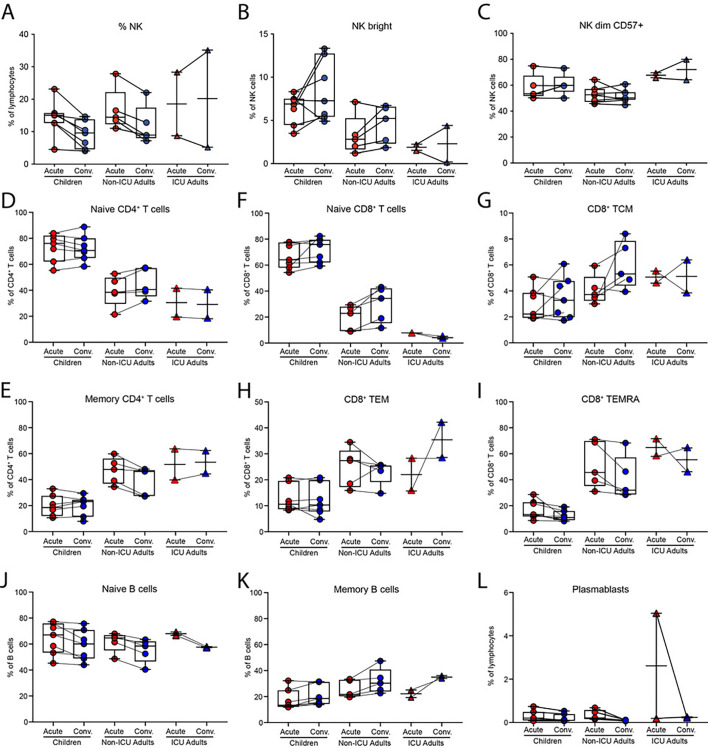
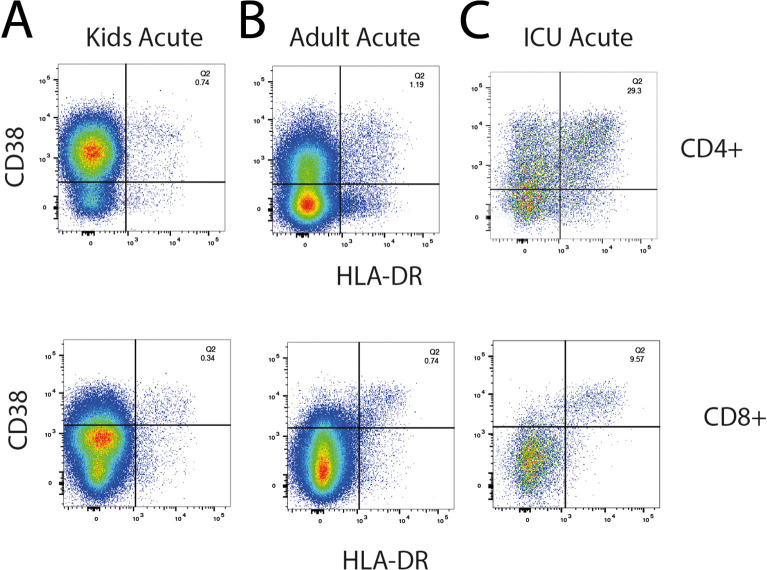
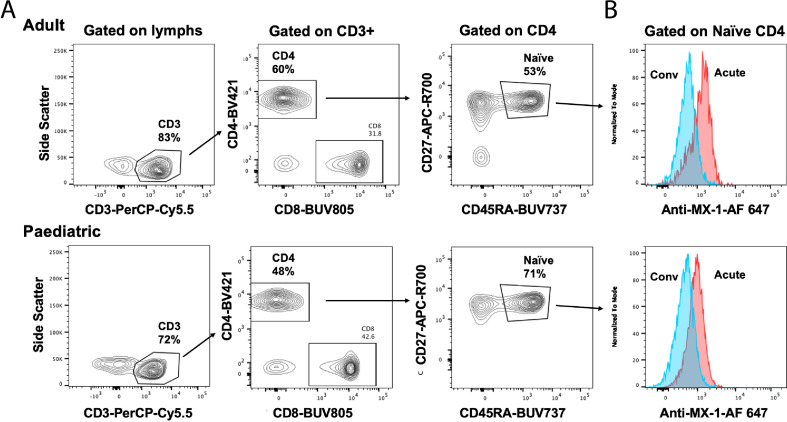
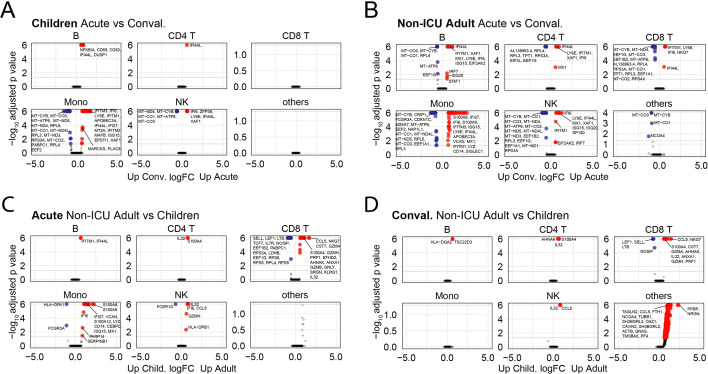
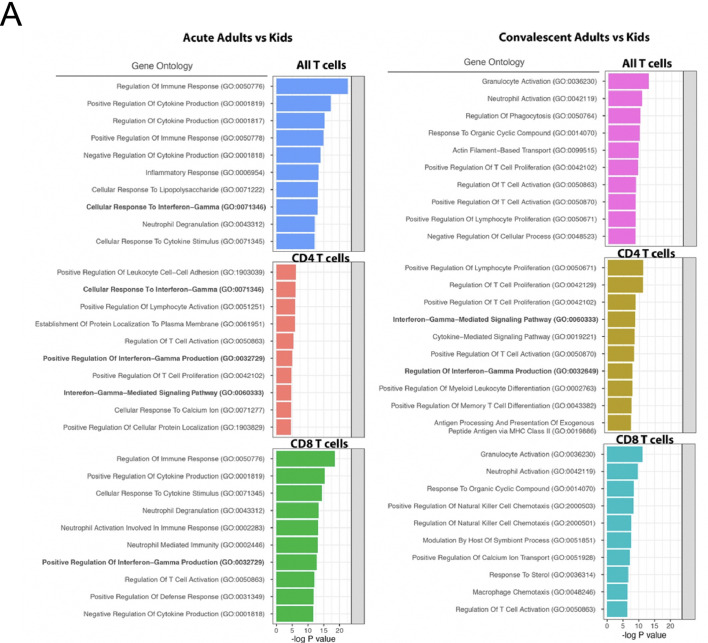
Children infected with severe acute respiratory syndrome coronavirus 2 (SARS-CoV-2) develop less severe coronavirus disease 2019 (COVID-19) than adults. The mechanisms for the age-specific differences and the implications for infection-induced immunity are beginning to be uncovered. We show by longitudinal multimodal analysis that SARS-CoV-2 leaves a small footprint in the circulating T cell compartment in children with mild/asymptomatic COVID-19 compared to adult household contacts with the same disease severity who had more evidence of systemic T cell interferon activation, cytotoxicity and exhaustion. Children harbored diverse polyclonal SARS-CoV-2-specific naïve T cells whereas adults harbored clonally expanded SARS-CoV-2-specific memory T cells. A novel population of naïve interferon-activated T cells is expanded in acute COVID-19 and is recruited into the memory compartment during convalescence in adults but not children. This was associated with the development of robust CD4+ memory T cell responses in adults but not children. These data suggest that rapid clearance of SARS-CoV-2 in children may compromise their cellular immunity and ability to resist reinfection.

Keywords: COVID-19; Clonal dynamics; Interferon-activated naive T cells; Memory T cells; SARS-CoV-2; Single cell transcriptomics; T cell receptor repertoire.


Conflict of interest statement

Declaration of Competing Interest The authors declare no competing financial interests.

Figures

Unlabelled Image
Graphical abstract
Fig. 1
Fig. 1
Multimodal analysis of children and adults with mild COVID-19. (A) Study overview. (B) Patient demographic and clinical severity score. For A13 the second blood sample was collected on day 8 during the acute phase. (C) Serum anti-S protein antibodies. (D) CD38+HLA-DR+ activated CD4+ (left) and CD8+ (right) T cells in children, non-ICU, and ICU adults during Acute and Convalescent phases. (E) Serum TNF, IL-6, IL-10, and interferon-α levels. (F) UMAP showing 433,301 single cells from children, non-ICU, and ICU adults during Acute and Convalescent phases. (G) Stacked barplot showing cellular composition of PBMCs in children, non-ICU, and ICU adults during Acute (top) and Convalescent (bottom) phases from the single cell RNA sequencing.
Fig. 2
Fig. 2
Decomposition of the T cell compartment in children and adults with COVID-19. (A) UMAP showing 171,393 CD4+ T cells and 127,069 CD8+ T cells from children, non-ICU, and ICU adults during Acute and Convalescent phases. (B) Expression of genes associated with the naïve, interferon response (IFN), T central memory (TCM), T cell cytotoxicity, regulatory T cell (Treg) and activation states by different subclusters of CD4+ and CD8+ T cells shown in the UMAP. (C) Detection of interferon-induced MX-1 protein in subpopulations of CD4+ T cells during Acute and Convalescence. Gating are as follows for Naïve T cells = CD45RA+CD45RO; TCM = CD45RACD45RO+CCR7+CD62L+; TEM = CD45RACD45RO+CCR7CD62L; TEMRA = CD45RA+CD45ROCCR7CD62L. (D) Detection of interferon-induced MX-1 protein in subpopulations of CD8+ T cells during Acute and Convalescence. T cell markers are as in (C). (E) Detection of interferon-activated naïve CD4+ T cells (top) and CD8+ T cells (bottom) in children, non-ICU, and ICU adults during Acute and Convalescent phases (left) and in healthy age and sex-matched donors in the OneK1K cohort (right).
Fig. 3
Fig. 3
Transcriptomic differences between children and adults with mild COVID-19. (A) Dotplot showing the number of differentially expressed genes (DEGs) in the innate (DC, monocyte, and NK cell) and adaptive (B, CD4+ T and CD8+ T cell) compartments between children and non-ICU adults during Acute and Convalescent phases. Upregulated genes are shown in red; downregulated genes are shown in blue. (B) Dotplot showing the number of DEGs in the innate and adaptive immune cell subclusters between children and non-ICU adults during Acute and Convalescent phases. Upregulated genes are shown in red; downregulated genes are shown in blue. (C) Dotplot showing expression of interferon response genes by innate immune cells from children, non-ICU, and ICU adults during Acute and Convalescence. (D) Dotplot showing expression of interferon response genes by adaptive immune cells from children, non-ICU, and ICU adults during Acute and Convalescence. (For interpretation of the references to colour in this figure legend, the reader is referred to the web version of this article.)
Fig. 4
Fig. 4
Clonal analysis of SARS-CoV-2-specific T cells. (A) Shannon entropy score for CD4+ (top) and CD8+ (bottom) T cells in children, non-ICU, and ICU adults in Acute and Convalescent phases. Higher scores indicate higher diversity of the TCR repertoire. (B) Transcriptional state of T cells annotated as SARS-CoV-2-specific in children, non-ICU, and ICU adults in Acute (top) and Convalescent (bottom) phases. Children have more naïve CD4+ and CD8+ SARS-CoV-2-specific T cells than non-ICU adults. (C) Epitope specificity of CD4+ T cells for different components of SARS-CoV-2 virus in children, non-ICU, and ICU adults in Acute (left) and Convalescent (right) phases. Each stack in the stacked barplot represents a single clone. Children have more diverse, polyclonal SARS-CoV-2-specific CD4+ T cells than non-ICU adults. (D) Epitope specificity of CD8+ T cells for different components of SARS-CoV-2 virus in children, non-ICU, and ICU adults in Acute (left) and Convalescent (right) phases. Each stack in the stacked barplot represents a single clone. Children have more diverse, polyclonal SARS-CoV-2-specific CD8+ T cells than non-ICU adults. (E) Transcriptional state of SARS-CoV-2-annotated CD4+ T cells in children, non-ICU, and ICU adults in Acute and Convalescent phases. (F) Transcriptional state of SARS-CoV-2-annotated CD8+ T cells in children, non-ICU, and ICU adults in Acute and Convalescent phases. (G) Number of RTC-specific T cells in children, non-ICU, and ICU adults in Acute (top) and Convalescent (bottom) phases. Naïve CD4+ and CD8+ T cells are yellow and antigen-experienced T cells are green. (For interpretation of the references to colour in this figure legend, the reader is referred to the web version of this article.)
Fig. 5
Fig. 5
Clonal dynamics of SARS-CoV-2-specific T cells. (A) Stacked barplot showing the percentage of SARS-CoV-2-specific CD4+ (upper) and CD8+ (lower) clonotypes that are unique at the Acute (red) or Convalescent (blue) phase of infection or present in both (green) for each subject. Longitudinal clonotypes that are present in both acute and convalescent phases were more common in non-ICU adults than children. (B) Graph showing the percentage of CD4+ (upper) and CD8+ (lower) longitudinal clonotypes that are detected at both the Acute and Convalescent phase of infection. Longitudinal clonotypes were more common in CD8+ than CD4+ T cells. (C) Counts for CD4+ (left) and CD8+ (right) clonotypes coloured by whether their cell state remains the same (grey) or changes to a different cell type (purple) between the Acute and Convalescent phases. (D) Top 8 cell type distributions for CD4+ (left) and CD8+ (right) longitudinal clonotypes for children, non-ICU adults, and ICU adults. The barplots indicate the number of clonotypes with the cell type distribution pattern depicted below each bar where a filled circle indicates that the cell type on the y-axis is present. Distributions are coloured to indicate whether they represent transitions from naïve to antigen-experienced (green), transitions between antigen-experienced compartments (blue) or are the same cell type across the two timepoints (grey). (E) Clonotype counts for SARS-CoV-2-annotated clonotypes for all donors for the CD4+ (upper) and CD8+ (lower) compartments coloured by whether the clonotype was unique (light brown) or expanded (light blue) at either the Acute (left) or Convalescent (right) phase. (F) Clonotype counts for longitudinal SARS-CoV-2-annotated CD4+ (left) and CD8+ (right) T cells for the subset of donors that harbor them. Clonotypes are grouped and coloured by whether they have the same cell type at both timepoints (grey) or altered their cell types between Acute and Convalescent phases (dark blue). (For interpretation of the references to colour in this figure legend, the reader is referred to the web version of this article.)
Fig. 6
Fig. 6
T cell interferon activation, cytotoxicity, and exhaustion states. (A) Interferon response gene scores for all T cells (left), SARS-CoV-2-specific T cells (middle) and CMV-specific T cells (right) in children, non-ICU, and ICU adults in Acute and Convalescent phases. (B) CD8+ T cell cytotoxicity gene scores for all T cells (left), SARS-CoV-2-specific T cells (middle) and CMV-specific T cells (right) in children, non-ICU, and ICU adults in Acute and Convalescent phases. (C) T cell exhaustion gene scores for all T cells (left), SARS-CoV-2-specific T cells (middle) and CMV-specific T cells (right) in children, non-ICU, and ICU adults in Acute and Convalescent phases. (D) T stem cell memory (TSCM) gene scores for all T cells (left), SARS-CoV-2-specific T cells (middle) and CMV-specific T cells (right) in children, non-ICU, and ICU adults in Acute and Convalescent phases.
Fig. 7
Fig. 7
Memory T cell responses to SARS-CoV-2 in children and adults. (A) Frequency of CD25+CD134+CD4+ T cells in cultures of PBMCs stimulated with recombinant SARS-CoV-2 RBD protein from children and non-ICU adults in Acute and Convalescent phases. (B) Frequency of CD25+CD134+CD4+ T cells in cultures of PBMCs stimulated with recombinant SARS-CoV-2 Spike (S) protein from children and non-ICU adults in Acute and Convalescent phases. (C) CD4+ T cell proliferative response in 14-day cultures of PBMCs stimulated with recombinant SARS-CoV-2 RBD protein from children and non-ICU adults in Acute and Convalescent phases. (D) CD4+ T cell proliferative response in cultures of PBMCs stimulated with recombinant SARS-CoV-2 S protein from children and non-ICU adults in Acute and Convalescent phases. (E) Linear regression of CD25+CD134+ response to RBD protein by CD4+ T cells with age in Acute (left) and Convalescent (right) phases. The magnitude of the memory response to RBD scales linearly with age in convalescent samples. (F) Linear regression of CD25+CD134+ response to S protein by CD4+ T cells with age in Acute (left) and Convalescent (right) phases. The magnitude of the memory response to RBD scales linearly with age in convalescent samples. (G) Linear regression of proliferative response to RBD protein by CD4+ T cells with number of SARS-CoV-2-specific naïve (left) and memory (right) T cells. The magnitude of the proliferative memory response to RBD scales linearly with age in convalescent samples. (H) Linear regression of proliferative response to S protein by CD4+ T cells with number of SARS-CoV-2-specific naïve (left) and memory (right) T cells.
Supplementary Fig. S1
Representative FACS plots showing the gating for CD38+HLA-DR+ CD4+ T cells (top) and CD8+ T cells (bottom) (A) Child in Acute Phase (B) Non-ICU adult in Acute Phase (C) ICU adult in Acute Phase.
Supplementary Fig. S2
Flow cytometric analysis of PBMCs in children and adults with COVID-19. Gates for each population are as follows: (A) NK cells. CD3-CD56+ (B) NK bright cells. CD3-CD56bright NK (C) NK dim cells. CD3-CD56dim NK (D) Naïve CD4+ T cells. abTCR+gdTCR-CD4+ CD45RA + CCR7+ (E) Memory CD4+ T cells. abTCR+gdTCR-CD4+ CXCR5-CD45RA- (F) Naïve CD8+ T cells. – abTCR+gdTCR-CD8+ CD45RA + CCRA7+ (G) CD8+ central memory T cells (TCM). abTCR+gdTCR-CD8 + CD45RA- CCR7+ (H) CD8+ effector memory T cells (TEM). abTCR+gdTCR-CD8 + CD45RA-CCR7- (I) CD8+ terminally differentiated effector memory T cells (TEMRA). abTCR+gdTCR-CD8 + CD45RA + CCR7- (J) Naïve B cells. CD3-CD20 + CD21 + CD27-CD10- (K) Memory B cells. CD3-CD20 + CD21 + CD27+ (L) Plasmablasts. CD56-CD3-CD4-CD8-CD19 + CD38hiCD27+.
Supplementary Fig. S3
Representative FACS plot showing expression of MX-1 in naïve CD4+ T cells. (A) FACS gating strategy for adult (top) and child (bottom). (B) Histogram showing overlay of MX-1 staining in Acute (red) and Convalescent phases (cyan) for adult (top) and child (bottom).
Supplementary Fig. S4
Volcano plots showing top 50 differentially expressed genes. Significantly upregulated genes are shown in red and downregulated genes in blue. (A) Between acute and convalescent samples in children. (B) Between acute and convalescent samples in non-ICU adults. (C) Between non-ICU adults and children in the acute phase. (D) Between non-ICU adults and children in the convalescent phase.
Supplementary Fig. S5
Pseudobulk differential gene expression analysis showing differences in Gene Ontology (GO) terms between Acute Adults vs Kids (left) and Convalescent Adult vs Kids (right).
Supplementary Fig. S6
FACS gating strategy for OX40 assay and T cell proliferation assay. (A) Representative FACS plot showing gating strategy for detection of CD25+CD134+CD4+ T cells upon stimulation with nil (top panels) and Spike trimer (bottom panels).(B) Representative FACS plot showing gating strategy for proliferation of CD4+ T cells upon stimulation with nil (top panels), and Spike trimer (bottom panels).

References

    1. Zhou P., Yang X.L., Wang X.G., Hu B., Zhang L., Zhang W., Si H.R., Zhu Y., Li B., Huang C.L., Chen H.D., Chen J., Luo Y., Guo H., Jiang R.D., Liu M.Q., Chen Y., Shen X.R., Wang X., Zheng X.S., Zhao K., Chen Q.J., Deng F., Liu L.L., Yan B., Zhan F.X., Wang Y.Y., Xiao G.F., Shi Z.L. A pneumonia outbreak associated with a new coronavirus of probable bat origin. Nature. 2020;579:270–273. - PMC - PubMed
    1. Guan W.J., Ni Z.Y., Hu Y., Liang W.H., Ou C.Q., He J.X., Liu L., Shan H., Lei C.L., Hui D.S.C., Du B., Li L.J., Zeng G., Yuen K.Y., Chen R.C., Tang C.L., Wang T., Chen P.Y., Xiang J., Li S.Y., Wang J.L., Liang Z.J., Peng Y.X., Wei L., Liu Y., Hu Y.H., Peng P., Wang J.M., Liu J.Y., Chen Z., Li G., Zheng Z.J., Qiu S.Q., Luo J., Ye C.J., Zhu S.Y., Zhong N.S., China Medical Treatment Expert Group for, C Clinical Characteristics of Coronavirus Disease 2019 in China. N. Engl. J. Med. 2020;382:1708–1720. - PMC - PubMed
    1. Chen T., Wu D., Chen H., Yan W., Yang D., Chen G., Ma K., Xu D., Yu H., Wang H., Wang T., Guo W., Chen J., Ding C., Zhang X., Huang J., Han M., Li S., Luo X., Zhao J., Ning Q. Clinical characteristics of 113 deceased patients with coronavirus disease 2019: retrospective study. BMJ. 2020;368 - PMC - PubMed
    1. Huang C., Wang Y., Li X., Ren L., Zhao J., Hu Y., Zhang L., Fan G., Xu J., Gu X., Cheng Z., Yu T., Xia J., Wei Y., Wu W., Xie X., Yin W., Li H., Liu M., Xiao Y., Gao H., Guo L., Xie J., Wang G., Jiang R., Gao Z., Jin Q., Wang J., Cao B. Clinical features of patients infected with 2019 novel coronavirus in Wuhan, China. Lancet. 2020;395:497–506. - PMC - PubMed
    1. Wang D., Hu B., Hu C., Zhu F., Liu X., Zhang J., Wang B., Xiang H., Cheng Z., Xiong Y., Zhao Y., Li Y., Wang X., Peng Z. Clinical characteristics of 138 hospitalized patients with 2019 novel coronavirus-infected pneumonia in Wuhan, China. JAMA. 2020;323:1061–1069. - PMC - PubMed

Publication types

Substances