. 2022 Dec 20;13(1):7830.
doi: 10.1038/s41467-022-35036-4.

Dynamic partitioning of branched-chain amino acids-derived nitrogen supports renal cancer progression

Affiliations

Dynamic partitioning of branched-chain amino acids-derived nitrogen supports renal cancer progression

Marco Sciacovelli et al. Nat Commun. .

Abstract

Metabolic reprogramming is critical for tumor initiation and progression. However, the exact impact of specific metabolic changes on cancer progression is poorly understood. Here, we integrate multimodal analyses of primary and metastatic clonally-related clear cell renal cancer cells (ccRCC) grown in physiological media to identify key stage-specific metabolic vulnerabilities. We show that a VHL loss-dependent reprogramming of branched-chain amino acid catabolism sustains the de novo biosynthesis of aspartate and arginine enabling tumor cells with the flexibility of partitioning the nitrogen of the amino acids depending on their needs. Importantly, we identify the epigenetic reactivation of argininosuccinate synthase (ASS1), a urea cycle enzyme suppressed in primary ccRCC, as a crucial event for metastatic renal cancer cells to acquire the capability to generate arginine, invade in vitro and metastasize in vivo. Overall, our study uncovers a mechanism of metabolic flexibility occurring during ccRCC progression, paving the way for the development of novel stage-specific therapies.


Conflict of interest statement

G.D.S. has received educational grants from Pfizer, AstraZeneca, and Intuitive Surgical; consultancy fees from Pfizer, Merck, EUSA Pharma, and CMR Surgical; Travel expenses from Pfizer and Speaker fees from Pfizer. J.S.R. reports funding from GSK and Sanofi, and consultant fees from Travere Therapeutics and Astex Pharmaceutical. The remaining authors declare no competing interests.

Figures

Fig. 1
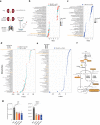
Fig. 1. Branched-chain amino acid catabolism is suppressed in KIRC.
a Dot plot showing the enriched pathways ranked by significance in KIRC tumors compared to renal healthy tissue obtained through GSEA analysis of RNA-seq data from TCGA. The dot size represents the significance expressed as –log10(p-value). red dots = upregulated pathways, blue dots = downregulated pathways. NES normalized enrichment score. Statistics was calculated using moderated two-sided Student test, p-values were corrected with Benjamini–Hochberg procedure. b Volcano plot showing the differential expression of genes that belong to KEGG “Valine leucine and isoleucine degradation” signature in KIRC tumors compared to renal healthy tissue. FC fold-change, red = upregulated genes, blue = downregulated genes. c Dot plot of the differentially enriched pathways in KIRC tumors comparing stage III/IV vs. stage I/II. Pathways, ranked by significance, are obtained through GSEA analysis of TCGA RNA-seq data. The dot size represents the significance expressed as –log10(p-value). red dots = upregulated pathways, blue dots = downregulated pathways. NES normalized enrichment score. Statistics was calculated using moderated two-sided Student test, p-values were corrected with Benjamini–Hochberg procedure. d Overall survival of KIRC patients obtained through GEPIA, based on gene expression of KEGG ‘Valine, leucine and isoleucine degradation’ signature. Cut-off used for high/low groups was 50% and p-value displayed as –logrank(p-value) calculated using Mantel–Cox test. The dotted line refers to the survival with a confidence interval (CI) of 95%. n number of samples compared, HR = hazard ratio based on the Cox PH model. KIRC = Renal clear cell carcinoma.
Fig. 2
Fig. 2. Regulation of BCAA catabolism in a cellular model system for renal cancer progression.
a Schematics of the cell lines used in the study. HK2 cells were derived from normal renal tissue, 786-O, OS-RC-2, RFX-631 from primary ccRCC and the metastatic 786-M1A, 786-M2A, and OS-LM1 from lung metastases after injection in vivo. b, c Dot plot of the enriched pathways ranked by significance obtained through GSEA from proteomic data. Green dots represent 786-O vs. HK2, orange 786-M1A vs. HK2, blue 786-M1A vs. 786-O. Statistics was calculated using moderated two-sided Student test, p-values were corrected with Benjamini–Hochberg procedure. Dot size is proportional to –log10(adj-p-value). NES normalized enrichment score. d, e Dot plot showing the differential abundance of the indicated intracellular metabolites in the comparisons 786-O vs. HK2 (green),786-M1A vs. HK2 (orange), and 786-M1A vs. 786-O (blue) ranked by t-values. Data were normalized to total ion count and generated from N = 3 experiments. The dimension of the dots represents abs t-values. f Simplified schematic of the BCAA catabolism. Leucine and isoleucine are imported by the solute carrier system SLC7A5/SLC3A2, converted into branched-chain keto acids (BCKAs) by BCAT1/2 and subsequently oxidized by BCKDH complex into acyl-CoAs. BCKDH complex is inhibited by BCKDK-dependent phosphorylation on Ser293 residue. C5 and C3-carnitines are measured as readout of isovaleryl-CoA and propionyl-CoA, respectively. Acyl-CoAs are further catabolized by IVD, ACADS, ACADSB, ACADM, MMUT before entering the TCA cycle. Methylmalonylcarnitine and succinylcarnitine are readouts of methylmalonyl-CoA and succinyl-CoA. Metabolites highlighted by orange circles are measured by LC–MS. Red circles = metabolites from leucine catabolism, black circles =  metabolites derived from isoleucine, blue circles = metabolites derived from valine. g Labeled-free quantification (LFQ) of the indicated proteins from the proteomics dataset. Data are shown as mean of 5 independent cultures ± SD. Significance was calculated using one-way ANOVA where each group was compared with HK2. SLC7A5 = solute carrier family 7 member 5; SLC3A2 solute carrier family 3 member 2, BCAT1/2 branched-chain amino acid transaminase 1/2, BCKDH branched-chain keto acid dehydrogenase complex, BCKAs branched-chain keto acids, BCDK branched-chain keto acid dehydrogenase kinase, IVD isovaleryl-CoA dehydrogenase, ACADS Acyl-CoA dehydrogenase short chain, ACADSB Acyl-CoA dehydrogenase short/branched-chain, ACADM Acyl-CoA dehydrogenase medium chain, MMUT methylmalonyl-CoA mutase.
Fig. 3
Fig. 3. ocEAn, a tool to visualize metabolic changes in cancer cells.
a Representative scatter plot generated using ocEAn for BCAT1 in the indicated comparisons. Metabolites upstream and downstream of BCAT1 directly or indirectly linked to reaction are indicated in two separate plots, one (on top) for conversion of leucine in ketoisocaproic acid (KIC), the other (on the bottom) for the transamination of α-ketoglutarate (aKG) to glutamate. The dot size represents the multiplication of the t-value with the weighted distance index (distance index being the number of the x-axis). y-axis reports the t-value of the abundances for the metabolites indicated in BCAT1 footprint including if they are accumulated or depleted upstream or downstream. The most relevant metabolites are highlighted in green. For the scatter plot generation, the methymalonylcarnitine+succinylcarnitine metabolite was annotated as methylmalonylcarnitine only. b Proportion of total pool of the indicated labeled metabolites originating from 13C leucine + isoleucine in all renal cells at the indicated time points. Data represent the mean of 5 independent cultures ± SD. p-values were calculated using one-way ANOVA with multiple comparisons and indicated in the graph for the comparisons HK2 vs. other biological groups at the given time point.
Fig. 4
Fig. 4. BCAT transamination supplies nitrogen for aspartate and nucleotide biosynthesis in ccRCC.
a Diagram of the labeling pattern originating from 15N leucine catabolism. The gray circles indicate unlabeled N, blue circle 15N while white circles represent unlabeled carbons. Measured metabolites through LC–MS are indicated in blue circles. BCAT1/2 branched-chain amino acid transaminase 1/2, GOT1/2 glutamic-oxaloacetic transaminase 1/2, ASNS asparagine synthase, ASS1 argininosuccinate synthase, ASL argininosuccinate lyase. Abundance of labeled leucine m+1 and glutamate m+1 (b), aspartate m+1 and asparagine m+1 (c) originating from 15N leucine after 27 h normalized to total ion count. Data represent the mean of 6 independent cultures ± SD. p-values were calculated using one-way ANOVA where each group was compared with HK2. d Proportion of total pool of the indicated labeled metabolites originating from 15N leucine after 24 h in culture with EBSS + FBS 2.5% for 24 h. Data are normalized to total ion count and represent the mean of 6 independent cultures ± SD. eg Intracellular abundance of the indicated metabolites after treatment with BCATI 100 μM in Plasmax for 22 h. Values are normalized to total ion count and expressed as the mean of 3 independent cultures ± SD. p-values were calculated using one-way ANOVA with multiple comparisons and indicated in the graph for the comparisons treated vs. vehicle for all biological groups. h Proliferation rate of the indicated cell lines in the presence of 100 μM of BCATI in Plasmax. Data represent the mean of 3 independent experiments ± S.E.M. Values represent fold-change increase of growth relative to day 0.
Fig. 5
Fig. 5. VHL reconstitution restores BCAA functioning in ccRCC cells.
a Heatmap showing the enriched pathways in the indicated comparisons obtained through GSEA analysis of proteomics data generated from cells grown in RPMI. b Volcano plot showing the differential expression of proteins that belong to KEGG “Valine leucine and isoleucine degradation” signature in 786-O + VHL vs. 786-O + EV and 786-M1A + VHL vs. 786-M1A + EV from proteomics data obtained culturing cells in RPMI. FC fold-change, red = upregulated proteins, blue = downregulated proteins. c Ratio of the intracellular abundance of C3-carnitines and C5-carnitines in cells expressing VHL compared to EV cultured in RPMI. Data were normalized to total ion count and represent the mean of 3 independent experiments (N = 3) ± S.E.M. p-values were calculated using two-tailed one-sample t-test against the theoretical mean of 1 (786-O + EV = 1 vs. 786-O + VHL and 786-M1A + EV = 1 vs. 786-M1A + VHL). d Proportion of total pool of the intracellular ketoisocaproic acid (KIC) and C5-carnitine derived from 13C leucine in renal cells cultured in RPMI. Data represents the mean of 5 independent cultures +SD. e mRNA levels of SLC7A5 in the indicated cell lines grown in RPMI measured through qPCR. TBP was used as endogenous control. Values represent relative quantification (RQ) ± error calculated using Expression suite software (Applied Biosystem) calculated using SD algorithm. p-value was calculated through Expression suite software. N = 3 independent experiments.
Fig. 6
Fig. 6. ASS1 re-expression in metastatic ccRCC confers resistance to arginine depletion.
a Proportion of the total pool of the indicated labeled metabolites originating from 15N leucine (top) and abundance of labeled leucine m+1, glutamate m+1, aspartate m+1 (bottom) after 27 h normalized to total ion count. Data represent the mean of 6 independent cultures ± SD. p-values were calculated using one-way ANOVA where each group was compared with HK2. b Volcano of the differentially regulated metabolic genes comparing 786-M1A vs. 786-O using RNA-seq data generated from cells grown in Plasmax. red indicates upregulated genes, blue downregulated genes. FC fold-change. c Argininosuccinate abundance in the indicated cell lines cultured in Plasmax measured using LC–MS. Data were normalized to total ion count and represent the mean of 3 independent experiments (N = 3) ± S.E.M. p-values were calculated using one-way ANOVA with multiple comparisons. d Heatmap of the methylation level (B-value) of the indicated CGs within a CpG island overlapping with ASS1 TSS. Values are presented as the mean of two independent experiments (N = 2). The average of all CGs methylation b-value is reported on top the heatmap for each cell type. e mRNA levels of ASS1 in 786-O treated for 72 h with either vehicle or 200 nM 5AC measured through qPCR. TBP was used as endogenous control. Values represent relative quantification (RQ) ± error calculated using Expression suite software (Applied biosystem) calculated using SD algorithm. p-value was calculated through Expression suite software. N = 3 independent experiments. f Measurement of cell proliferation through Sulforhodamine B (SRB) staining after treatment with pegylated arginine deiminase (ADIPEG20, 57.5 ng/ml) at the indicated concentrations for 48 h. Values of SRB absorbance are shown as fold-change ± S.E.M. relative to vehicle-treated staining. p-values were calculated using one-way ANOVA with multiple comparisons. N = 4 independent experiments. g mRNA levels of ASS1 and CXCR4 in 786-O treated with ADIPEG20 57.5 ng/ml for 4 weeks, measured through qPCR. TBP was used as endogenous control. Values represent relative quantification (RQ) ± error calculated using Expression suite software (Applied biosystem) calculated using SD algorithm. p-value was calculated through Expression suite software from N = 3 independent experiments.
Fig. 7
Fig. 7. ASS1 supports metastatic invasion in vitro and in vivo.
a Western blot of the ASS1 levels in cells stably cultured in Plasmax upon ASS1 silencing using two different shRNA constructs. Calnexin was used as an endogenous control. b Measurement of 786-M1A cell proliferation after silencing of ASS1 using Incucyte. Confluency values are shown as phase image sharpness calculated through Incucyte software ± S.E.M. N = 3 independent experiments. c Representative images of the indicated cell lines at time 0 and after 48 h (left) upon growth as spheroids in collagen (area marked in red). Pictures were obtained from Incucyte. Scale bar is 500 μm. Quantification of the cell spreading area in the collagen matrix at 48 h is represented as mean ± S.E.M from N = 3 independent experiments. Statistical significance was calculated using two-tailed one-sample t-test (null hypothesis ratio = 1). d Normalized lung photon flux from the lungs of 5 mice post tail-vein inoculation of 300,000 cells for the indicated cell types. Data are shown as mean of 5 mice ± S.E.M. e Box plot of the normalized lung photon flux of 5 mice/group at day 38 post-inoculation from the experiment shown in d and representative bioluminescence images of the mice at day 38 (f). 25% percentile/median/75% percentile are: 2.174;4.403;13.59 for 786-M1A + NTC, 0.5860;0.7700;0.8300 for 786-M1A + shASS1#1, 0.1940;0.2200;0.2895 for 786-M1A + shASS1#2. Statistical significance was calculated using one-way ANOVA with multiple comparisons. g Representative images of human vimentin/hematoxylin immuno-histochemistry of mouse lung sections after inoculation of cells in the tail vein for the indicated cell types. Scale bar is 200 μm.
Fig. 8
Fig. 8. Reprogramming of the BCAA amino acid catabolism is intertwined with the urea cycle enzymes during ccRCC progression.
Schematic showing a summary of the metabolic reprogramming in renal cancer cells during progression. Upon VHL loss, renal cancer cells activate a metabolic reprogramming to compensate for the aspartate defect that is a consequence of the HIF-dependent mitochondrial dysfunction present in these cells that involves combined activation of BCAT1 and GOT1. ASS1 is suppressed, sparing aspartate from consumption through the urea cycle and favoring its re-direction towards nucleotide biosynthesis. In the metastatic population, ASS1 is epigenetically reactivated, and its expression is triggered by low levels of arginine in the microenvironment. ASS1 reactivation in the metastatic cells connects the BCAA catabolism reprogramming to the urea cycle, providing metastatic cells with the capability to derive arginine from BCAA and to survive in the presence of limiting levels of arginine.

Comment in

  • Metabolic flexibility in ccRCC.
    Stone L. Stone L. Nat Rev Urol. 2023 Mar;20(3):130. doi: 10.1038/s41585-023-00734-1. Nat Rev Urol. 2023. PMID: 36765183 No abstract available.

References

    1. Fendt SM, Frezza C, Erez A. Targeting metabolic plasticity and flexibility dynamics for cancer therapy. Cancer Discov. 2020;10:1797–1807. doi: 10.1158/2159-8290.CD-20-0844. - DOI - PMC - PubMed
    1. Kreuzaler P, Panina Y, Segal J, Yuneva M. Adapt and conquer: metabolic flexibility in cancer growth, invasion and evasion. Mol. Metab. 2020;33:83–101. doi: 10.1016/j.molmet.2019.08.021. - DOI - PMC - PubMed
    1. Elia I, Doglioni G, Fendt SM. Metabolic hallmarks of metastasis formation. Trends Cell Biol. 2018;28:673–684. doi: 10.1016/j.tcb.2018.04.002. - DOI - PubMed
    1. Pavlova NN, Thompson CB. The emerging hallmarks of cancer metabolism. Cell Metab. 2016;23:27–47. doi: 10.1016/j.cmet.2015.12.006. - DOI - PMC - PubMed
    1. Pascual, G., Dominguez, D. & Benitah, S. A. The contributions of cancer cell metabolism to metastasis. Dis. Model. Mech.11, 10.1242/dmm.032920 (2018). - PMC - PubMed

Publication types