. 2022 Dec 20;12(1):21981.
doi: 10.1038/s41598-022-24709-1.

Local neuroplasticity in adult glaucomatous visual cortex

Affiliations

Local neuroplasticity in adult glaucomatous visual cortex

Joana Carvalho et al. Sci Rep. .

Abstract

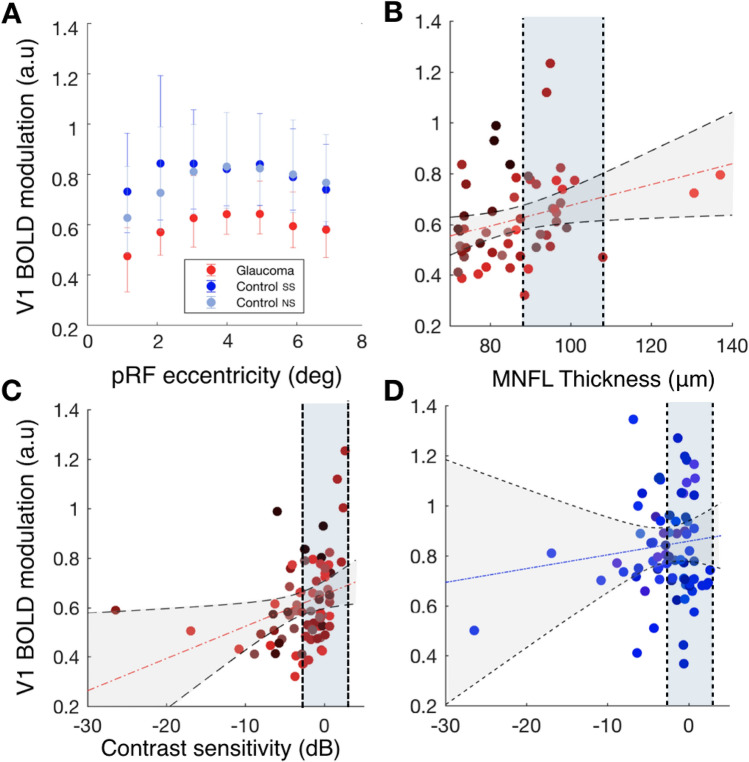
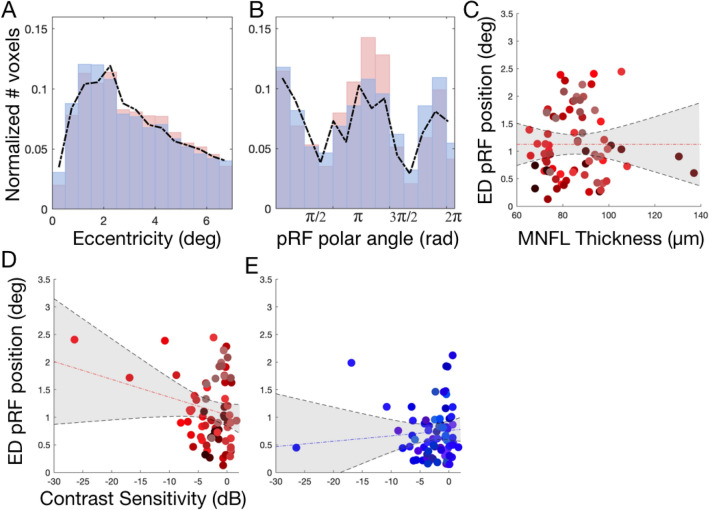
The degree to which the adult human visual cortex retains the ability to functionally adapt to damage at the level of the eye remains ill-understood. Previous studies on cortical neuroplasticity primarily focused on the consequences of foveal visual field defects (VFD), yet these findings may not generalize to peripheral defects such as occur in glaucoma. Moreover, recent findings on neuroplasticity are often based on population receptive field (pRF) mapping, but interpreting these results is complicated in the absence of appropriate control conditions. Here, we used fMRI-based neural modeling to assess putative changes in pRFs associated with glaucomatous VFD. We compared the fMRI-signals and pRF in glaucoma participants to those of controls with case-matched simulated VFD. We found that the amplitude of the fMRI-signal is reduced in glaucoma compared to control participants and correlated with disease severity. Furthermore, while coarse retinotopic structure is maintained in all participants with glaucoma, we observed local pRF shifts and enlargements in early visual areas, relative to control participants. These differences suggest that the adult brain retains some degree of local neuroplasticity. This finding has translational relevance, as it is consistent with VFD masking, which prevents glaucoma patients from noticing their VFD and seeking timely treatment.


Conflict of interest statement

The authors declare no competing interests.

Figures

Figure 1
Figure 1
V1 BOLD modulation varies between participants with glaucoma and control participants and correlates with disease severity. (A) V1 BOLD modulation, defined as a function of eccentricity for glaucoma (red) and control participants with (dark blue) and without a simulated scotoma (light blue). The BOLD modulation was binned in 1° eccentricity bins. The bars represent the 95% confidence interval (CI). (B) Correlation of the V1 BOLD modulation of participants with glaucoma obtained from individual quadrants with MNFL thickness (calculated by averaging the values of the macula of both eyes). Each data point is from a separate quadrant of an individual participant with glaucoma. The different shades of red and blue colors denote the different Glaucoma and Control participants, respectively. (C,D) Correlation of the V1 BOLD modulation from separate quadrants with the contrast sensitivity of both eyes combined (the max between the mean deviation of the two eyes) for glaucoma and controls, respectively. Each data point is from an individual VF quadrant. The vertical dashed lines and shaded blue area represent the average values ± SD of the MNFL thickness (plot B) and contrast sensitivity (plots C,D) measured in control participants, Table 1. The correlations between the BOLD modulation and the disease severity (contrast sensitivity and MNFL thickness) were calculated using a linear mixed effects model with a slope and intercept per subject as a random effect. Detailed information regarding the correlation analysis is provided in “Correlation analysis”.
Figure 2
Figure 2
Preserved cortical organization in glaucoma. (A) Eccentricity, polar angle, and pRF size maps obtained for a participant with glaucoma (G03), and their respective control participant (C03) with (SS) and without (NS) a matched simulated scotoma. The maps were obtained using a explained variance threshold of 0.1 The dashed lines delineate the visual areas V1, V2 and V3. (B) VFs for the left and right eye of the participant with glaucoma. The red line corresponds to the VF that can be mapped using fMRI (7° radius), (C) Representation of the visual perception of a participant with healthy vision (Left) and of glaucoma participant G03 (right). The binocularly integrated contrast sensitivity values (dB) are superimposed on the image. (D) Example of V1 time series (arrows in the top row of figures of (A) show the voxel locations). The upper panel in (D) shows the time series of a voxel of G03 in their SPZ (red arrow) and of a voxel with a similar pRF position but located in the contralateral hemisphere (orange arrow). The lower panel in (D) shows for C03 the time series of a voxel located in their simulated SPZ during the NS (dark blue arrow) and SS conditions (light blue arrow), respectively. (E,F) Histogram of the normalized number of responsive V1 voxels (i.e.variance explained (VE) > 15%), as a function of eccentricity and polar angle, respectively. G03 is depicted in red and C03 in the simulation condition in blue (Control SS, i.e. the simulation matched to G03). C03’s results in the no simulation (NS) condition are depicted by the dashed black line. (G) V1 PRF size as a function of eccentricity for G03 (red) and C03 in the conditions NS (light blue) and SS (dark blue). The error bars correspond to the 95% confidence interval.
Figure 3
Figure 3
V1 pRF size for participants with glaucoma and control participants. Top row: Example of single participant data: V1 pRF properties differ between participants G01 and C01. (A,B) Histogram of the normalized number of responsive voxels, those whose VE > 15%, as a function of eccentricity and polar angle, respectively. The glaucoma participant (G01) is depicted in red and the control participant (C01) in the simulation condition in blue (SS; simulation matched to G01). The control participant’s results in the no simulation (NS) condition are depicted by the dashed black line. (C) PRF size as a function of eccentricity for the participant with glaucoma (red) and the control participant in the conditions NS (light blue) and SS (dark blue). The error bars correspond to the 95% confidence interval. (D) VFs for the left and right eye. Bottom row: Group level analysis. (E) Mean cumulative distributions of pRF size in V1 for the glaucoma participants (red) and the control participants (NS: light blue, SS: dark blue). (F,G) V1 pRF size obtained for the glaucoma participants as a function of contrast sensitivity and MNFL, respectively. Data are shown per VF quadrant. Different colors denote the different participants. The dashed red line depicts the linear fit while the black dotted lines and shaded areas correspond to the 95% CIs. (H) is a similar plot as (G) but for the control participants (SS condition).
Figure 4
Figure 4
V1 pRF properties differ between participants with glaucoma and control participants. (A,B) Histogram of the normalized number of responsive voxels, those whose VE > 15%, averaged across all the participants, as a function of eccentricity and polar angle, respectively. The average of all the glaucoma participants is depicted in red and the average of control participants SS in blue. The dashed black line depicts the histogram of the control participant’s in the no simulation (NS) condition. (C,D) Correlation between the Euclidean Distance (ED) between the average pRF position per VF quadrant obtained for Glaucoma and Controls SS and the contrast sensitivity and MNFL, respectively. (E) Analogous correlation to (D) but here the ED is calculated between Controls SS and Controls NS. Data are plotted per VF quadrant. Different colors denote the different participants. The dashed red line depicts the linear fit and the black line and shaded area corresponds to the 95% CI.
Figure 5
Figure 5
Comparison of the visual field reconstructions for visual areas V1, V2 and V3 of a participant glaucoma (G10) and the matched control participant (C02) with (SS) and without simulation (NS). The visual field reconstructions are based on the deviation between Glaucoma and Control SS from the average controls NS group (excluding the control participant with the SS matched to the glaucoma patient). The color code corresponds to the deviation to the CI, in particular regions of the VF within 5–95% CI are coded in white while the gray and green tones correspond to the < 5% and > 5% normal limits, respectively. The bottom panel shows the glaucoma participant SAP test and dashed red line corresponds to the VF that could be mapped using fMRI. The visual field reconstructions were obtained using pRFs estimated using the micro-probing technique.
Figure 6
Figure 6
Comparison of the V1 visual field reconstruction between glaucoma and control SS participants. VF reconstruction glaucoma-control participants SS pairs and the SAP tests for the left and right eye are shown. Note that to compare the binocular reconstructed VF with the monocular HFA outcomes, the highest contrast sensitivity from both eyes should be considered. The visual field reconstructions were obtained using pRFs estimated using the micro-probing technique.
Figure 7
Figure 7
Example of the stimuli used to obtain pRF parameter estimates. (A) LCR stimulus. (B) LCR SS stimulus, this particular example depicts the contrast sensitivity loss of participant G01 (MD(OS) = − 14.72 MD (OD) = − 8.37). The colour of the cross changed between yellow and black, and served to guide the gaze of the participant with central scotomas to the center of the cross. (C,D) Show the full field (FF) the scotoma field (SF) models used in the pRF analysis, respectively.

References

    1. Haak KV, et al. Abnormal visual field maps in human cortex: A mini-review and a case report. Cortex. 2014;56:14–25. doi: 10.1016/j.cortex.2012.12.005. - DOI - PubMed
    1. Halbertsma HN, Haak KV, Cornelissen FW. Stimulus- and neural-referred visual receptive field properties following hemispherectomy: A case study revisited. Neural Plast. 2019;2019:6067871. doi: 10.1155/2019/6067871. - DOI - PMC - PubMed
    1. Hoffmann MB, Dumoulin SO. Congenital visual pathway abnormalities: A window onto cortical stability and plasticity. Trends Neurosci. 2015;38:55–65. doi: 10.1016/j.tins.2014.09.005. - DOI - PubMed
    1. Dilks DD, Baker CI, Peli E, Kanwisher N. Reorganization of visual processing in macular degeneration is not specific to the ‘preferred retinal locus’. J. Neurosci. 2009;29:2768–2773. doi: 10.1523/JNEUROSCI.5258-08.2009. - DOI - PMC - PubMed
    1. Clavagnier S, Dumoulin SO, Hess RF. Is the cortical deficit in amblyopia due to reduced cortical magnification, loss of neural resolution, or neural disorganization? J. Neurosci. 2015;35:14740–14755. doi: 10.1523/JNEUROSCI.1101-15.2015. - DOI - PMC - PubMed

Publication types