. 2022 Dec;3(12):1534-1552.
doi: 10.1038/s43018-022-00475-x. Epub 2022 Dec 20.

A single-cell atlas of glioblastoma evolution under therapy reveals cell-intrinsic and cell-extrinsic therapeutic targets

Affiliations

A single-cell atlas of glioblastoma evolution under therapy reveals cell-intrinsic and cell-extrinsic therapeutic targets

Lin Wang et al. Nat Cancer. 2022 Dec.

Abstract

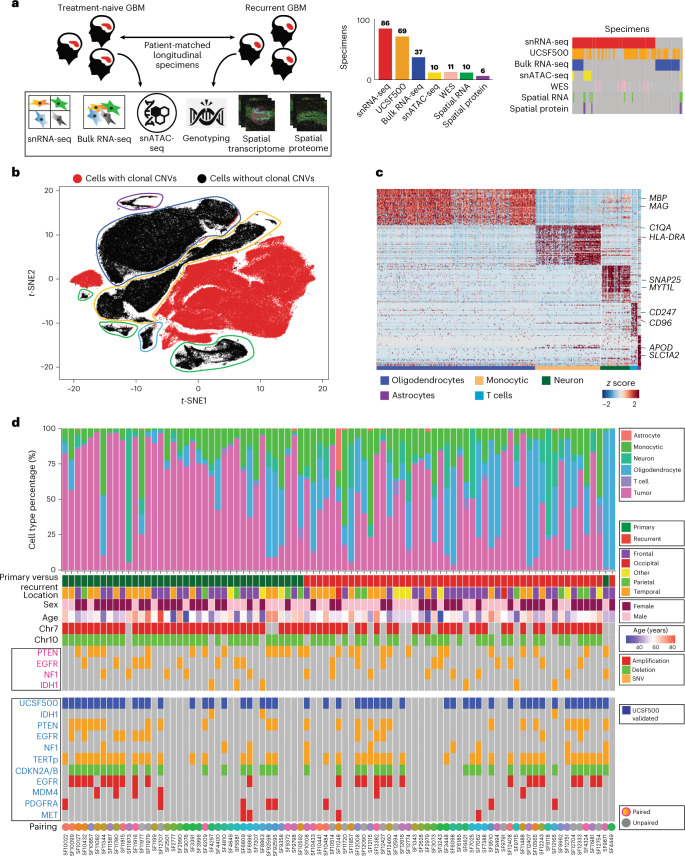
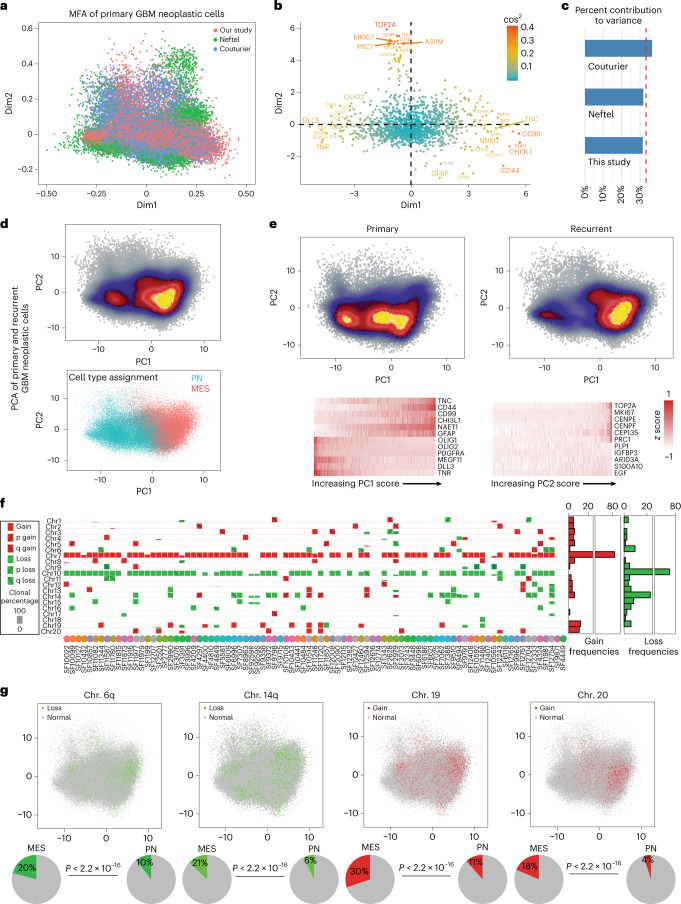
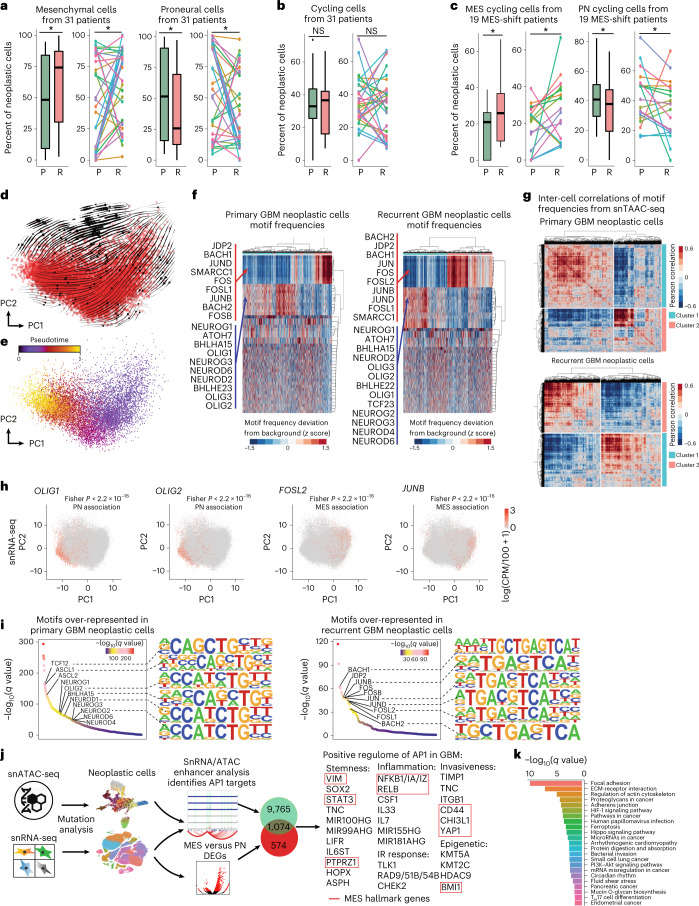
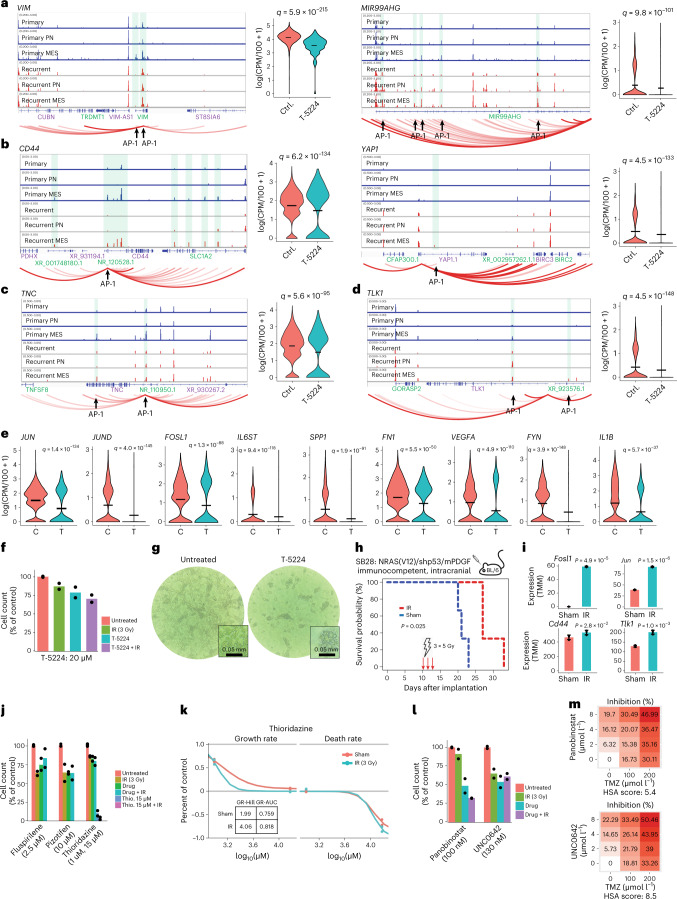
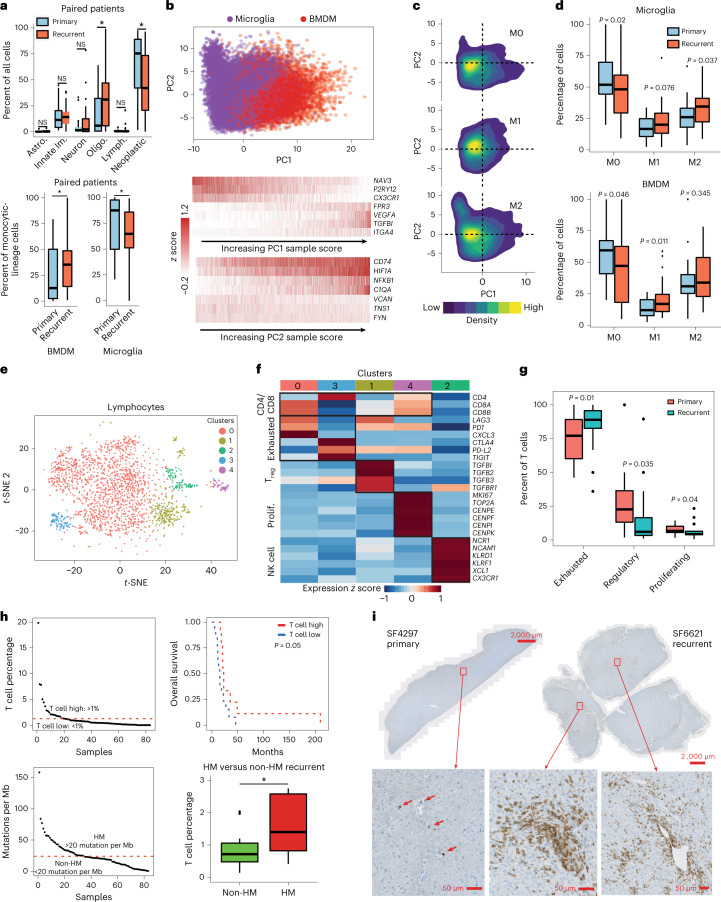
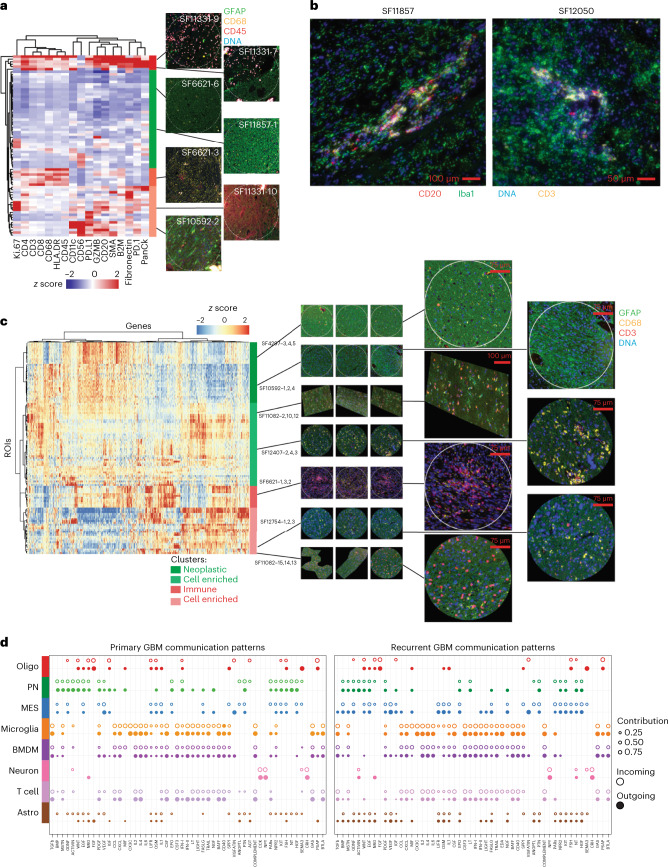
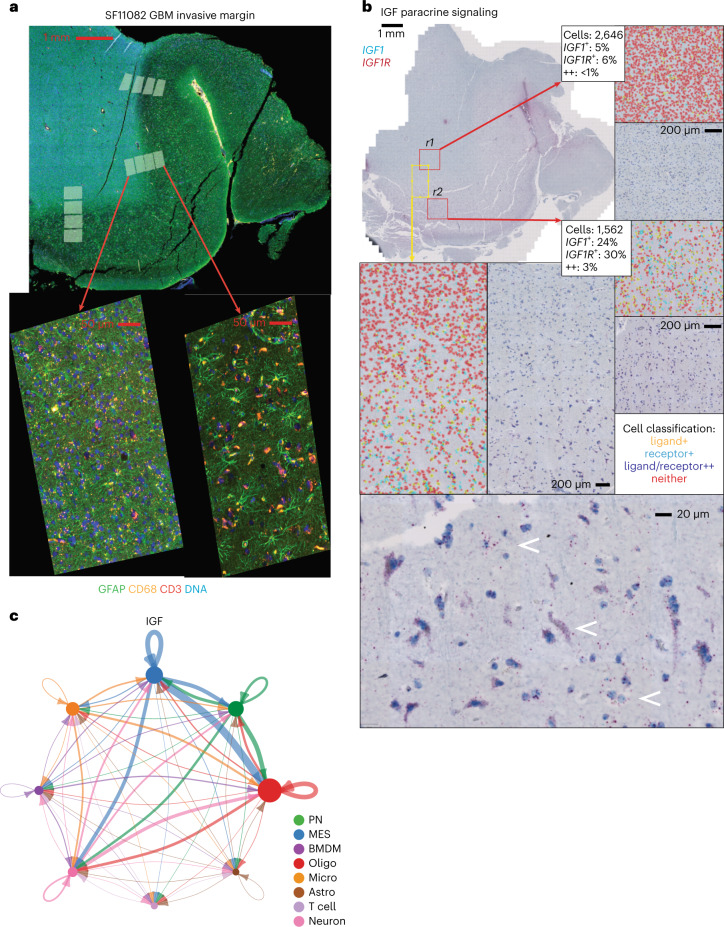
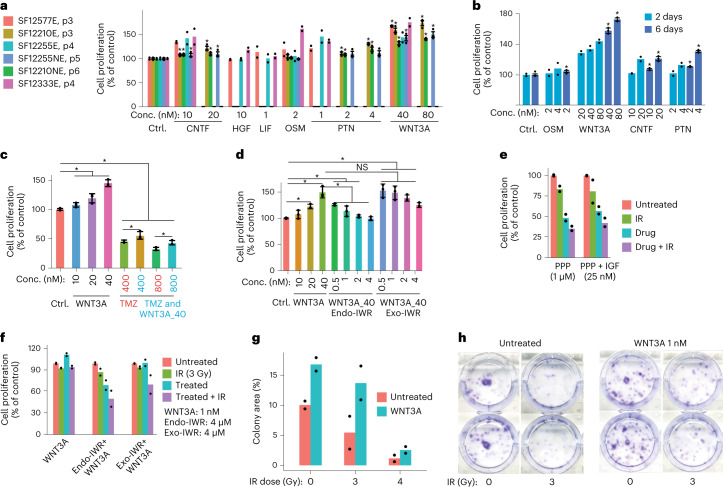
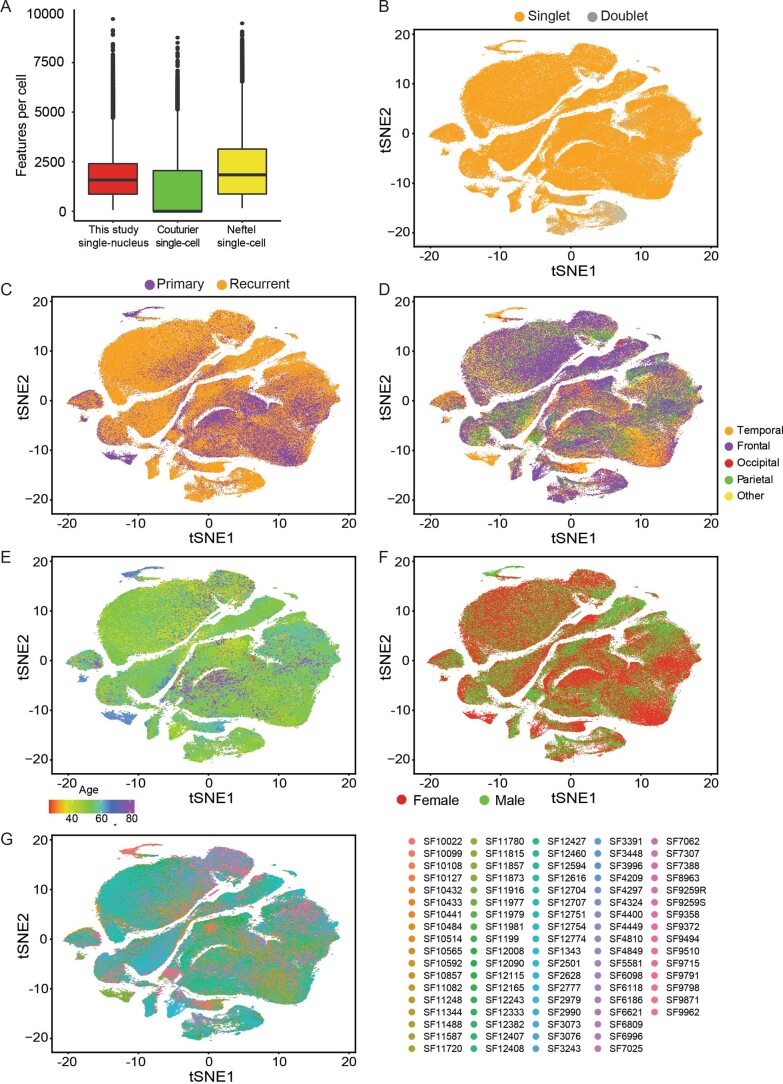
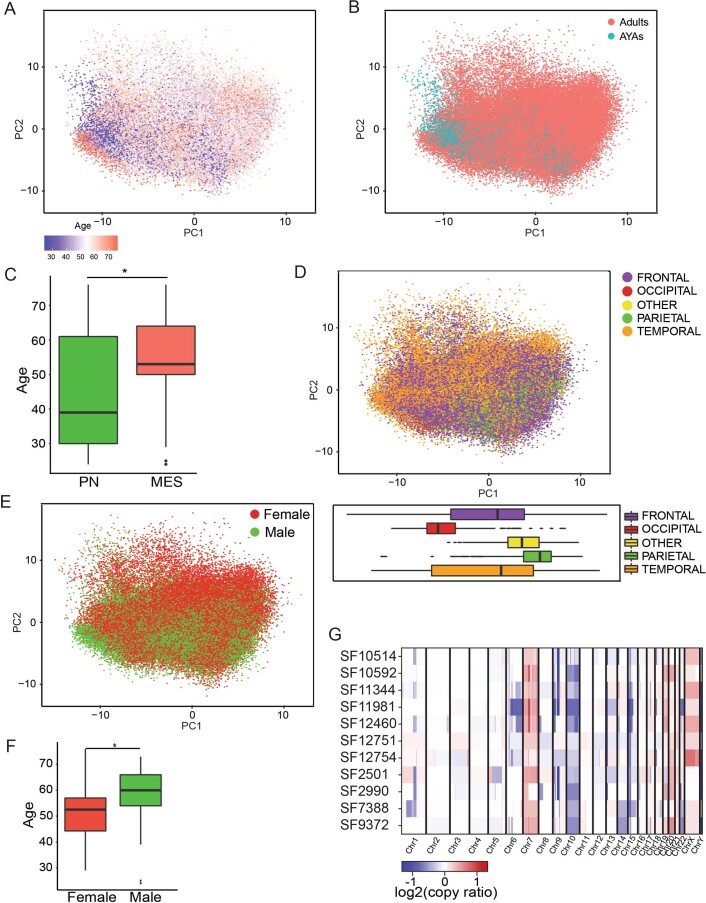
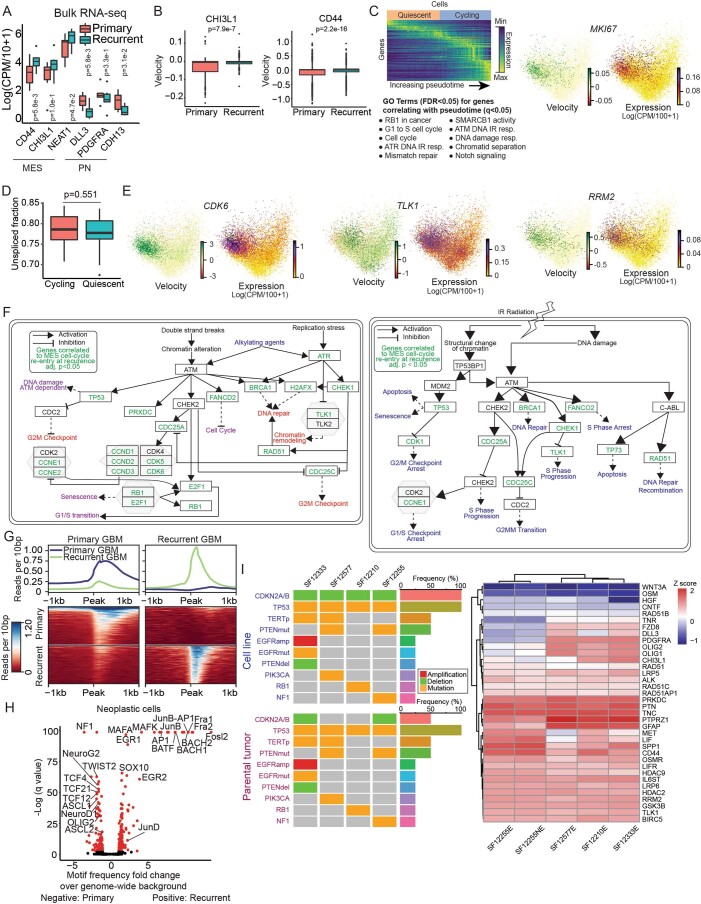
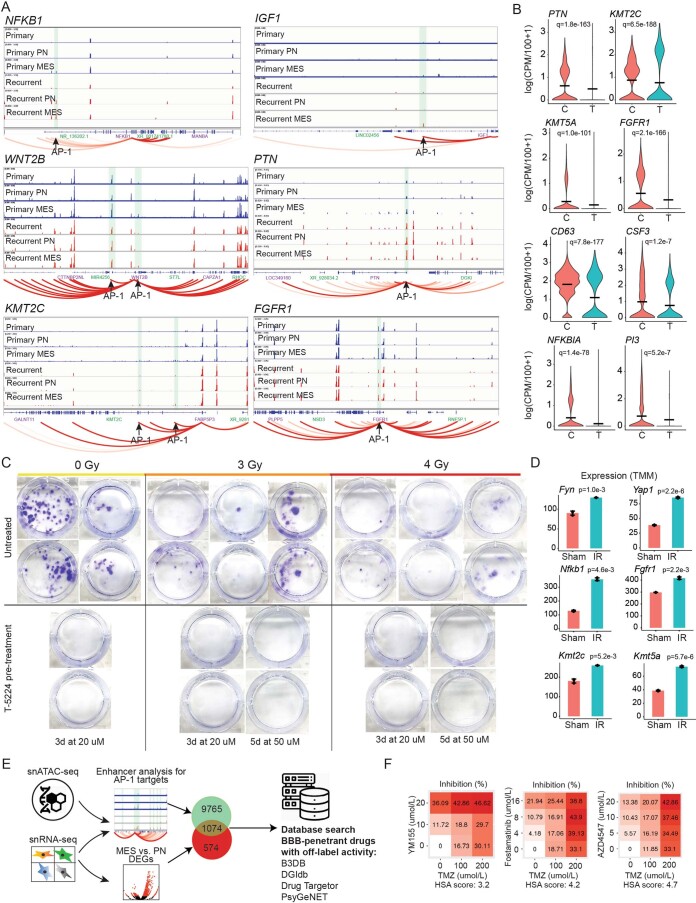
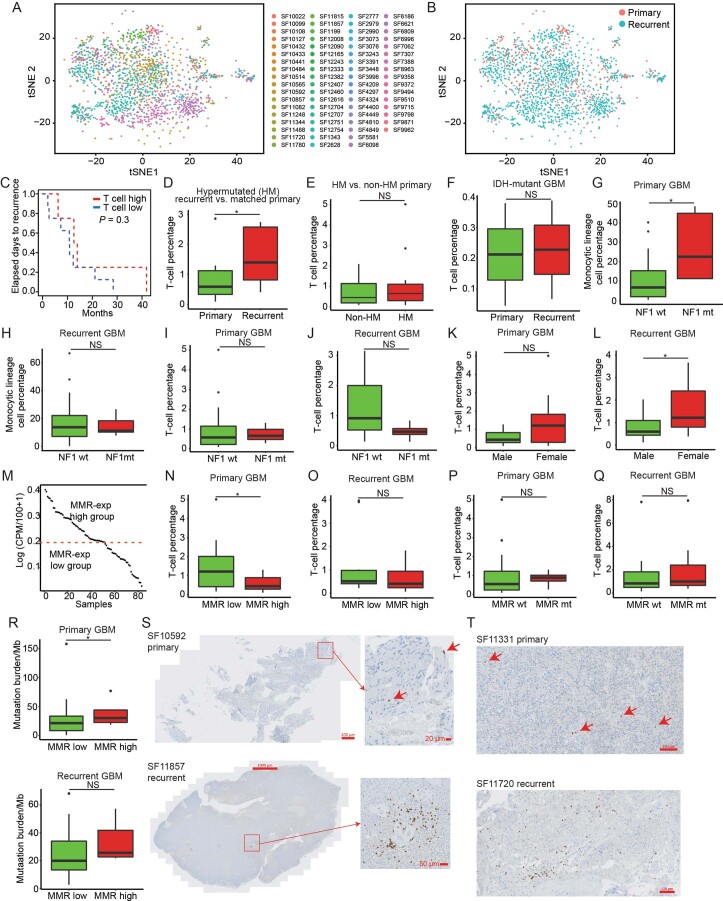
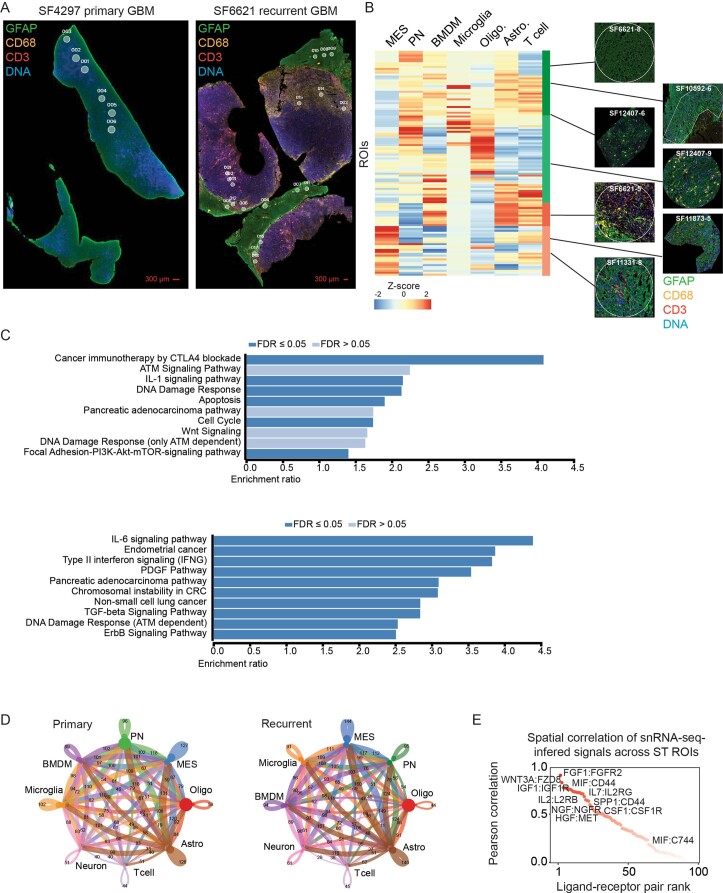
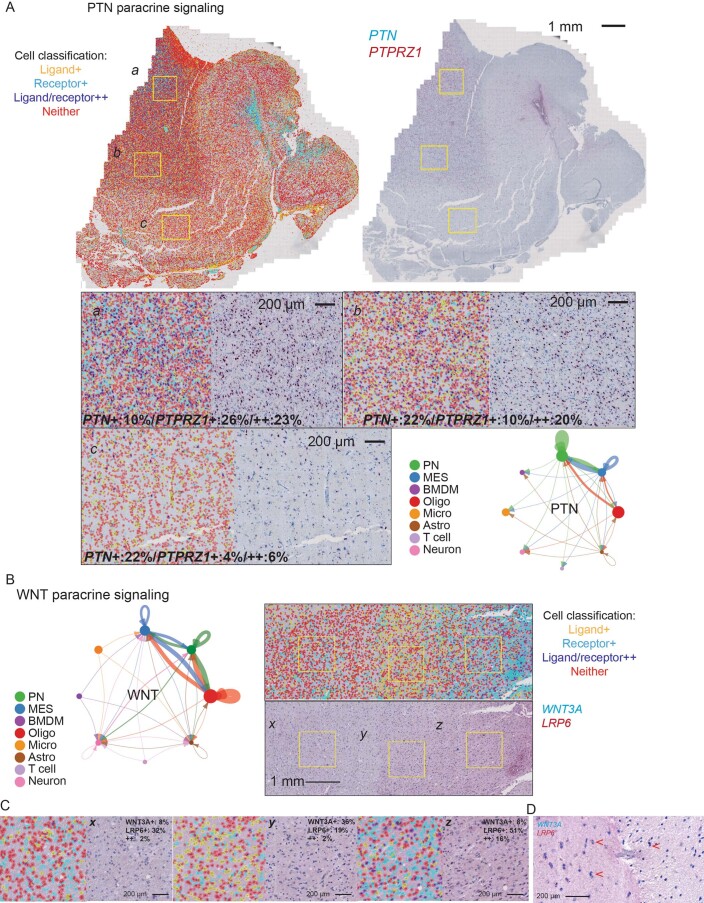
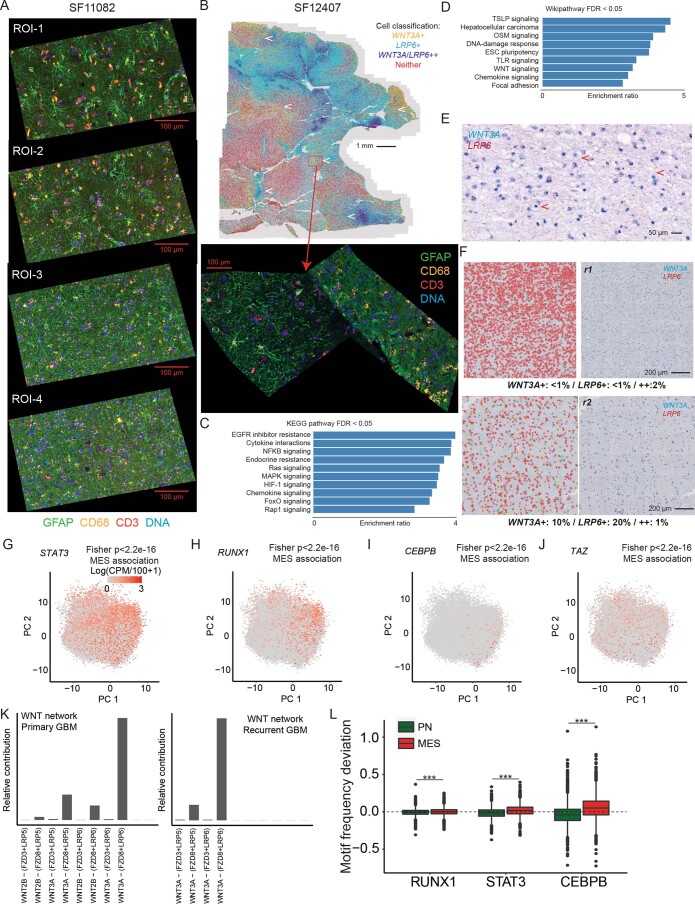
Recent longitudinal studies of glioblastoma (GBM) have demonstrated a lack of apparent selection pressure for specific DNA mutations in recurrent disease. Single-cell lineage tracing has shown that GBM cells possess a high degree of plasticity. Together this suggests that phenotype switching, as opposed to genetic evolution, may be the escape mechanism that explains the failure of precision therapies to date. We profiled 86 primary-recurrent patient-matched paired GBM specimens with single-nucleus RNA, single-cell open-chromatin, DNA and spatial transcriptomic/proteomic assays. We found that recurrent GBMs are characterized by a shift to a mesenchymal phenotype. We show that the mesenchymal state is mediated by activator protein 1. Increased T-cell abundance at recurrence was prognostic and correlated with hypermutation status. We identified tumor-supportive networks of paracrine and autocrine signals between GBM cells, nonmalignant neuroglia and immune cells. We present cell-intrinsic and cell-extrinsic targets and a single-cell multiomics atlas of GBM under therapy.


Conflict of interest statement

The authors declare no competing interests.

Figures

Fig. 1
Fig. 1. A single-cell RNA atlas of human glioblastoma through recurrence.
a, An overview of genomics studies on paired longitudinal GBM specimens. b, A t-distributed stochastic neighbor embedding (t-SNE) of the first ten principal components of snRNA-seq data. Cells with CNVs are annotated. n = 86 tumors were used (bd). c, A hierarchical clustering of cells without CNVs, with several cluster-specific genes highlighted. d, A summary of sample cellular composition, genotype and demographics. Top: cellular composition inferred from snRNA-seq. Middle: patient and sample annotations, with genotype inferred from snRNA-seq. Bottom: genotypes inferred from the UCSF500 clinical DNA-amplicon-sequencing assay performed on adjacent tissue and controlled by sequencing a patient-matched blood specimen.
Fig. 2
Fig. 2. A meta-analysis of public and in-house data identifies the proneural-to-mesenchymal axis as the primary source of phenotypic variation in glioblastoma neoplastic cells and genetic correlates.
ac, MFA of primary GBM neoplastic cells from the scRNA-seq data of Neftel et al. (n = 5,588 cells), Couturier et al. (n = 17,884 cells) and snRNA-seq from our study (n = 34,582 cells). Cell loadings (a), gene scores (b) and an analysis of each dataset’s contribution to variance explained (c). d, Top: PCA of all GBM neoplastic cells from our study from longitudinal specimens. n = 78,415 cells from 62 paired tumors. Bottom: PN and MES cell-type assignments. e, Separate plots of the cells from primary GBMs (left) and recurrent cases (right). Expression values of top-loading genes in single cells are shown below. Cells are sorted according to position along the axis labeled. n = 78,415 cells. f, Summary of megabase-scale CNVs detected in the snRNA-seq data, indicating the presence of CNVs in individual samples, their type and cellular frequency. n = 86 tumors. g, The distribution of Chr6, Chr14, Chr19+ and Chr20+ CNVs in single cells in PCA from d. Bottom: percentages of PN and MES cells that have these genotypes and the associated one-sided Fisher’s P value indicating the probability that this association occurs by chance. n = 78,415 cells.
Fig. 3
Fig. 3. A proneural-to-mesenchymal shift is observed in GBM at recurrence, driven by an increase in cycling mesenchymal cells and mediated by AP1.
a, Percentages of PN and MES neoplastic cells in patient-matched paired primary and recurrent specimens via snRNA-seq (P = 0.03967). b, The percentages of cycling neoplastic cells in primary and recurrent samples. c, The percentages of PN and MES cycling cells for paired cases undergoing PN-to-MES shift (P = 0.01565). Paired longitudinal samples were used (ac); n = 62 paired samples from 31 patients (a,b) and n = 38 samples from 19 patients who underwent MES transition (c). Boxplot lower/upper whiskers indicate the smallest/largest observation ≥/≤ the lower/upper hinge ± 1.5 times the interquartile range (IQR); lower/upper hinge indicates 25th/75th percentiles; and the center indicates 50th percentile. A one-sided Wilcoxon signed-rank test for paired samples was used. *P 0.05. P, primary; R, recurrent. d, RNA velocities and associated field lines for n = 10,456 MES cells from recurrent GBMs, visualized via PCA. e, Inference of pseudotime based on the flow field in d. n = 10,456 cells. f, Heat maps comparing cell-by-motif matrices of transcription factor motif deviances between primary and recurrent GBMs, derived from snATAC-seq of n = 3,894 neoplastic cells from primary tumors and n = 7,087 neoplastic cells from recurrent tumors. g, Heat maps of snATAC-seq inter-cell correlations of transcription factor motif frequencies obtained as deviances from a data-driven background distribution, compared between primary and recurrent neoplastic cells. n = 3,894 primary GBM and n = 7,087 recurrent GBM derived cells. h, Scatter-plots of proneural and AP1 transcription factor expression in snRNA-seq from n = 78,415 neoplastic cells show significant (one-sided Fisher’s P < 2 × 10−16) association with PN and MES cells, respectively. i, Over-represented (q < 0.05) transcription factor motifs in snATAC-seq reads from n = 3,894 primary (left) and n = 7,087 recurrent (right) neoplastic cells. Significance was assessed with a two-sided t-test and adjusted for multiple hypothesis testing via Storey’s method. j, A summary of the AP1 regulome, consisting of genes that are both upregulated in MES cells in the snRNA-seq data and also show correlated enhancer activity at nearby AP1 binding sites, specifically in MES cells from the snATAC-seq data. k, KEGG pathway analysis of the inferred AP1 regulome.
Fig. 4
Fig. 4. AP1 positively regulates the mesenchymal phenotype and is induced by ionizing radiation.
ad, Left: enhancer activity analysis identifies enhancers that correlate with nearby gene expression, contain AP1 recognition motifs and are differentially active in human MES versus PN cells, from n = 20,544 cells. Right: concomitant decreases in gene expression after AP1 inhibition, observed in low-passage GBM cultures treated for 48 h with T-5224. n = 3,593 cells. e, Other significant changes in gene expression following AP1-inhibitor treatment. n = 3,593 cells. Significance was assessed with a two-sided likelihood-ratio test between hurdle models and adjusted for multiple hypothesis testing via the Benjamini–Hochberg method (ae). f, Cell proliferation following a 3-d AP1 inhibitor treatment and 48 h after treatment with 3 Gy of IR, for n = 2 independent experiments. g, Images of AP1 inhibitor-treated and control cultures, representative of n = 3 independent experiments. Under AP1 inhibition, monolayer-cultured GBM cells (left) detach from the BME-coated plate and continue to grow as floating spheroids. h, Survival for IR-treated (days 10, 12, 14 at 3 Gy d−1) cases and controls. Immunocompetent mice were injected intracranially with syngeneic glioma cells (SB28). n = 3 mice per condition. Significance is assessed with a log-rank test. i, Differences in AP1 and MES-signature gene expression in IR-treated versus control mice, for n = 3 mice per condition. Data are presented as mean ± s.d. Significance is assessed via a one-sided t-test. j, Cell proliferation under combination treatment of IR and BBB-penetrant antipsychotics with inferred off-label activity against TLK1, for n = 2 independent experiments. k, Inhibition and death rates for the antipsychotic thioridazine, with and without IR, from n = 2 independent experiments, indicating synergy between thioridazine and IR. l,m, Cell proliferation following treatment with an HDAC inhibitor (panobinostat) or a methyltransferase inhibitor (UNC0642), in combination with IR or TMZ. n = 2 independent experiments (l). Synergy is assessed via highest single agent (HAS) score from n = 3 independent experiments (m). Source data
Fig. 5
Fig. 5. The immune response to standard therapy.
a, Top: percentages of cell types in primary and recurrent tumors (n = 62 tumors). Oligodendrocytes, P = 0.0179; neoplastic, P = 0.00435; BMDMs, P = 0.00862; microglia, P = 0.00861. Bottom: percentages of BMDMs/microglia compared between primary and recurrent tumors. b, Top: monocytic-lineage cell PCA from n = 62 tumors. Bottom: expression levels of top-loading genes for PC1 and PC2 in single cells sorted by sample score. c, Distributions of M0, M1 and M2 activation phenotypes in PCA space. d, Distributions of innate immune-cell activation phenotypes compared between primary and recurrent specimens. n = 62 tumors. Significance assessed via a one-sided t-test. e, t-SNE plot of the first ten PC scores of tumor-associated lymphocytes that have been clustered via Seurat. f, Heat map of gene expression in lymphocytes for select cluster-specific genes classifies T cells into proliferative, exhausted and regulatory phenotypes and separates natural killer cells. g, Percentages of exhausted, regulatory and proliferating T cells compared between primary and recurrent specimens. A one-sided t-test was used to assess significance. n = 70 tumors were used (eg). h, Top left: distribution of T-cell percentages across recurrent samples, with the threshold used to separate relatively T-cell enriched and T-cell poor specimens highlighted. Top right: overall survival, comparing T-cell rich and poor specimens. Significance was assessed via a log-rank test. Bottom left: distribution of mutational burdens across samples, with the threshold used to define hypermutation status highlighted. Bottom right: percentages of T cells compared between hypermutated and non-hypermutated recurrent specimens. Asterisk indicates one-sided Wilcoxon rank-sum test P = 0.0493, from n = 31 tumors. In boxplots in a, d, g and h lower/upper whiskers indicate smallest/largest observation ≥/≤ the lower/upper hinge ± 1.5 × IQR; lower/upper hinge indicates 25th/75th percentile; and center indicates 50th percentile. Patient-matched primary-recurrent paired specimens and the one-sided Wilcoxon signed-rank test for significance were used (a,d,g). *P 0.05. i, IHC for CD8 in FFPE specimens, comparing a patient-matched primary and recurrent pair, where the recurrent specimen is an outlier case with T-cell abundance over fourfold greater than average, representative data from four independent experiments with similar results.
Fig. 6
Fig. 6. A spatial transcriptomic and proteomic atlas of human GBM through recurrence.
a, A hierarchical clustering of SP ROIs with IF of typical ROIs (from 72 ROIs from six slides assayed) corresponding to the associated protein signatures (right). b, IF of two T-cell outlier cases indicating the presence of putative tertiary lymphatic structures, out of three outlier cases assayed. c, A hierarchical clustering of ST ROIs across genes. IF of typical ROIs (from 120 ROIs from ten slides assayed) corresponding to the associated mRNA signatures are annotated (right). d, Incoming and outgoing auto/paracrine signals between GBM cell types, inferred from snRNA-seq and compared between primary and recurrent GBM specimens, from n = 86 tumors. Receptor–agonist pairs were summarized by pathway and are annotated (bottom).
Fig. 7
Fig. 7. Integration of snRNA-seq and ST data identifies tumor-supportive paracrine signals with nonmalignant glia.
a, IF in a GBM specimen used for ST, representative of n = 10 tumors. b, RNAscope on sections adjacent to a. Alongside are images where cells have been segmented and receptor/ligand stains quantified. Receptor mRNA is tagged red and ligand mRNA is teal. In processed images, ligand-expressing cells are yellow, receptor-positive cells are cyan, double-positive cells are purple and double-negative cells are red. RNAscope double staining for the receptor/ligand IGF1/IGF1R is shown. A window spanning the tumor-normal interface is highlighted in yellow, with a breakout showing a gradient of IGF1 and IGF1R expression. Breakouts (r1 and r2) highlight sporadic IGF1/IGF1R expression in the cellular tumor and elevated IGF1/IGF1R expression in diffusely infiltrated, adjacent nonmalignant tissue. c, A network diagram of IGF1/IGF1R signaling from snRNA-seq, shown alongside RNAscope from the invasive edge.
Fig. 8
Fig. 8. In vitro study of learned paracrine signals.
a, Proliferation across six cell lines assayed post treatment for 6 d with recombinant proteins at varied concentrations, in n = 2 or n = 3 independent experiments per recombinant, as indicated. In ad, where n = 3, a one-sided t-test was used (*P < 0.05) and error bars indicate ± s.d. In ag, bar heights indicate the mean. b, Cell proliferation assayed after 2 and 6 d, in n = 2 or n = 3 independent experiments, respectively. c, WNT3A treatment significantly enhances resistance to TMZ treatment. n = 3 independent experiments. d, Co-treatment with recombinant WNT3A and a WNT3A inhibitor (Endo-IWR), but not treatment with a highly specific negative control (Exo-IWR), recovers baseline proliferation levels of treatment with WNT3A ligand. n = 3 independent experiments. e, Treatment with recombinant IGF1, with and without 3 Gy IR or an IGF inhibitor (PPP) and controls. n = 2 independent experiments. f, Treatment with WNT3A, with and without 3 Gy IR, Endo/Exo-IWR and controls. n = 2 independent experiments. g,h, Clonogenic assays with 1 nM WNT3A treatment, with and without 3 Gy IR and controls. n = 2 independent experiments. bh utilize the cell line SF12210c1 from a. Source data
Extended Data Fig. 1
Extended Data Fig. 1. ScRNA-seq preprocessing and QC.
a) Feature counts per cell compared between the single-nucleus RNA-seq from this study and single-cell data from recent studies of GBM, all data were acquired via the 10X Genomics platform. The numbers biologically independent cells used for this panel were: N = 93,032 (our study), 22,559 (Couturier), and 12,010 (Neftel). Boxplots are defined as follows, lower/upper whiskers: smallest/largest observation ≥/≤ the lower/upper hinge −/+ 1.5 times the interquartile range (IQR); lower/upper hinge: 25th/75th percentile; center: 50th percentile. b) TSNE plot of the first 10 principal components of the snRNA-seq data with inferred doublet events highlighted. N = 86 tumors shown in panels B-G. c)-g), as in b), but primary-vs-recurrent, location of specimen resection, patient age, sex, and identifier annotated respectively.
Extended Data Fig. 2
Extended Data Fig. 2. Clinical and genomic correlates of expression.
a) A PCA of GBM neoplastic cells from snRNA-seq with patient age annotated, N = 78,415 cells. b) Annotation of adult vs. adolescent and young-adult status, N = 78,415 cells. c) A comparison of patient age between snRNA-seq neoplastic cells classified as PN vs. MES, N = 72 tumors. *- one-sided Wilcoxon rank-sum test p = 0.0161. Boxplots in panels C and E-F are defined as follows, lower/upper whiskers: smallest/largest observation ≥/≤ the lower/upper hinge −/+ 1.5 times the interquartile range (IQR); lower/upper hinge: 25th/75th percentile; center: 50th percentile. d) A PCA of GBM neoplastic cells from snRNA-seq with location of resection annotated. The distributions along principal component one of cells by location are shown as boxplots below, N = 78,415 cells. e) As above, but with sex annotated, N = 72 tumors. f) A comparison of patient ages between the male and female sex, N = 72 tumors. *- one-sided Wilcoxon rank-sum test p = 0.0389. g) CNV calls from exome-seq for select specimens.
Extended Data Fig. 3
Extended Data Fig. 3. Validation, correlates, and models of the MES shift.
a) Comparison of PN, MES and monocytic-lineage cell marker genes between primary and recurrent bulk RNA-seq of patient-matched GBM longitudinal specimens, N = 30 tumors. A one-sided paired T-test was used to assess significance. Boxplots in panels A-B and D are defined as follows, lower/upper whiskers: smallest/largest observation ≥/≤ the lower/upper hinge −/+ 1.5 times the interquartile range (IQR); lower/upper hinge: 25th/75th percentile; center: 50th percentile. b) Boxplots of RNA velocities for MES hallmark genes CD44, CHI3L1 computed over PN neoplastic cells from recurrent GBM cases, N = 37,428 cells. A one-sided signed Wilcoxon rank-sum test was used to assess significance. c) (Left) A heatmap representation of the pseudotime inference shown in Fig. 3d, e is shown above. Gene ontology terms from WikiPathway.org that are over-represented (FDR < 0.05) based on genes that correlate with pseudotime, is shown below. (Right) RNA velocity and expression for MKI67 in MES neoplastic cells from recurrent GBMs, visualized in PCA space. d) The fractions of total spliced and unspliced mRNAs, compared between cycling and quiescent MES cells from recurrent cases using a two-sided Wilcoxon rank-sum test, p = 0.0551, N = 10,456 cells. e) RNA velocity and expression for CDK6, TLK1, and RRM2 in MES neoplastic cells from recurrent GBMs, visualized in PCA space, N = 10,456 cells. f) (Left) The DNA-damage response pathway adapted from Wikipathway.org. (Right) The response to IR pathway adapted from Wikipathway.org. Genes correlating with cell-cycle re-entry by MES cells at recurrence are annotated in green. g) Read-density and heatmap plots summarizing reads mapping to primary- and recurrent-specific scATAC-seq peaks respectively, from N = 10,981 cells. h) Over-represented transcription factor motifs in primary- and recurrent-specific scATAC-seq peaks, from N = 10,981 cells. i) (left) A comparison of genotypes between each of the patient-derived cell lines and the tumor specimens from which they were derived, performed via UCSF500 clinical genotyping. (right) Expression levels via RNA-seq of the patient-derived cell lines for PN and MES markers and genes targeted in in vitro assays.
Extended Data Fig. 4
Extended Data Fig. 4. Enhancer, in vitro, and in vivo analysis of the AP1 regulome.
a) Enhancer activity analysis, as in Fig. 4a. b) Gene expression differences between AP1 inhibitor-treated and control GBM cells following 48 hr AP1-inhibitor treatment at 20uM; C: control, T: treatment, *- q < 0.05, where q is the Benjamini-Hochberg adjusted p-value from the MAST two-sided likelihood-ratio test. N = 3,593 cells. c) A colony-formation assay with IR treatment and AP1-inhibitor pre-treatment shows that AP1 inhibition abrogates colony formation in BME d) Differential gene expression between IR-treated and control murine immunocompetent intracranial gliomas. N = 3 mice per condition were used. Data are presented as mean values + /- standard deviation. A one-sided T-test was used to assess significance. e) An overview of the pipeline employed to identify BBB-penetrant drugs that could be repurposed to blockade AP1 targets. f) Cell viability post treatment with the indicated agent, in combination with TMZ. Listed beneath is the HSA synergy score for each combination, N = 3 independent experiments. Source data
Extended Data Fig. 5
Extended Data Fig. 5. Genetic and clinical correlates of immune phenotypes.
The Wilcoxon signed-rank test was used for paired samples and the Wilcoxon rank-sum test was used for unpaired samples for all panels, * - p < 0.05. a) A TSNE plot of the first 10 principal components from snRNA-seq of N = 2,247 T cells. b) As in a), but with primary vs. recurrent annotated, N = 2,247 cells. c) Kaplan-Meier analysis of time to recurrence comparing T-cell enriched/poor cases at recurrence. d) T-cell percentages in hypermutated (HM) recurrent cases and their matched primary tumors, p = 0.0372. e) HM vs. non-HM primary cases show no significant difference in T-cells. f) Primary vs. recurrent IDH-mutant GBM T-cell percentages. g) NF1-mutant vs. NF1-wildtype primary GBM monocytic lineage cells, p = 0.0162. h) As in g), for recurrent GBMs. i, j) NF1-mutant vs. NF1-wildtype T-cell percentages in primary and recurrent GBMs. k, l) Male vs. female sex, comparing T-cell percentages in primary and recurrent GBMs, p = 0.0247. m) The distribution of miss-match repair (MMR) average gene expression across samples, in snRNA-seq of neoplastic cells, with the threshold used to define high- and low-expressing groups annotated. n, o) A significant difference in the percentage of tumor-associated T cells is seen when comparing MMR-low and MMR-high primary GBMs (p = 0.05), however, this comparison is not significant at recurrence. p, q) MMR gene-mutation status does not predict T-cell infiltration in primary or recurrent GBM. r) MMR gene-expression predicts tumor mutational burden in primary GBMs (p = 0.0302) but not in recurrent GBMs. s, t) IHC for CD8 in FFPE slides, representative data from 4 independent experiments with similar results. The top panels show primary GBM cases and sporadic T cells. The bottom panels show the corresponding patient-matched recurrent cases and an infiltration of CD8 + T cells into the cellular tumor. The numbers of independent samples used in boxplots are as follows, D: N = 20, E: N = 31, F: N = 4, G-L and N-R: N = 31. Boxplots in panels D-L and N-R are defined as follows, lower/upper whiskers: smallest/largest observation ≥/≤ the lower/upper hinge −/+ 1.5 times the interquartile range (IQR); lower/upper hinge: 25th/75th percentile; center: 50th percentile.
Extended Data Fig. 6
Extended Data Fig. 6. Pathway and network analysis of paracrine signaling from ST data.
a) Representative IF images visualizing glia, innate and adaptive immune cells, performed on patient-matched primary (left) and recurrent (right) FFPE GBM specimens (from 120 ROIs from 10 slides assayed). ROIs used for in ST profiling of this specimen are annotated. b) A heatmap showing the relative contributions of neoplastic, glial and immune cell types inferred by deconvolving ST data using snRNA-seq signatures. IF of typical ROIs corresponding to the associated cell composition signatures are annotated on the right. c) (Top) a pathway enrichment analysis via WebGestalt, using Wikipathway.org pathway annotations, for genes in the first two clusters of the ST data shown in Fig. 6c. (Bottom) as above, but for the third and fourth clusters. d) A summary of inferred intercellular paracrine signals, based on snRNA-seq data, between different GBM cell types and compared between primary and recurrent GBM. The numbers annotated for each interaction denote the number of genes involved in the given signaling pathway. d) Pearson correlations across ST ROIs and samples for receptor-agonist gene pairs inferred from snRNA-seq data.
Extended Data Fig. 7
Extended Data Fig. 7. Extended RNAscope analysis.
a–c) RNAscope on sections adjacent to Fig. 7a. Alongside are images where cells have been segmented and receptor/ligand stains quantified. Receptor mRNA is tagged red and ligand mRNA is teal. In processed images, ligand-expressing cells are yellow, receptor-positive cells are cyan, double-positive cells are purple, and double-negative cells are red. a) RNA-scope analysis of PTN/PTPRZ1. Double-positive cells are enriched in the cellular tumor, for example region a), PTN-expressing non-malignant cells are more frequent in tumor-adjacent tissue, that is b, c), and this gradient anticorrelates with PTPRZ1-expressing neoplastic cells. b) Gradients of WNT3A and LRP6 expression indicate the presence of both paracrine and autocrine signaling. c) Breakouts of sub-panels x-z) from panel B). d) A breakout of an interface between tumor and non-malignant tissue.
Extended Data Fig. 8
Extended Data Fig. 8. Extended data analysis.
a) The right most ladder of ROIs shown in Fig. 7a, showing the transition from the dense cellular tumor to diffusely infiltrated adjacent non-malignant brain tissue in a primary GBM (SF11082). b) RNAscope profiling of WNT3A/LRP6 and downstream cell classification (top) in a specimen containing interfaces between dense cellular tumor and tumor-adjacent diffusively infiltrated non-malignant tissue. The center subpanel shows adjacent tissue to the region annotated that was used for ST. Regions of putative paracrine signaling are annotated with white arrows. c, d) KEGG and Wikipathway gene associations that are over-represented in the ligand-receptor pairs that were inferred from snRNA-seq/ST co-analysis, and that correlate on average with progression from the cellular tumor to adjacent non-malignant tissue in SF11082. e) RNA-scope for WNT3A and LRP6 showing interactions between WNT3A-/LRP6 + , WNT3A + /LRP6-, and WNT3A/LRP6 + + cells, indicating putative paracrine signaling. f) RNA-scope (right) and associated cell classification (left) for WNT3A/LRP6 in regions r1 and r2 from Fig. 7b, taken from dense cellular tumor and diffusely infiltrated tumor-adjacent tissue. The frequencies of WNT3A + and LRP6 + cells (but not double-positive cells) increase over 10–20 fold in regions of diffusely infiltrated non-malignant tissue (for example r2), compared to regions of dense cellular tumor (for example r1). g–j) Expression in snRNA-seq of N = 78,415 neoplastic cells for transcription factors implicated previously as regulators of the MES phenotype. Significance for G-J is assessed via a one-sided Fisher’s exact test. k) The relative contributions to the WNT signaling pathway, compared between primary and recurrent specimens. l) Motif frequency deviations in neoplastic cells for transcription factors implicated previously as regulators of the MES phenotype, compared between PN and MES cells. N = 14 independent samples were used. Boxplots are defined as follows, lower/upper whiskers: smallest/largest observation ≥/≤ the lower/upper hinge −/+ 1.5 times the interquartile range (IQR); lower/upper hinge: 25th/75th percentile; center: 50th percentile. A Wilcoxon rank-sum test was used. *** - adjusted p < 2.2e-16.

Comment in

References

    1. Ceccarelli M, et al. Molecular profiling reveals biologically discrete subsets and pathways of progression in diffuse glioma. Cell. 2016;164:550–563. doi: 10.1016/j.cell.2015.12.028. - DOI - PMC - PubMed
    1. Verhaak RGW, et al. Integrated genomic analysis identifies clinically relevant subtypes of glioblastoma characterized by abnormalities in PDGFRA, IDH1, EGFR, and NF1. Cancer Cell. 2010;17:98–110. doi: 10.1016/j.ccr.2009.12.020. - DOI - PMC - PubMed
    1. Wang Q, et al. Tumor evolution of glioma-intrinsic gene expression subtypes associates with immunological changes in the microenvironment. Cancer Cell. 2017;32:42–56. doi: 10.1016/j.ccell.2017.06.003. - DOI - PMC - PubMed
    1. Barthel FP, et al. Longitudinal molecular trajectories of diffuse glioma in adults. Nature. 2019;576:112–120. doi: 10.1038/s41586-019-1775-1. - DOI - PMC - PubMed
    1. Mathur, R. et al. EPCO-31. Epigenomic intratumoral heterogeneity of glioblastoma in three-dimensional space. Neuro Oncol.10.1093/neuonc/noaa215.310 (2020).

Publication types