. 2022 Dec 20;29(1):107.
doi: 10.1186/s12929-022-00892-1.

Polyglutamine-expanded ATXN7 alters a specific epigenetic signature underlying photoreceptor identity gene expression in SCA7 mouse retinopathy

Affiliations

Polyglutamine-expanded ATXN7 alters a specific epigenetic signature underlying photoreceptor identity gene expression in SCA7 mouse retinopathy

Anna Niewiadomska-Cimicka et al. J Biomed Sci. .

Abstract

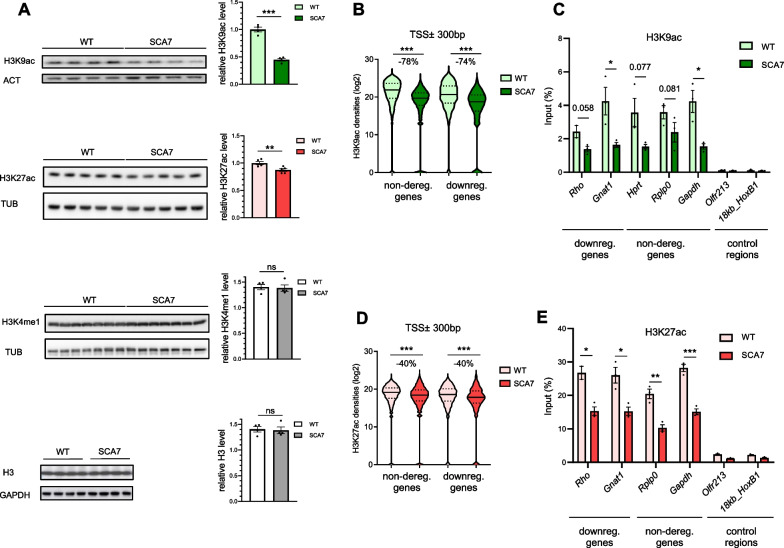
Background: Spinocerebellar ataxia type 7 (SCA7) is a neurodegenerative disorder that primarily affects the cerebellum and retina. SCA7 is caused by a polyglutamine expansion in the ATXN7 protein, a subunit of the transcriptional coactivator SAGA that acetylates histone H3 to deposit narrow H3K9ac mark at DNA regulatory elements of active genes. Defective histone acetylation has been presented as a possible cause for gene deregulation in SCA7 mouse models. However, the topography of acetylation defects at the whole genome level and its relationship to changes in gene expression remain to be determined.

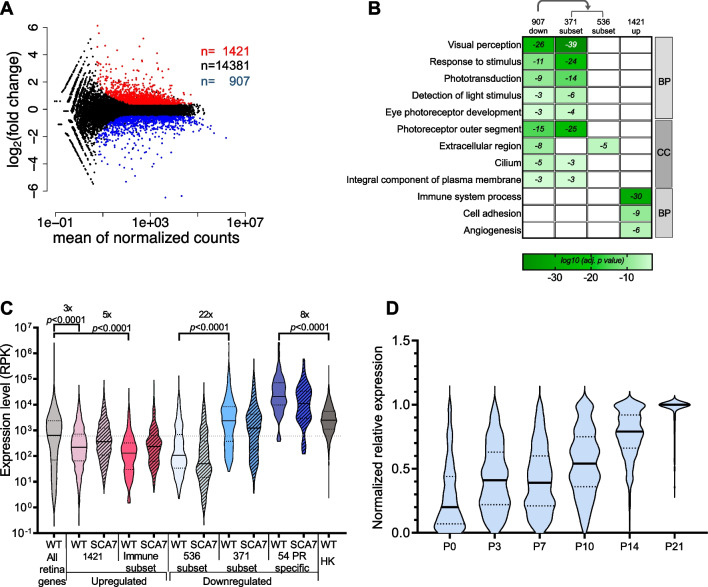
Methods: We performed deep RNA-sequencing and chromatin immunoprecipitation coupled to high-throughput sequencing to examine the genome-wide correlation between gene deregulation and alteration of the active transcription marks, e.g. SAGA-related H3K9ac, CBP-related H3K27ac and RNA polymerase II (RNAPII), in a SCA7 mouse retinopathy model.

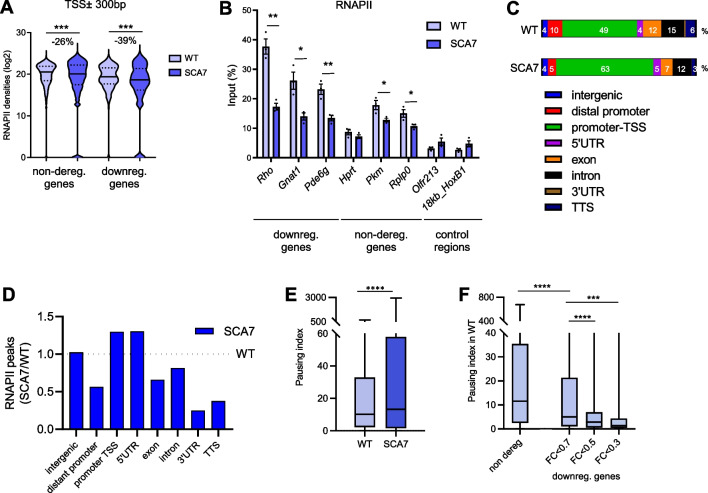
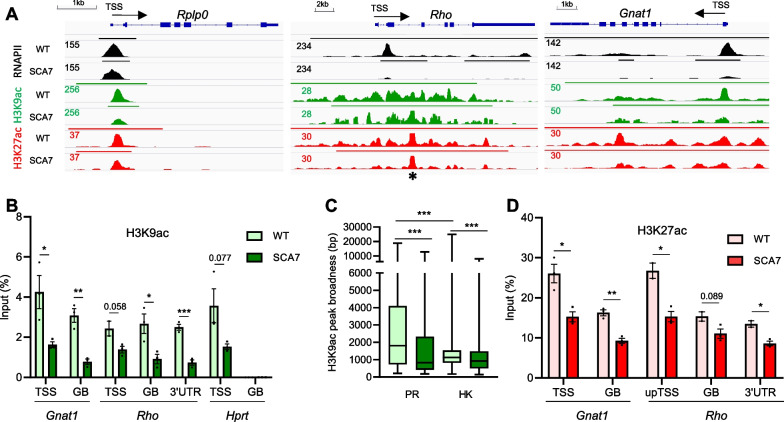
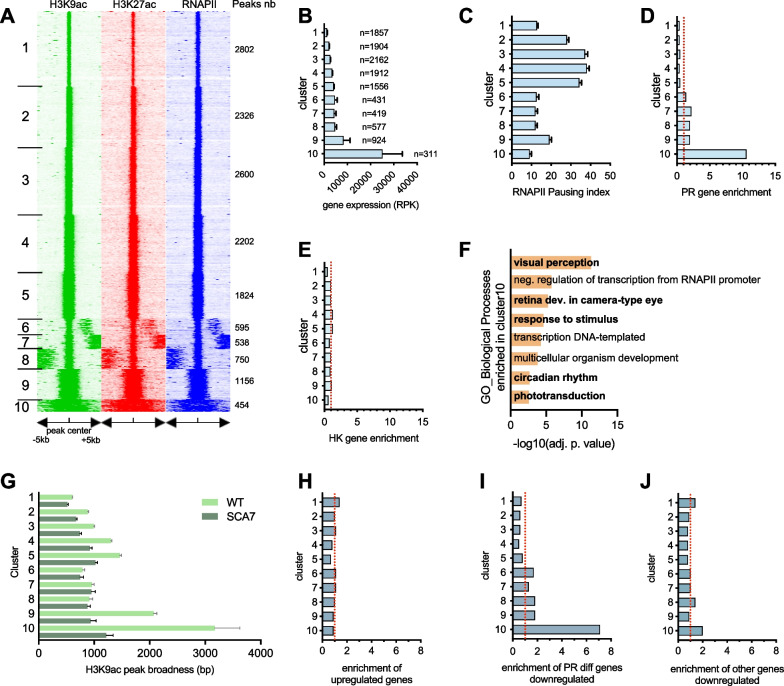
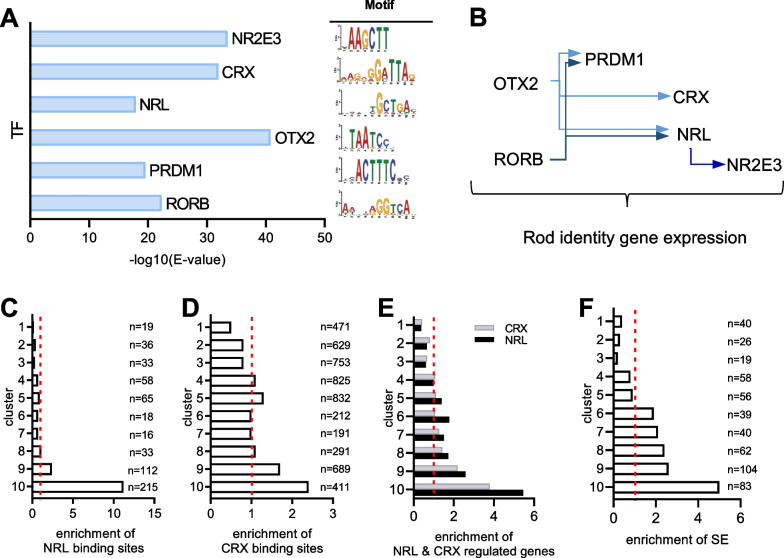
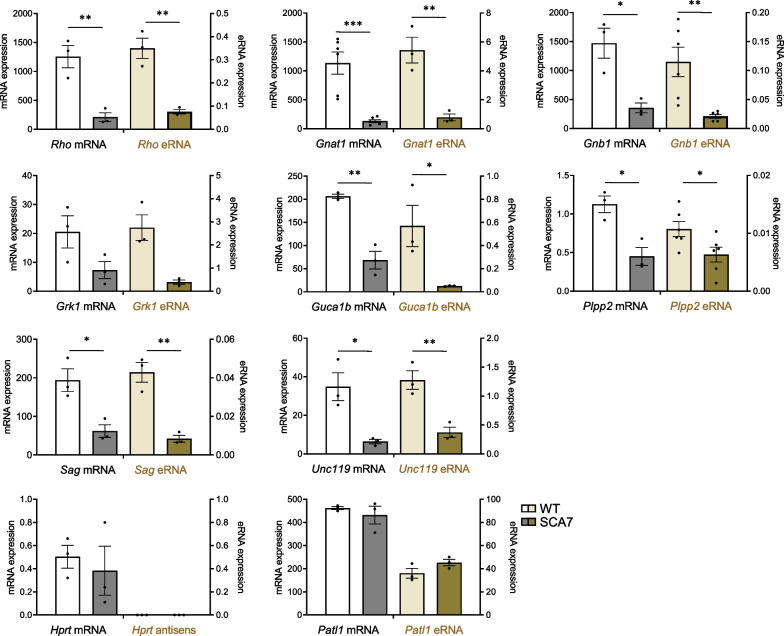
Results: Our analyses revealed that active transcription marks are reduced at most gene promoters in SCA7 retina, while a limited number of genes show changes in expression. We found that SCA7 retinopathy is caused by preferential downregulation of hundreds of highly expressed genes that define morphological and physiological identities of mature photoreceptors. We further uncovered that these photoreceptor genes harbor unusually broad H3K9ac profiles spanning the entire gene bodies and have a low RNAPII pausing. This broad H3K9ac signature co-occurs with other features that delineate superenhancers, including broad H3K27ac, binding sites for photoreceptor specific transcription factors and expression of enhancer-related non-coding RNAs (eRNAs). In SCA7 retina, downregulated photoreceptor genes show decreased H3K9 and H3K27 acetylation and eRNA expression as well as increased RNAPII pausing, suggesting that superenhancer-related features are altered.

Conclusions: Our study thus provides evidence that distinctive epigenetic configurations underlying high expression of cell-type specific genes are preferentially impaired in SCA7, resulting in a defect in the maintenance of identity features of mature photoreceptors. Our results also suggest that continuous SAGA-driven acetylation plays a role in preserving post-mitotic neuronal identity.

Keywords: Epigenomics; Neuronal identity; Photoreceptor dystrophy; SAGA; Spinocerebellar ataxia type 7; Transcriptomics.


Conflict of interest statement

The authors declare no competing interests.

Figures

Fig. 1
Fig. 1
Preferential downregulation of highly expressed photoreceptor identity genes in SCA7. A MA-plot of RNA-seq analysis depicting differentially expressed protein coding genes in 12-week-old SCA7140Q/140Q retina compared to age-matched WT. Red and blue dots represent upregulated (FC > 1.3; adj. p < 0.05) and downregulated (FC < 0.7; adj. p < 0.05) genes, respectively, and black dots correspond to non-deregulated genes. B Enrichment of Gene Ontology (GO) terms for biological processes (BP) and cellular components (CC) (log10(adjusted p value) ≤ 10–3) among the 907 downregulated genes and 1421 upregulated genes in SCA7 retina. A subset of 371 downregulated genes (out of 907) accounted for almost all retrieved vision GO terms, while the remaining 536 downregulated genes retrieved only one enriched GO term. C Violin plots comparing the expression levels of different subsets of and upregulated and downregulated genes in WT and SCA7 retina. In WT retina, the 371-subset of downregulated genes has higher expression level than the 536-subset. Among the 371-subset, 54 photoreceptor (PR) specific genes are highly expressed, as compared to housekeeping (HK) genes. In contrast, 187 upregulated genes associated to immune system process have very low expression level in WT retina, when compared to entire population of expressed retinal genes. Data were analyzed using Mann–Whitney test. D Violin plots showing the relative expression level of the subset of 371 genes downregulated in SCA7 and associated with vision functions, at different stages of retinogenesis in WT retina (RNA-seq data source from [64]). Expression level of each gene is normalized relative to its lowest (0) and highest (1) value across mouse retina development. P, post-natal day
Fig. 2
Fig. 2
Genome-wide analysis H3K9 and H3K27 acetylation at gene promoters in SCA7 retina. A Western blot analyses showing the significant decrease of H3K9ac and H3K27ac levels in SCA7 retina compared to WT, while H3K4me1 and unmodified H3 levels are not affected. Data are normalized to the level of control proteins (actin (ACT), tubulin (TUB) and GAPDH), expressed as mean ± SEM (n = 4–7 mice/genotype) and analyzed using two-tailed Student’s t-test. B Violin plots showing the reduction of H3K9ac densities on regions ± 300 bp around the transcription start site (TSS ± 300 bp) of non-deregulated and downregulated genes in SCA7 retina, compared to WT. C ChIP-qPCR analysis showing the decrease of H3K9ac occupancy (% of the input) on the TSS region of representative downregulated and non-deregulated genes in SCA7 retina compared to WT. Silent regions are used as controls. D Violin plots showing the reduction of H3K27ac densities on the TSS ± 300 bp regions of non-deregulated and downregulated genes in SCA7 retina, compared to WT. E ChIP-qPCR analysis showing the decrease of H3K27ac occupancy on the TSS region of representative downregulated and non-deregulated genes in SCA7 retina compared to WT. Silent regions are used as controls. Data in B and D were analyzed using Mann–Whitney test. Data in C and E are normalized as percentage of input DNA signal, expressed as mean ± SEM (n = 3 mice/genotype) and analyzed using two-tailed Student’s t-test. *p < 0.05; **p < 0.01; ***p < 0.001; ns non-significant
Fig. 3
Fig. 3
SCA7 downregulated genes have low RNAPII pausing. A Violin plots showing the decrease of RNAPII densities on TSS ± 300 bp regions of non-deregulated and downregulated genes in SCA7 retina, compared to WT. B ChIP-qPCR analysis showing the decrease of RNAPII occupancies (% of the input) on the TSS region of representative downregulated and non-deregulated genes in SCA7 retina compared to WT. Silent regions are used as controls. C Comparison of genomic distribution of RNAPII peaks in WT and SCA7 retina. Data are displayed as percentage of peaks annotated to each region relative to total number of peaks. Distant promoter (− 20 kb to − 1 kb relative to the TSS), promoter-TSS (− 1 kb to + 100 bp at the TSS), and TTS (− 100 bp to + 1 kb relative to the TTS). D Graph representing the ratio of RNAPII peak distribution in different genic and intergenic regions in SCA7 and WT retina. E Graph showing the comparison of RNAPII pausing index in WT and SCA7 retina for all expressed protein coding genes. F Graph showing the comparison of RNAPII pausing index at basal level in WT retina for non-deregulated gene sets and SCA7 downregulated genes with different fold change (FC). Data in A, E and F were analyzed using Mann–Whitney test. Data in B are normalized as percentage of input DNA signal, expressed as mean ± SEM (n = 3 mice/genotype) and analyzed using two-tailed Student’s t-test. *p < 0.05; **p < 0.01; ***p < 0.001, ****p < 0.0001
Fig. 4
Fig. 4
Atypically broad H3K9 acetylation is deposited at photoreceptor identity gene loci and is altered in SCA7 retina. A Genome browser tracks depicting RNAPII, H3K9ac and H3K27ac distributions at a representative housekeeping gene (Rplp0) and two photoreceptor specific genes (Rho and Gnat1) in WT and SCA7 retinas. In WT retina, RNAPII, H3K9ac and H3K27ac show characteristic narrow peaks in the TSS region of Rplp0. In contrast, broad signals of H3K9ac, H3K27ac and RNAPII are found throughout the entire gene bodies of Rho and Gnat1. In SCA7 retina, peak height and peak broadness as illustrated by the called peaks (top straight bar) of RNAPII, H3K9ac and H3K27ac are decreased at Rho and Gnat1 genes. * indicate saturated peak in Rho gene due to repetitive sequences. B ChIP-qPCR analysis shows H3K9ac occupancy on the TSS, gene body (GB) and 3′UTR regions of Rho and Gnat1 genes, as well as occupancy on the TSS, but not on the GB of the housekeeping Hprt gene in WT retina. In SCA7 retina, H3K9ac occupancy is globally decreased on Rho and Gnat1 gene loci and on the TSS of Hprt gene. Data are normalized as a percentage of input DNA, expressed as mean ± SEM (n = 3 mice/genotype) and analyzed using two-tailed Student’s t-test. C Box plots depicting the broadness (in base pairs (bp)) of H3K9ac peaks on photoreceptor specific genes (n = 95) and on housekeeping genes (n = 3485) in WT and SCA7 retina. Data were analyzed using Mann–Whitney test. D ChIP-qPCR analysis shows H3K27ac occupancy along the Rho and Gnat1 gene loci in WT retina and its decrease in SCA7 retina; (upTSS, upstream of TSS). Data are normalized as a percentage of input DNA, expressed as a mean ± SEM (n = 3 mice/genotype) and analyzed using two-tailed Student’s t-test. *p < 0.05; **p < 0.01; ***p < 0.001
Fig. 5
Fig. 5
Broad H3K9ac defines a category of photoreceptor genes vulnerable to downregulation in SCA7. A Heatmap integrating the genome-wide profiles of H3K9ac, H3K27ac and RNAPII densities in WT retina. The window corresponds to the center of H3K9ac peaks ± 5 kb. Heatmaps were obtained from seqMINER with 10 clusters corresponding to different epigenomic states. B, C Graph representing the expression level (B) and RNAPII pausing index (C) of protein coding genes annotated to each cluster in WT retina. n, number of protein coding genes per cluster. Data presented as mean ± SEM and are analyzed using one-way ANOVA followed by Tukey post-hoc test (expression level: F(9, 12072) = 16.37, p < 0.0001; pausing index, F(9, 14075) = 99.63, p < 0.0001). D, E Graphs representing the enrichment of photoreceptor specific (PR) (D) and housekeeping (HK) (E) genes annotated to each cluster. The analysis concerns the distribution of 95 PR genes and 3485 HK genes across all clusters, and bars refer to the ratio of observed versus expected number of genes in each cluster normalized to 1 (dashed red line). The enrichments are 11 × more PR specific genes (pcluster10 = 5.1 × 10–23, hypergeometric test) and 1.6 × less HK genes (pcluster10 = 4.9 × 10–6) than expected in cluster 10. F Gene ontology (GO) analysis of cluster 10. Visual perception and other photoreceptor related processes (bold) are the most significantly enriched biological processes (adj. p value < 0.01) associated with protein coding genes in cluster 10. G Graph comparing the broadness [in base pairs (bp)] of H3K9ac peaks in each cluster in WT and SCA7 retinas. Comparison WT versus SCA7 of cluster 10 using Mann–Whitney test, p < 0.0001. H–J Graph representing the enrichment per cluster of SCA7 upregulated genes (H), 371 SCA7 downregulated photoreceptor identity genes (I) and 536 other downregulated genes (J). The analysis concerns the distribution of each gene category across all clusters, and bars refer to the ratio of observed versus expected number in each cluster normalized to 1 (dashed red line). The enrichments are 7.1 × more photoreceptor identity genes (I) than expected in cluster 10 (pcluster10 = 5.6 × 10–33, hypergeometric test)
Fig. 6
Fig. 6
Cluster 10 harbors motifs for photoreceptor-specific transcription factors and cell-type specific enhancer features. A Graph showing the enrichment of AME predicted DNA motifs in genomic sequences of cluster 10, compared to sequences in clusters 1–9. These motifs (right panel) are consensual for transcription factors involved in photoreceptor cell fate. Left panel shows the corresponding DNA motif sequences. B Regulatory network composed of transcription factors involved in the development and differentiation of rod photoreceptors. C, D Graphs representing the enrichment of NRL (C) and CRX (D) binding sites in the genomic sequences of each cluster. The analysis concerns the distribution of 605 NRL and 5304 CRX binding sites across all clusters, and bars refer to the ratio of observed versus expected number of binding sites in each cluster normalized to 1 (dashed red line). The enrichment is 11 × more NRL binding sites (pcluster10 = 9.2 × 10–180, hypergeometric test) and 2.4 × more CRX binding sites (pcluster10 = 1.9 × 10–115) in cluster 10 than expected. E Graph representing the enrichment of NRL- and CRX-regulated genes in each cluster. The analysis concerns the distribution of 718 NRL- and 1048 CRX-regulated genes across all clusters, and bars refer to the ratio of observed versus the expected number of genes in each cluster normalized to 1 (dashed red line). F Graph representing the enrichment of ROSE predicted super-enhancer (SE) covering by more than 50% the H3K9ac genomic sequences of each cluster. The analysis concerns the distribution of 268 predicted SE across all clusters, and bars refer to the observed versus expected number of SE in each cluster normalized to 1 (dashed red line). The enrichment is 5 × more SE in cluster 10 than expected (pcluster10 = 4.2 × 10–35, hypergeometric test)
Fig. 7
Fig. 7
mRNAs and associated putative eRNAs expressed at photoreceptor specific gene loci are downregulated in SCA7 homozygous mice. Graphs showing the RT-qPCR analysis of mRNA and associated putative eRNA levels expressed at photoreceptor gene loci in the retina of SCA7140Q/140Q homozygous mice and WT littermates at 12.5 weeks. All mRNAs and annotated putative eRNAs of photoreceptor genes show downregulation in SCA7 retina compared to WT. The non-deregulated Patl1 gene and associated non-deregulated non-coding RNA (based on RNA-seq) were used as control. The non-deregulated Hprt gene which has no associated lncRNA was used as negative, strand specific control. Data are normalized on Rplp0 mRNA expression level, expressed as mean ± SEM (n = 3–6) and analyzed using two-tailed Student’s t-test; *p < 0.05; **p < 0.01; ***p < 0.001

References

    1. Martin JJ, Van Regemorter N, Krols L, Brucher JM, de Barsy T, Szliwowski H, et al. On an autosomal dominant form of retinal-cerebellar degeneration: an autopsy study of five patients in one family. Acta Neuropathol (Berl) 1994;88(4):277–286. doi: 10.1007/BF00310370. - DOI - PubMed
    1. Trottier Y, Lutz Y, Stevanin G, Imbert G, Devys D, Cancel G, et al. Polyglutamine expansion as a pathological epitope in Huntington's disease and four dominant cerebellar ataxias. Nature. 1995;378(6555):403–406. doi: 10.1038/378403a0. - DOI - PubMed
    1. David G, Abbas N, Stevanin G, Durr A, Yvert G, Cancel G, et al. Cloning of the SCA7 gene reveals a highly unstable CAG repeat expansion. Nat Genet. 1997;17(1):65–70. doi: 10.1038/ng0997-65. - DOI - PubMed
    1. Helmlinger D, Tora L. Sharing the SAGA. Trends Biochem Sci. 2017;42(11):850–861. doi: 10.1016/j.tibs.2017.09.001. - DOI - PMC - PubMed
    1. Karmodiya K, Krebs AR, Oulad-Abdelghani M, Kimura H, Tora L. H3K9 and H3K14 acetylation co-occur at many gene regulatory elements, while H3K14ac marks a subset of inactive inducible promoters in mouse embryonic stem cells. BMC Genomics. 2012;13:424. doi: 10.1186/1471-2164-13-424. - DOI - PMC - PubMed