

Transcriptomic Signatures of Human Immunodeficiency Virus Post-Treatment Control
- PMID: 36541802
- PMCID: PMC9888280
- DOI: 10.1128/jvi.01254-22
Transcriptomic Signatures of Human Immunodeficiency Virus Post-Treatment Control
Abstract
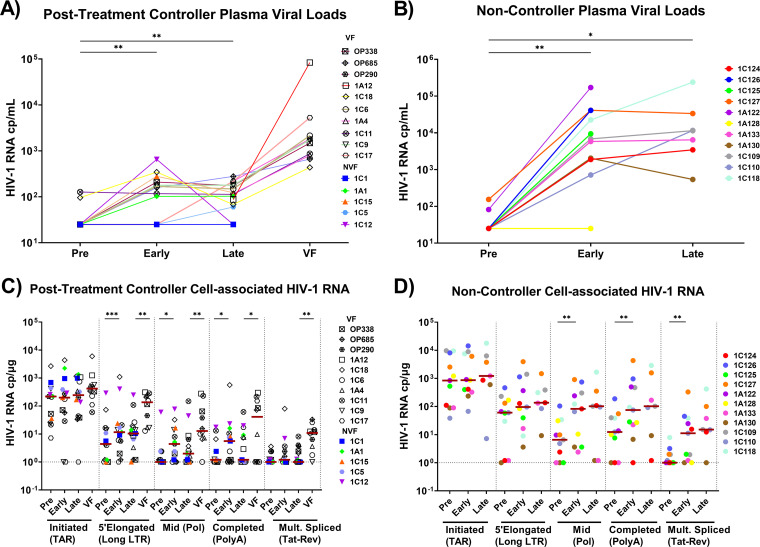
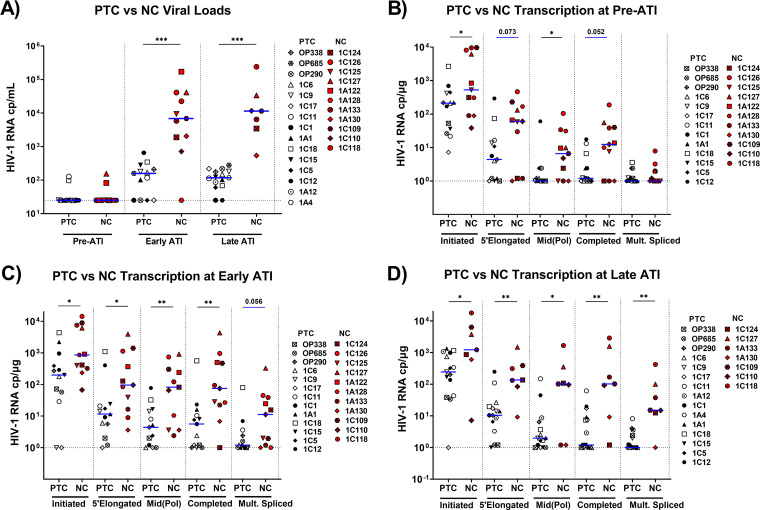
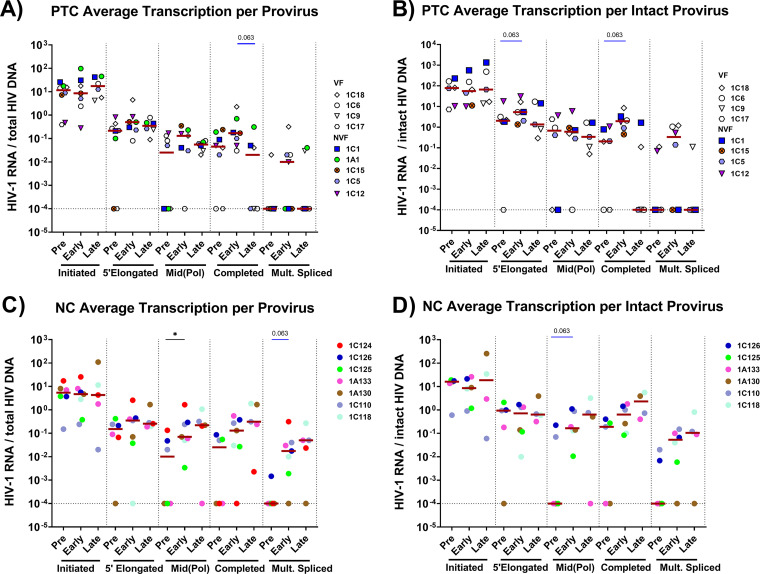
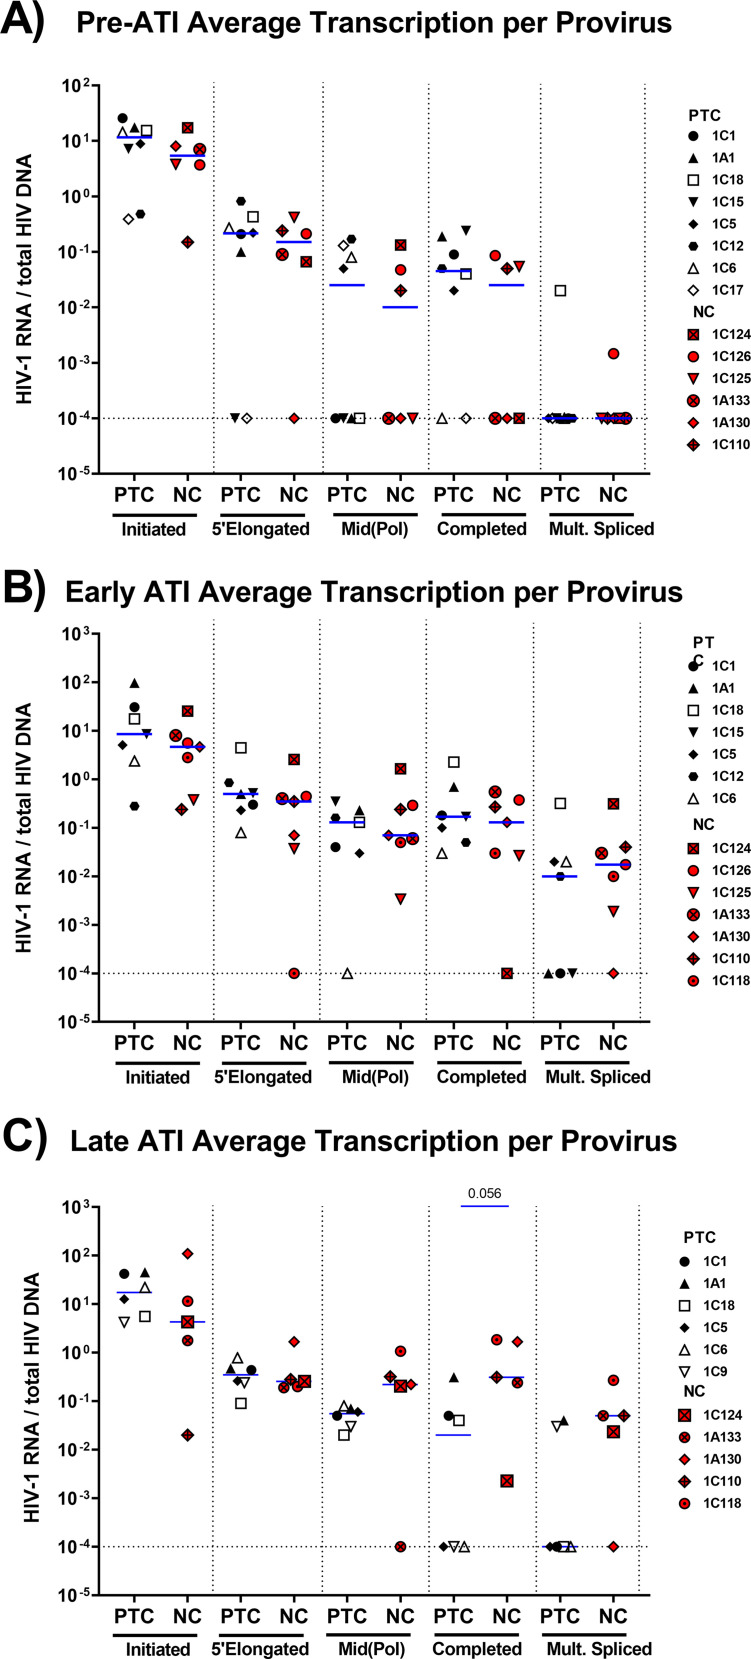
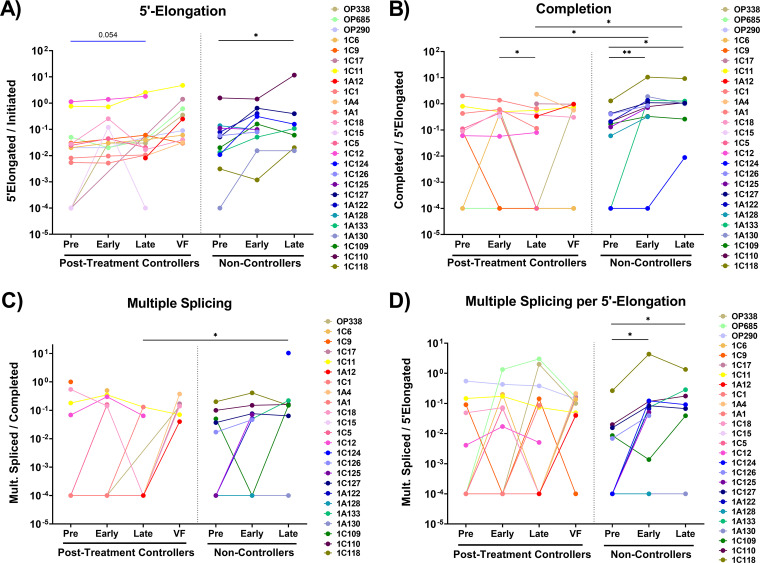
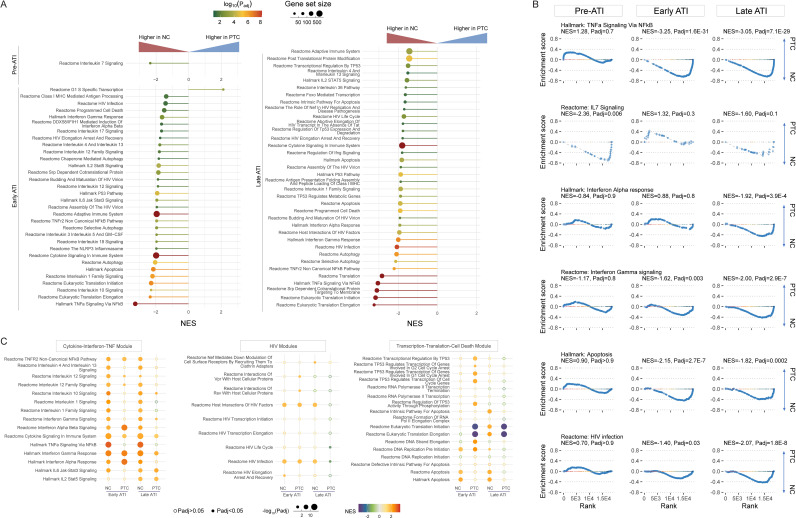
Posttreatment controllers (PTCs) are rare HIV-infected individuals who can limit viral rebound after antiretroviral therapy interruption (ATI), but the mechanisms of this remain unclear. To investigate these mechanisms, we quantified various HIV RNA transcripts (via reverse transcription droplet digital PCR [RT-ddPCR]) and cellular transcriptomes (via RNA-seq) in blood cells from PTCs and noncontrollers (NCs) before and two time points after ATI. HIV transcription initiation did not significantly increase after ATI in PTCs or in NCs, whereas completed HIV transcripts increased at early ATI in both groups and multiply-spliced HIV transcripts increased only in NCs. Compared to NCs, PTCs showed lower levels of HIV DNA, more cell-associated HIV transcripts per total RNA at all times, no increase in multiply-spliced HIV RNA at early or late ATI, and a reduction in the ratio of completed/elongated HIV RNA after early ATI. NCs expressed higher levels of the IL-7 pathway before ATI and expressed higher levels of multiple cytokine, inflammation, HIV transcription, and cell death pathways after ATI. Compared to the baseline, the NCs upregulated interferon and cytokine (especially TNF) pathways during early and late ATI, whereas PTCs upregulated interferon and p53 pathways only at early ATI and downregulated gene translation during early and late ATI. In NCs, viral rebound after ATI is associated with increases in HIV transcriptional completion and splicing, rather than initiation. Differences in HIV and cellular transcription may contribute to posttreatment control, including an early limitation of spliced HIV RNA, a delayed reduction in completed HIV transcripts, and the differential expression of the IL-7, p53, and TNF pathways. IMPORTANCE The findings presented here provide new insights into how HIV and cellular gene expression change after stopping ART in both noncontrollers and posttreatment controllers. Posttreatment control is associated with an early ability to limit increases in multiply-spliced HIV RNA, a delayed (and presumably immune-mediated) ability to reverse an initial rise in processive/completed HIV transcripts, and multiple differences in cellular gene expression pathways. These differences may represent correlates or mechanisms of posttreatment control and may provide insight into the development and/or monitoring of therapeutic strategies that are aimed at a functional HIV cure.
Keywords: ART; HIV DNA; HIV posttreatment controllers; RNA splicing; analytic treatment interruption; cell-mediated immune response; human immunodeficiency virus; noncontrollers; splicing; transcription; transcriptional completion; transcriptional profile; treatment interruption; viremic suppression.
Conflict of interest statement
The authors declare no conflict of interest.
Figures
References
-
- Hocqueloux L, Prazuck T, Avettand-Fenoel V, Lafeuillade A, Cardon B, Viard JP, Rouzioux C. 2010. Long-term immunovirologic control following antiretroviral therapy interruption in patients treated at the time of primary HIV-1 infection. AIDS 24:1598–1601. 10.1097/qad.0b013e32833b61ba. - DOI - PubMed
-
- Salgado M, Rabi SA, O'Connell KA, Buckheit RW, 3rd, Bailey JR, Chaudhry AA, Breaud AR, Marzinke MA, Clarke W, Margolick JB, Siliciano RF, Blankson JN. 2011. Prolonged control of replication-competent dual- tropic human immunodeficiency virus-1 following cessation of highly active antiretroviral therapy. Retrovirology 8:97. 10.1186/1742-4690-8-97. - DOI - PMC - PubMed
-
- Goujard C, Girault I, Rouzioux C, Lecuroux C, Deveau C, Chaix ML, Jacomet C, Talamali A, Delfraissy JF, Venet A, Meyer L, Sinet M, Group ACPS . 2012. HIV-1 control after transient antiretroviral treatment initiated in primary infection: role of patient characteristics and effect of therapy. Antivir Ther 17:1001–1009. 10.3851/IMP2273. - DOI - PubMed
-
- Fidler S, Porter K, Ewings F, Frater J, Ramjee G, Cooper D, Rees H, Fisher M, Schechter M, Kaleebu P, Tambussi G, Kinloch S, Miro JM, Kelleher A, McClure M, Kaye S, Gabriel M, Phillips R, Weber J, Babiker A, SPARTAC Trial Investigators . 2013. Short-course antiretroviral therapy in primary HIV infection. N Engl J Med 368:207–217. 10.1056/NEJMoa1110039. - DOI - PMC - PubMed
-
- Saez-Cirion A, Bacchus C, Hocqueloux L, Avettand-Fenoel V, Girault I, Lecuroux C, Potard V, Versmisse P, Melard A, Prazuck T, Descours B, Guergnon J, Viard JP, Boufassa F, Lambotte O, Goujard C, Meyer L, Costagliola D, Venet A, Pancino G, Autran B, Rouzioux C, Group AVS, ANRS VISCONTI Study Group . 2013. Post-treatment HIV-1 controllers with a long-term virological remission after the interruption of early initiated antiretroviral therapy ANRS VISCONTI Study. PLoS Pathog 9:e1003211. 10.1371/journal.ppat.1003211. - DOI - PMC - PubMed
Publication types
MeSH terms
Substances
Grants and funding
LinkOut - more resources
Full Text Sources
Medical
Research Materials
Miscellaneous
