

Intra- and inter-operator variability in MRI-based manual segmentation of HCC lesions and its impact on dosimetry
- PMID: 36542239
- PMCID: PMC9772368
- DOI: 10.1186/s40658-022-00515-6
Intra- and inter-operator variability in MRI-based manual segmentation of HCC lesions and its impact on dosimetry
Abstract
Purpose: The aim was to quantify inter- and intra-observer variability in manually delineated hepatocellular carcinoma (HCC) lesion contours and the resulting impact on radioembolization (RE) dosimetry.
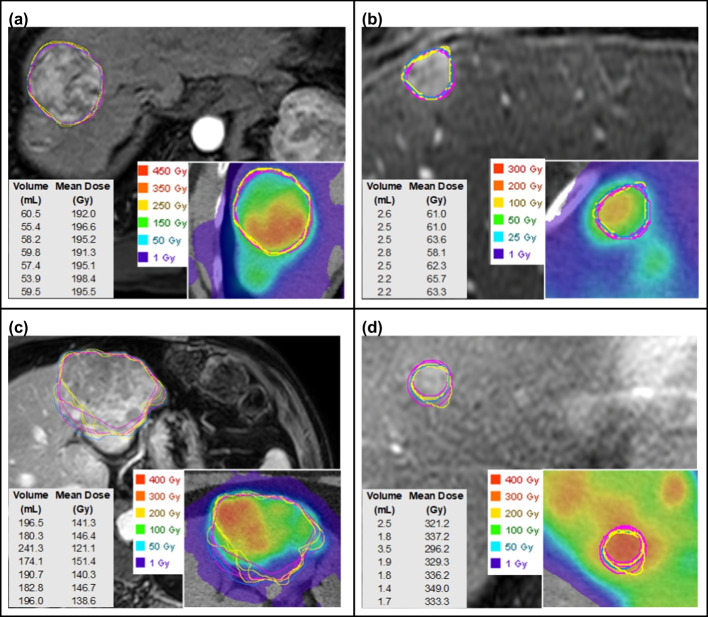
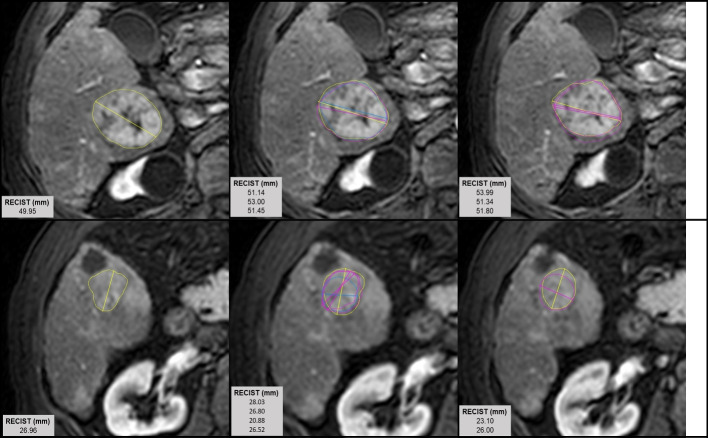
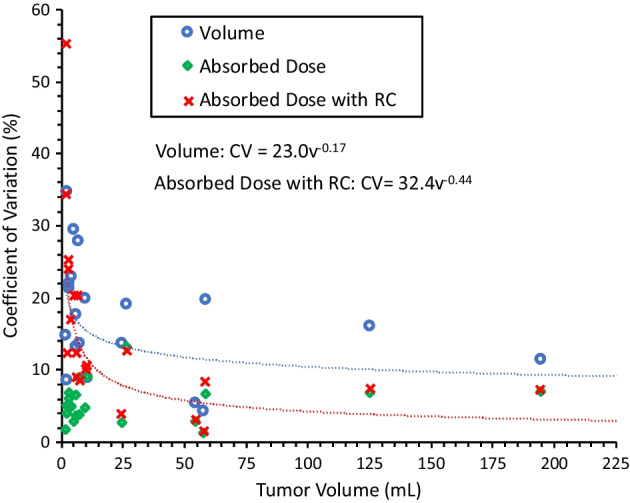
Methods: Ten patients with HCC lesions treated with Y-90 RE and imaged with post-therapy Y-90 PET/CT were selected for retrospective analysis. Three radiologists contoured 20 lesions manually on baseline multiphase contrast-enhanced MRIs, and two of the radiologists re-contoured at two additional sessions. Contours were transferred to co-registered PET/CT-based Y-90 dose maps. Volume-dependent recovery coefficients were applied for partial volume correction (PVC) when reporting mean absorbed dose. To understand how uncertainty varies with tumor size, we fit power models regressing relative uncertainty in volume and in mean absorbed dose on contour volume. Finally, we determined effects of segmentation uncertainty on tumor control probability (TCP), as calculated using logistic models developed in a previous RE study.
Results: The average lesion volume ranged from 1.8 to 194.5 mL, and the mean absorbed dose ranged from 23.4 to 1629.0 Gy. The mean inter-observer Dice coefficient for lesion contours was significantly less than the mean intra-observer Dice coefficient (0.79 vs. 0.85, p < 0.001). Uncertainty in segmented volume, as measured by the Coefficient of Variation (CV), ranged from 4.2 to 34.7% with an average of 17.2%. The CV in mean absorbed dose had an average value of 5.4% (range 1.2-13.1%) without PVC while it was 15.1% (range 1.5-55.2%) with PVC. Using the fitted models for uncertainty as a function of volume on our prior data, the mean change in TCP due to segmentation uncertainty alone was estimated as 16.2% (maximum 48.5%).
Conclusions: Though we find relatively high inter- and intra-observer reliability overall, uncertainty in tumor contouring propagates into non-negligible uncertainty in dose metrics and outcome prediction for individual cases that should be considered in dosimetry-guided treatment.
Keywords: Dosimetry; Observer studies; Radioembolization; Radionuclide therapy; Segmentation; Uncertainty analysis.
© 2022. The Author(s).
Conflict of interest statement
Yuni Dewaraja is a consultant for MIM Software. All the other authors have no conflicts of interest related to the present paper to disclose.
Figures


References
-
- Garin E, Tselikas L, Guiu B, et al. Personalized versus standard dosimetry approach of selective internal radiation therapy in patients with locally advanced hepatocellular carcinoma (DOSISPHERE-01): a randomized, multicentre, open-label phase 2 trial. Lancet Gastroenterol Hepatol. 2021;6(1):17–29.2. doi: 10.1016/S2468-1253(20)30290-9. - DOI - PubMed
Grants and funding
LinkOut - more resources
Full Text Sources
