. 2023 May 15;34(6):ar52.
doi: 10.1091/mbc.E22-09-0444. Epub 2022 Dec 21.

Role of intraflagellar transport in transcriptional control during flagellar regeneration in Chlamydomonas

Affiliations

Role of intraflagellar transport in transcriptional control during flagellar regeneration in Chlamydomonas

Karina Perlaza et al. Mol Biol Cell. .

Abstract

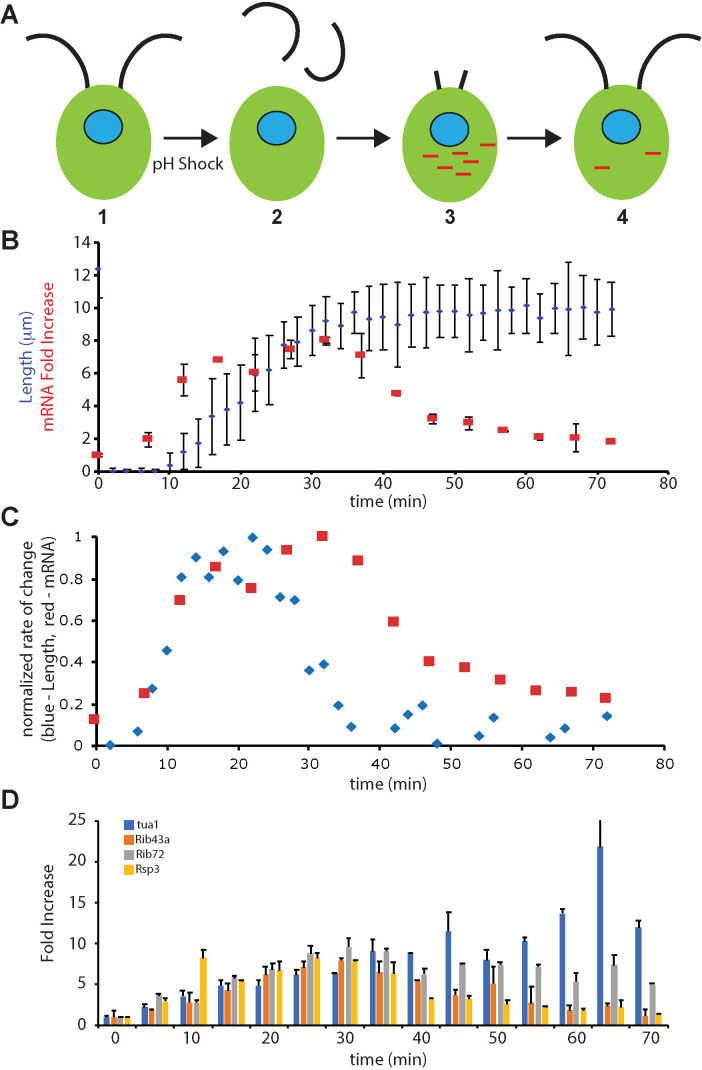
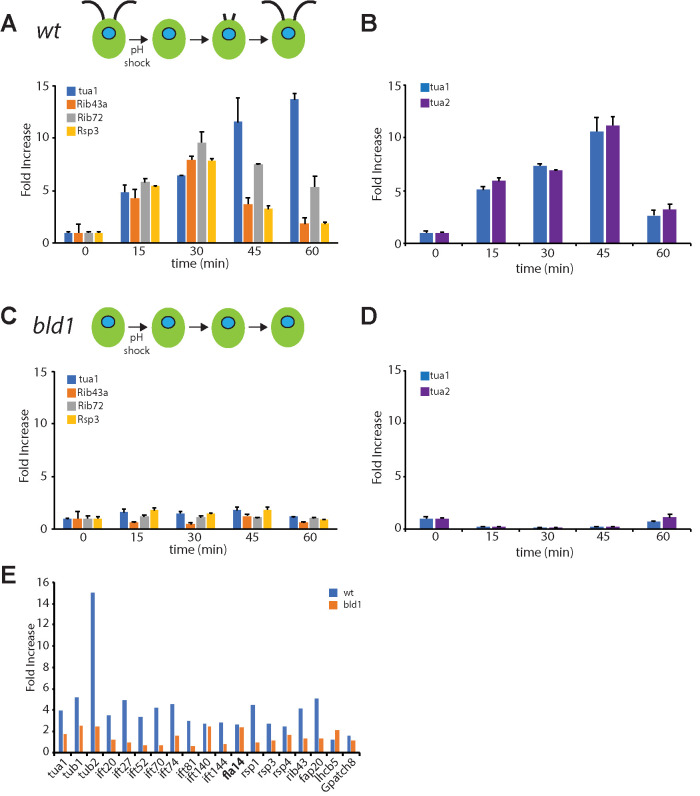
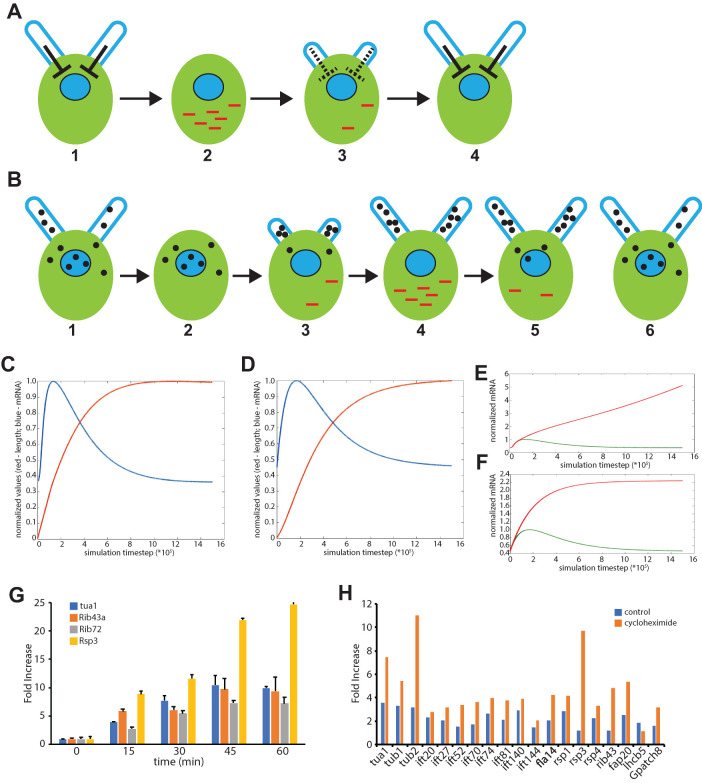
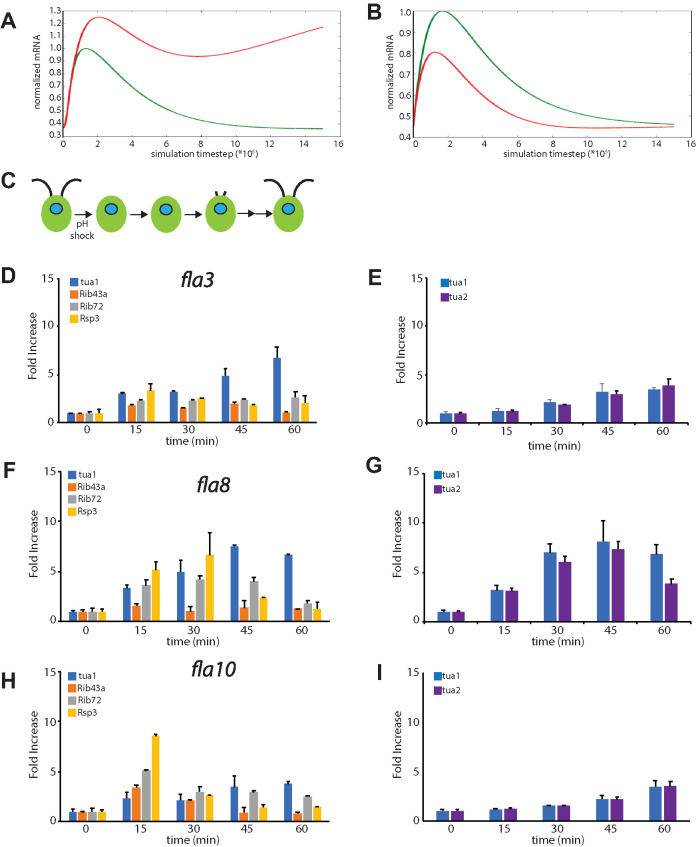
Biosynthesis of organelle precursors is a central part of the organelle size control problem, but what systems are required to control precursor production? Genes encoding flagellar proteins are up-regulated during flagellar regeneration in Chlamydomonas, and this up-regulation is critical for flagella to reach their final length, but it not known how the cell triggers these genes during regeneration. We present two models based on transcriptional repressor that is produced either in the flagellum or in the cell body and sequestered in the growing flagellum. Both models lead to stable flagellar length control and can reproduce the observed dynamics of gene expression. The two models make opposite predictions regarding the effect of mutations that block intraflagellar transport (IFT). Using quantitative measurements of gene expression, we show that gene expression during flagellar regeneration is greatly reduced in mutations of the heterotrimeric kinesin-2 that drives IFT. This result is consistent with the predictions of the model in which a repressor is sequestered in the flagellum by IFT. Inhibiting axonemal assembly has a much smaller effect on gene expression. The repressor sequestration model allows precursor production to occur when flagella are growing rapidly, representing a form of derivative control.


Figures

FIGURE 1:
FIGURE 1:
Transcriptional dynamics of flagella-related genes relative to flagellar growth. (A) Flagellar regeneration following pH shock. (1) During normal growth, Chlamydomonas cells have two full-length flagella and transcription of flagella-related genes is at basal levels. (2) Transient pH shock causes flagella to detach. (3) As flagella begin to regrow, genes encoding flagellar proteins in the nucleus (blue) are transcribed, leading to accumulation of mRNA (red). (4) As flagella reach final length, transcription returns to basal levels. (B) Flagellar length (blue) and fold induction of RSP3, a flagella-related gene (red), based on qPCR, as a function of time after pH shock. Error bars are SEM for flagellar length and SD between biological replicates for qPCR. (C) Fold induction of RSP3 (red) plotted along with flagellar growth rate (blue) based on the data of panel B. Both quantities were normalized to their maximum values. (D) Time course of expression of four flagella-related genes during regeneration based on qPCR. All four genes show a parallel increase up to the peak of expression at 30 min.
FIGURE 2:
FIGURE 2:
Flagellar gene expression is not triggered by pH shock. (A) Expression of tubulin (tua1), Rib43, Rib72, and Rsp3, in wild-type cells at four time points during regeneration analyzed by qPCR, taken from Figure 1C. (B) Expression of two tubulin genes during regeneration at the same time points as in panel A, from a separate experiment analyzed by qPCR. (C) Expression of flagella-related genes following pH shock in the bld1 mutant, which lacks flagella. Compared to panel A, expression is drastically reduced and is comparable to basal levels at the t = 0 time point. (D) Expression of tubulin genes following pH shock in bld1 mutants, again showing failure to induce expression. (E) Expression of a panel of flagella-related genes measured 30 min after pH shock by Nanostring detection. Blue, wild-type cells; orange, bld1 mutants. Lhcb5 and gpatch8 are nonflagellar genes included as controls.
FIGURE 3:
FIGURE 3:
Models for regulation of flagellar genes. (A) Repressor production model in which a repressive signal, indicated by the bar-end arrows, is produced within the flagellum proportional to the current flagellar length. Panel 1 depicts the situation in cells with full-length flagella. In this case, the flagella produce a repressor that keeps gene expression of flagellar genes turned off. (2) When flagella are removed, the repressive signal produced by the flagella is eliminated, leading to an increase in gene expression. (3) As flagella begin to grow back, the repressive signal starts to be produced, leading to a gradual reduction in transcription. (4) When flagella reach full length, the repressive signal is maximal, leading to minimal gene expression. Overall, this sequence of events should lead to a pulse in gene expression that coincides with the early stages of flagellar regrowth. (B) Repressor sequestration model in which a repressor is synthesized in the cell body and transported into growing flagella by IFT. (1) In cells with full-length flagella, the repressor is found in both the flagellum and the cell body. The repressor molecules in the cell body keep gene expression at a basal level. (2) When flagella are removed, there is no immediate gene expression because repressor is still present in the cell body. (3) As flagella start to regrow using the existing pool of precursor protein, repressor starts to be imported into the growing flagella, leading to a drop in repressor concentration in the cell body. This leads to an increase in gene expression. (4) As flagella grow, more and more repressor is imported into the flagella, leading to a further increase in gene expression. Among the genes expressed is that encoding the repressor itself. (5) As flagellar growth decelerates, import of repressor into the flagella slows down due to the 1/L dependence of IFT mediated trafficking. This slowdown in import, combined with the expression of the repressor gene itself, leads to an increase in repressor concentration inside the cell body, which begins to reduce gene expression. (6) By the time flagella reach full length, repressor has accumulated back to its preshock concentration inside the cell body, causing gene expression to drop back to basal levels. As with the repressor production model, this repressor sequestration model should be able to produce a pulse of gene expression. (C) Numerical simulation of flagellar regeneration based on the repressor production model, Eqs. A1–A4. Blue lines, predicted mRNA levels as a function of time. Red lines, predicted flagellar length as a function of time. Both flagellar length and mRNA levels are plotted normalized to their maximum value in each simulation. (D) Numerical simulation of flagellar regeneration based on repressor sequestration model, Eqs. B4–B6. (E, F) Simulations of flagellar regeneration in the absence of protein synthesis based on the repressor production (E) or sequestration (F) models. In the repressor production model, mRNA levels continue to increase because the flagellum does not reach full length and thus cannot establish full production of repressor. In the repressor sequestration model, mRNA levels continue to increase because repressor protein is not synthesized. (G) Expression of flagella-related genes in cycloheximide-treated cells as a function of time after pH shock, measured by qPCR, showing increased expression levels at later time points. (H) Quantification of flagella-related genes 140 min after pH shock by Nanostring detection, showing sustained increased gene expression in the presence of cycloheximide. The nonflagellar control genes do not show this effect.
FIGURE 4:
FIGURE 4:
IFT mutants reduce up-regulation of flagella-related genes. (A) Prediction of the effect of reduced IFT in the repressor production model in which a repressor is generated in the flagella proportional to flagellar length. Simulation shows mRNA levels using parameters from the plot in Figure 3C (green) with a second plot showing mRNA levels when the efficiency of IFT is reduced fourfold (red). Reduction in IFT leads to an increase in peak mRNA levels. (B) Prediction of the effect of reduced IFT in the repressor sequestration model in which a repressor is generated in the cell body and then sequestered in flagella by IFT-mediated import. Simulation shows mRNA levels using parameters from the plot in Figure 3D (green) with a second plot showing mRNA levels when the efficiency of IFT is reduced fourfold (red). In contrast to the repressor production model, in the repressor sequestration model reduction in IFT leads to a decrease in peak mRNA levels. (C) Phenotype of conditional IFT mutants grown at the permissive temperature, as exemplified by the fla3 mutant. Cells have normal-length flagella but show a prolonged delay in regeneration due to a defect in IFT. (D) Flagella-related gene expression following pH shock in fla3 mutant quantified by qPCR. (E) Expression of tubulin genes following pH shock in fla3 mutant. (F) Flagella-related gene expression following pH shock in fla8 mutant quantified by qPCR. (G) Expression of tubulin genes following pH shock in fla8 mutant. (H) Flagella-related gene expression following pH shock in fla10 mutant quantified by qPCR. (I) Expression of tubulin genes following pH shock in the fla10 mutant.
FIGURE 5:
FIGURE 5:
Effect of microtubule inhibitors on flagella-related gene expression after pH shock. (A, B) Effect of 3.5 μM oryzalin on gene expression as judged by qPCR. Graphs represent two independent experiments. (C, D) Effect of 3.5 μM oryzalin on gene expression after pH shock quantified by Nanostring detection. Panels C and D represent expression 30 and 45 min after deflagellation, respectively.

Similar articles

Cited by

References

    1. Adams GMW, Huang B, Luck DJ (1982). Temperature-sensitive assembly-defective flagella mutants of Chlamydomonas reinhardtii. Genetics 100, 579–586. - PMC - PubMed
    1. Albee AJ, Kwan AL, Lin H, Granas D, Stormo GD, Dutcher SK (2013). Identification of cilia genes that affect cell-cycle progression using whole-genome transcriptome analysis in Chlamydomonas reinhardtii. G3 (Bethesda) 3, 979–391. - PMC - PubMed
    1. Baker EJ, Keller LR, Schloss JA, Rosenbaum JL (1986). Protein synthesis is required for rapid degradation of tubulin mRNA and other deflagellation-induced RNAs in Chlamydomonas reinhardtii. Mol Cell Biol 6, 54–61. - PMC - PubMed
    1. Baker EJ, Schloss JA, Rosenbaum JL (1984). Rapid changes in tubulin RNA synthesis and stability induced by deflagellation in Chlamydomonas. J Cell Biol 99, 2074–2081. - PMC - PubMed
    1. Bhogaraju S, Cajanek L, Fort C, Blisnick T, Weber K, Taschner M, Mizuno N, Lamla S, Bastin P, Nigg EA, Lorentzen E (2013). Molecular basis of tubulin transport within the cilium by IFT74 and IFT81. Science 341, 1009–1012. - PMC - PubMed

Publication types

MeSH terms