. 2022 Dec 21;17(12):e0278837.
doi: 10.1371/journal.pone.0278837. eCollection 2022.

A modelling approach to hepatic glucose production estimation

Affiliations

A modelling approach to hepatic glucose production estimation

Simona Panunzi et al. PLoS One. .

Abstract

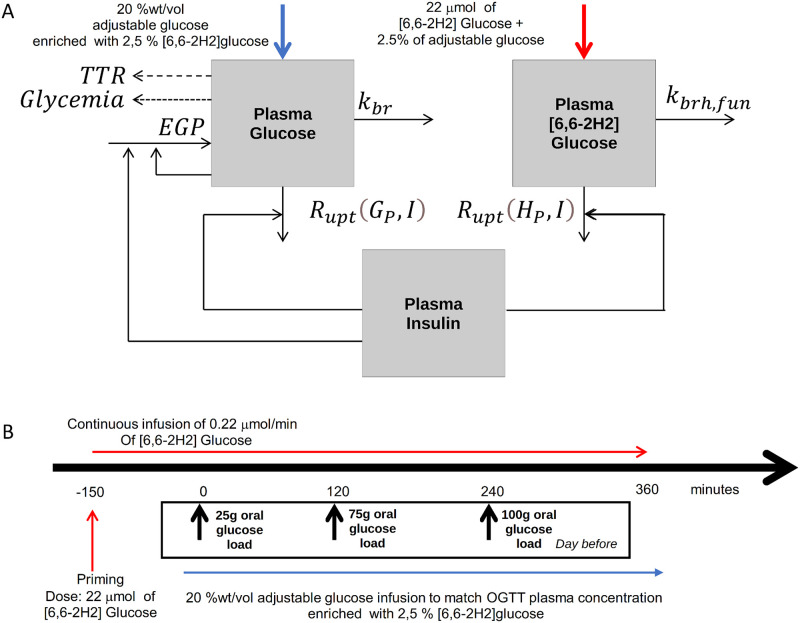
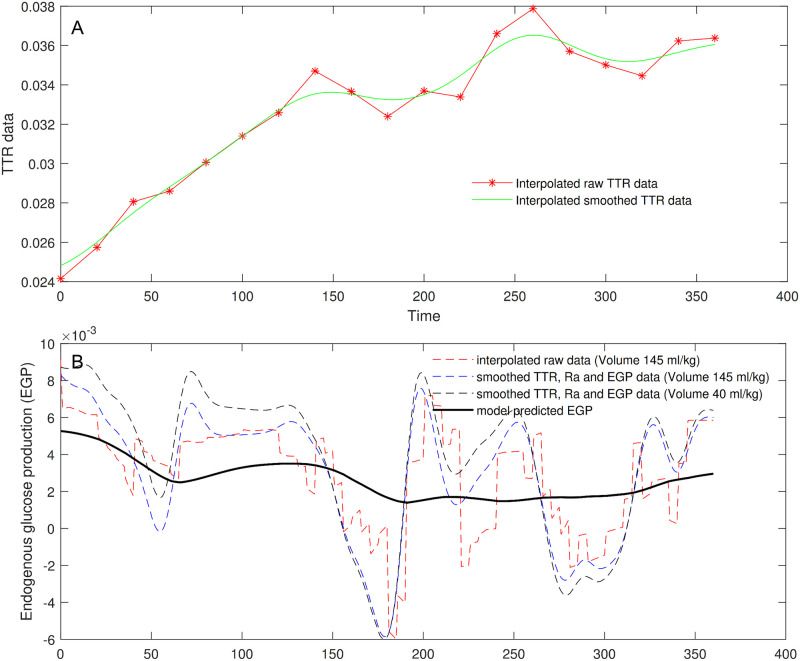
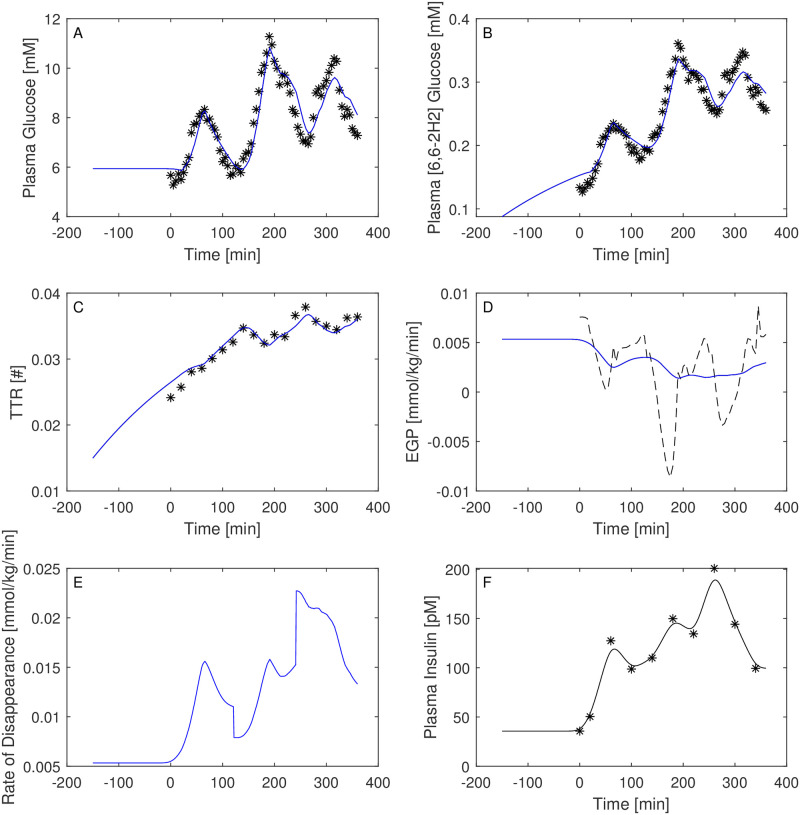
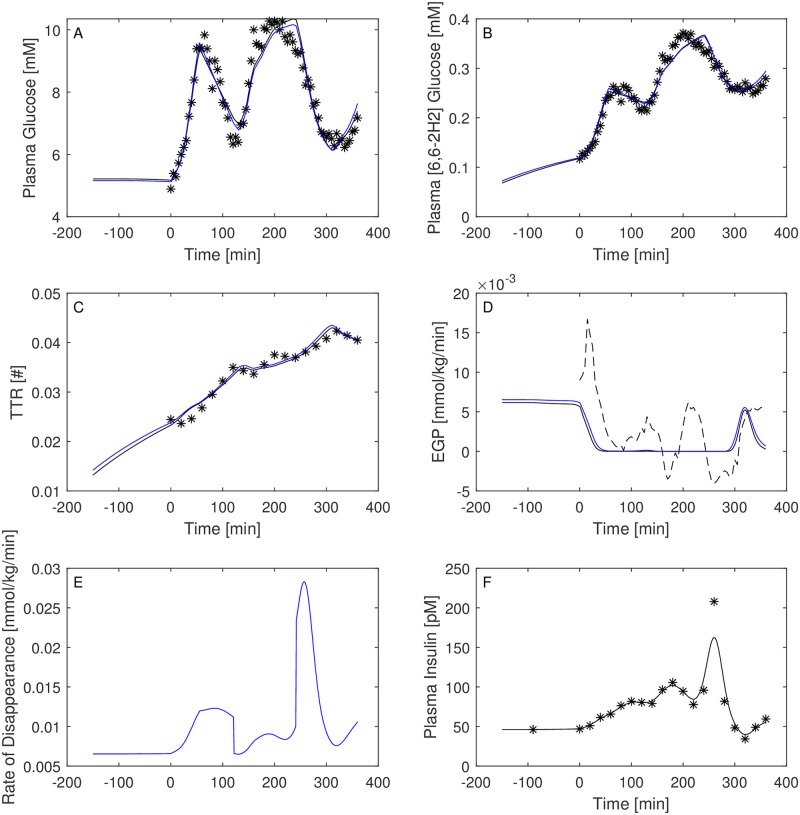
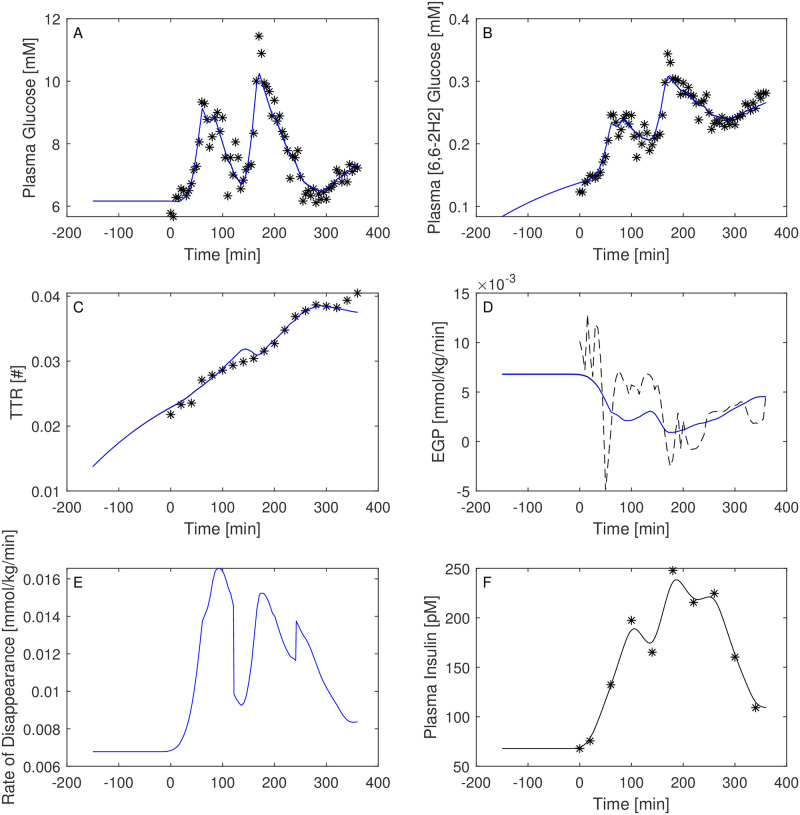
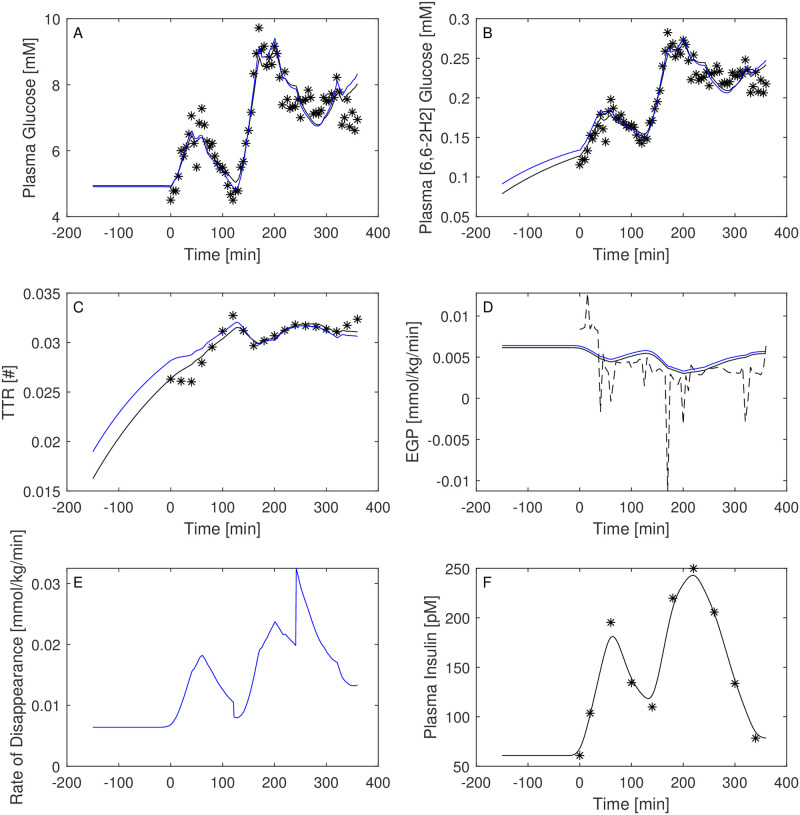
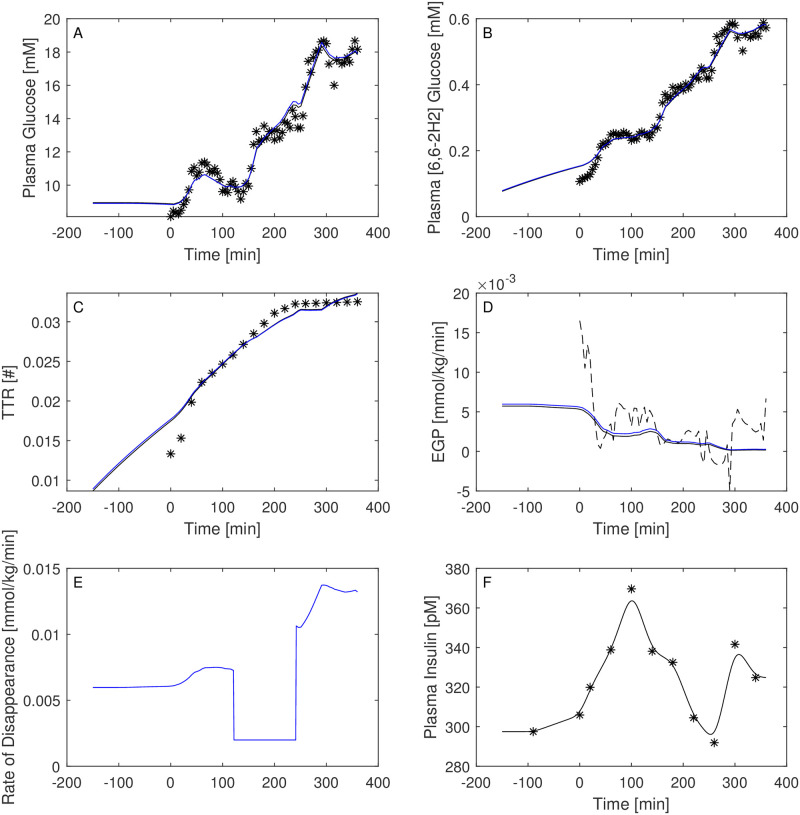
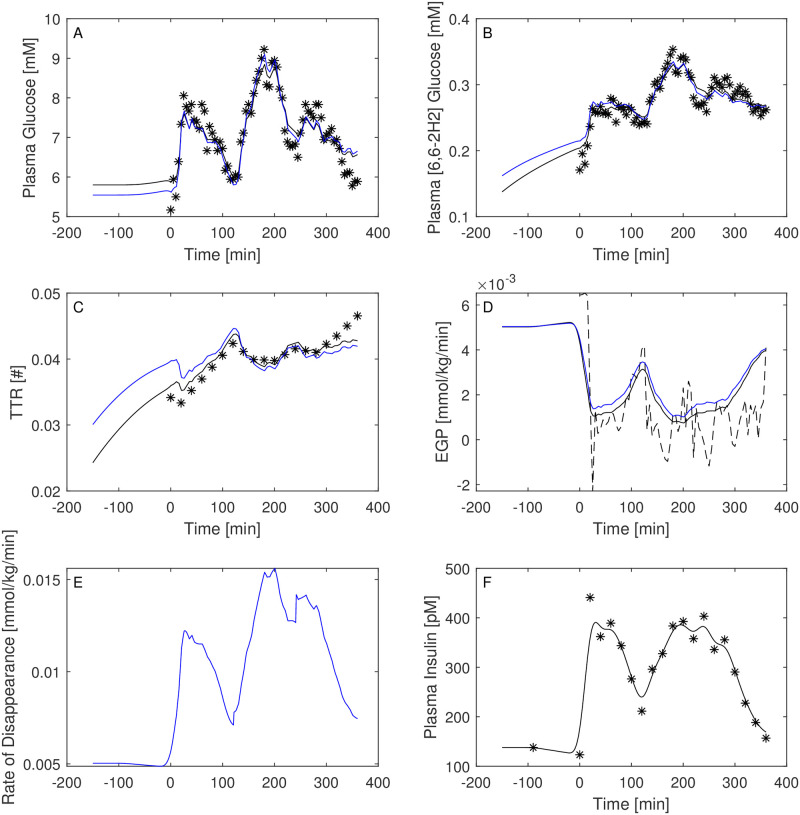
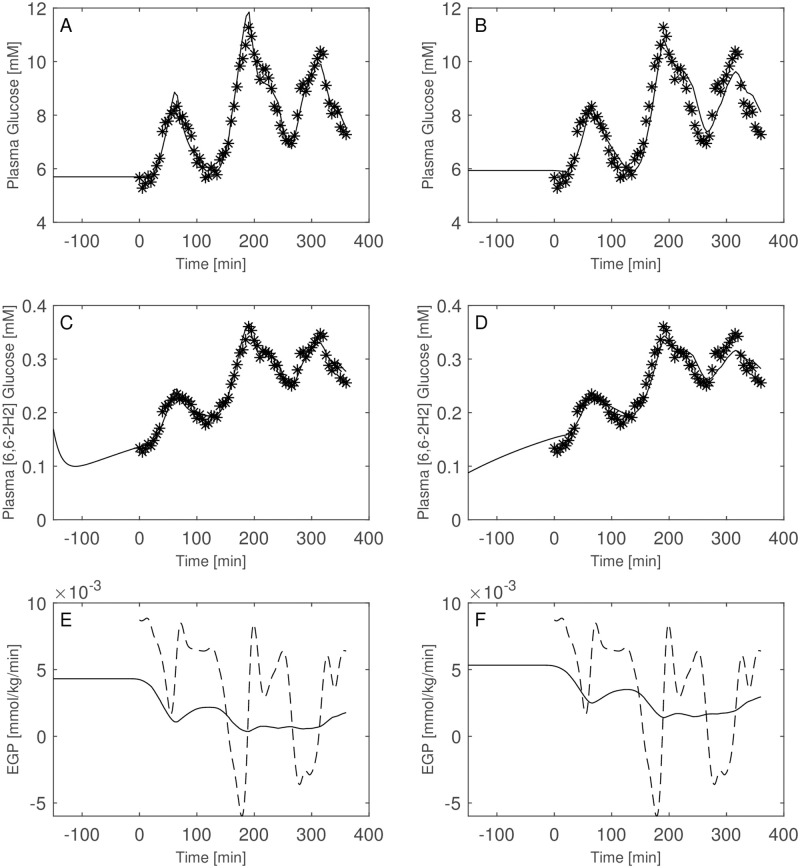
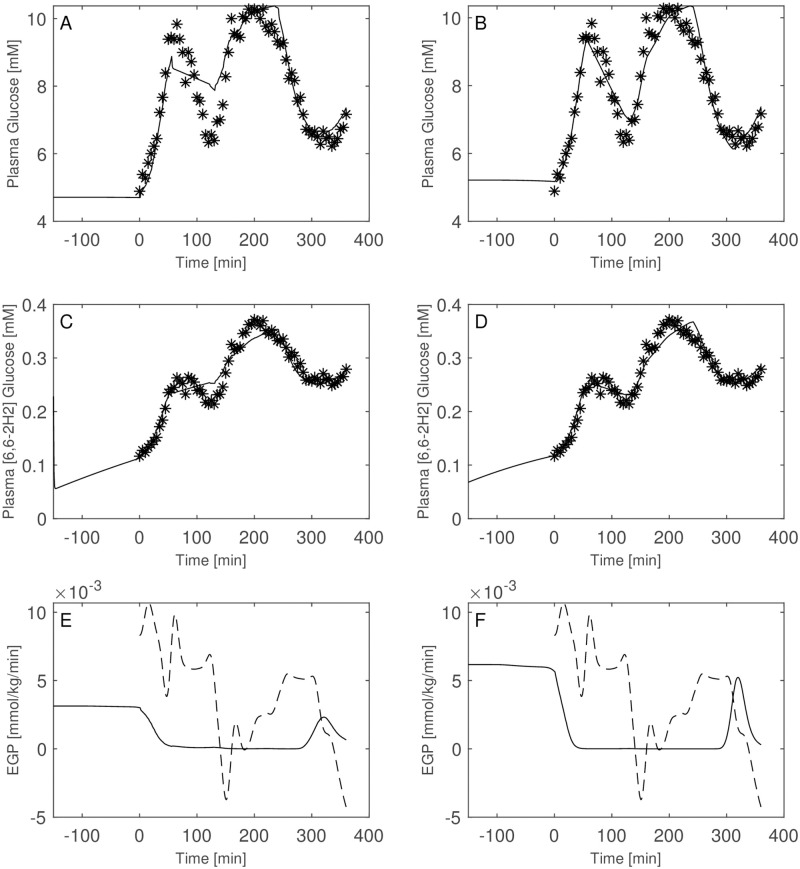
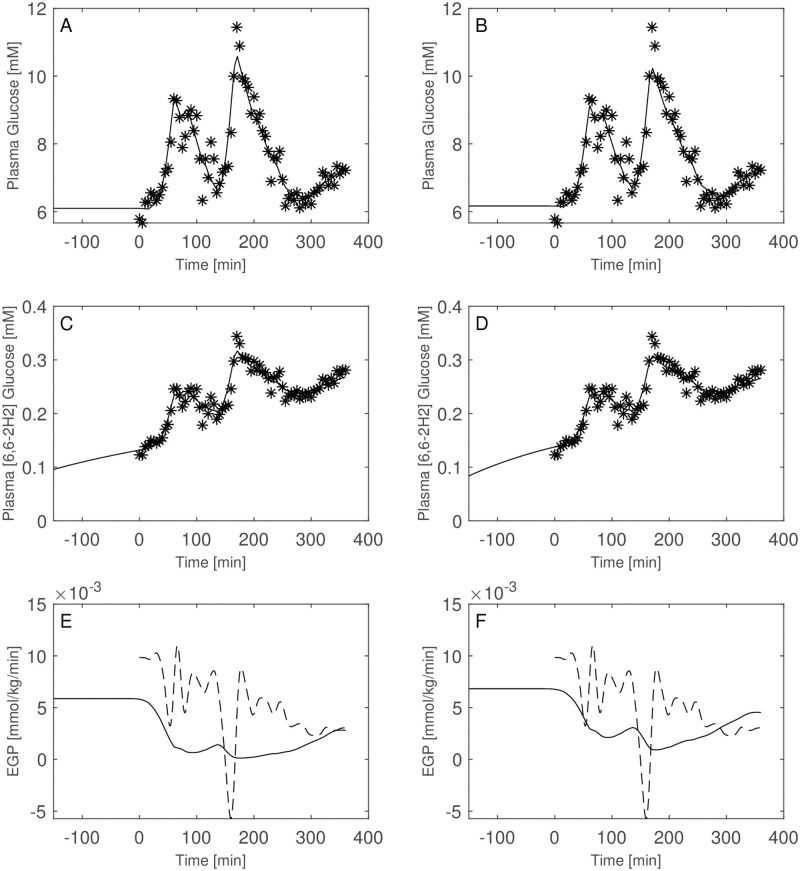
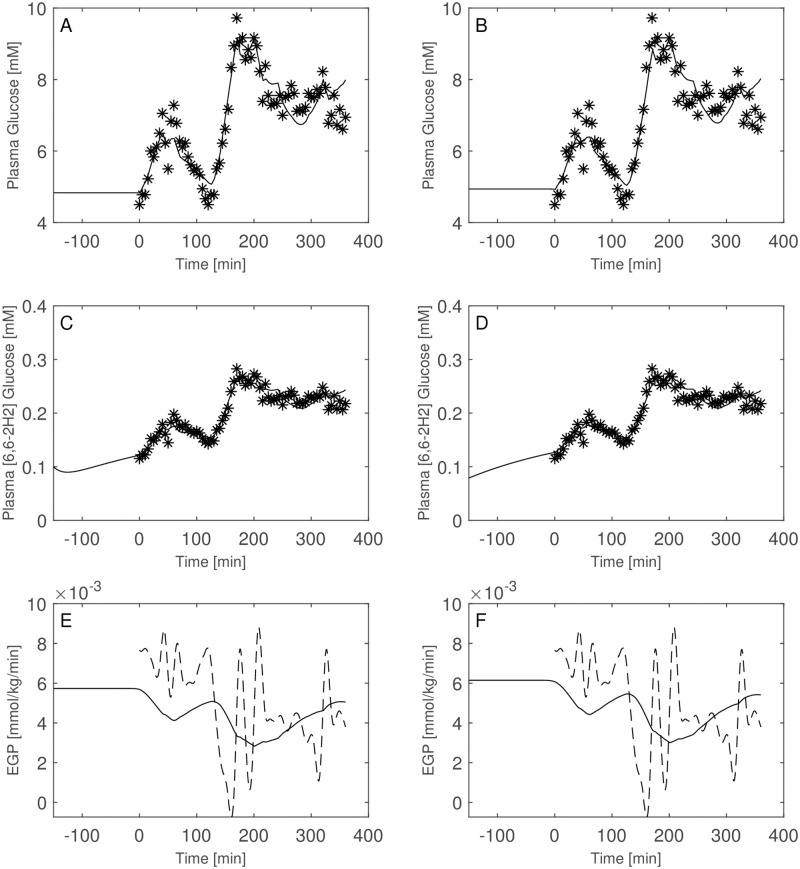
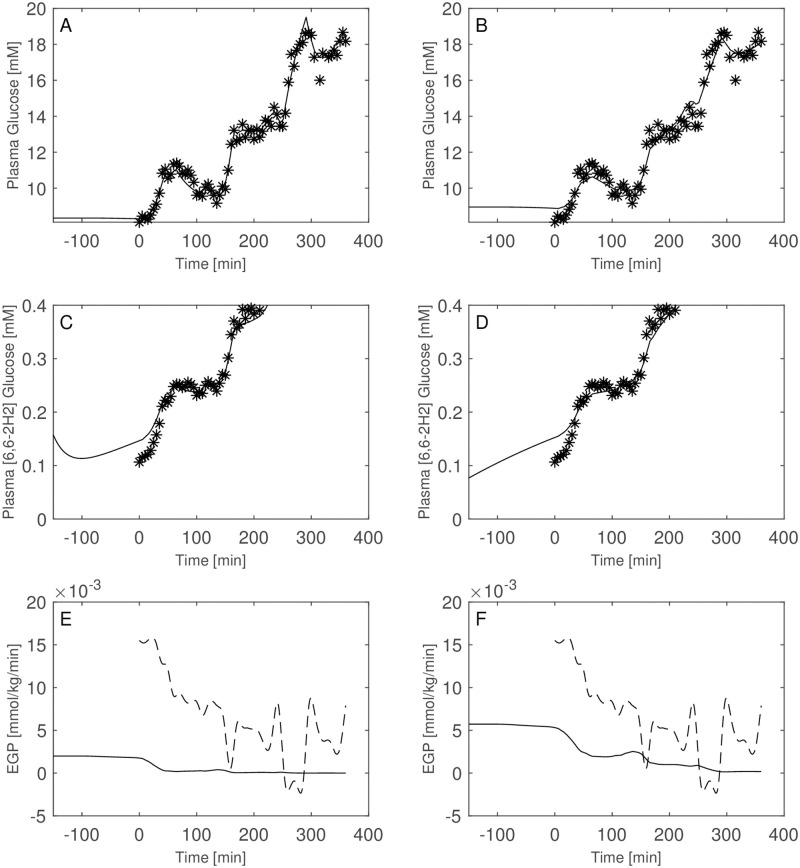
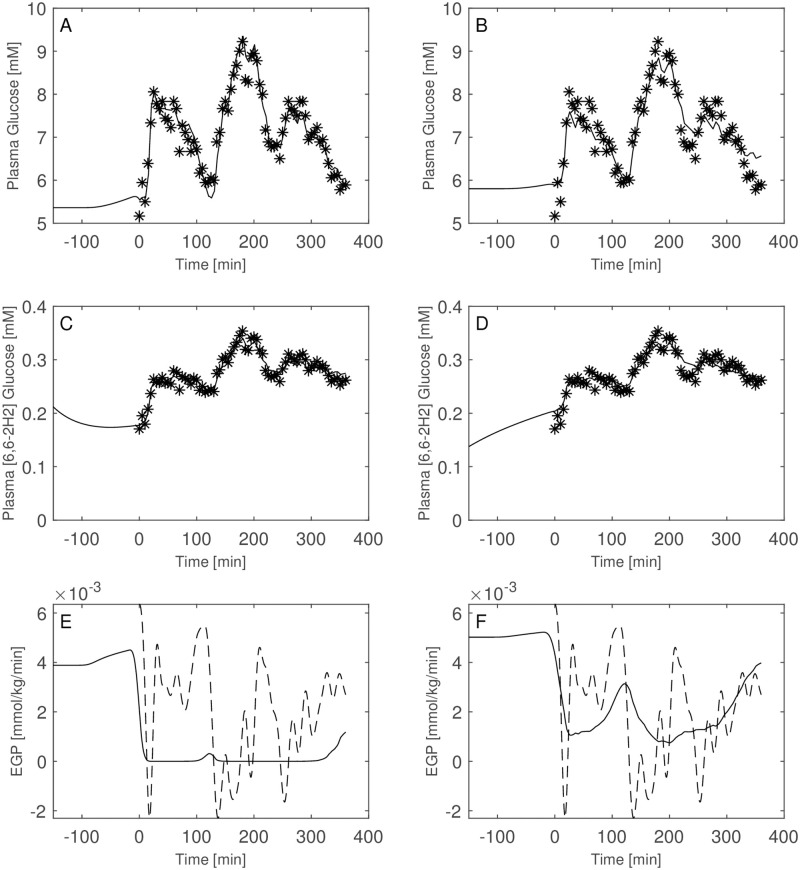
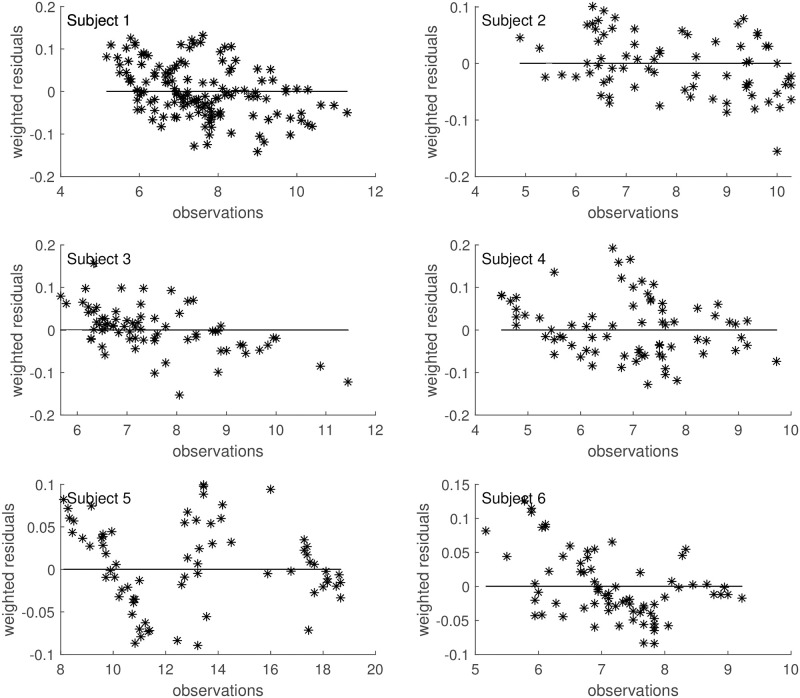
Stable isotopes are currently used to measure glucose fluxes responsible for observed glucose concentrations, providing information on hepatic and peripheral insulin sensitivity. The determination of glucose turnover, along with fasting and postprandial glucose concentrations, is relevant for inferring insulin sensitivity levels. At equilibrium (e.g. during the fasting state) the rate of glucose entering the circulation equals its rate of disappearance from the circulation. If under these conditions tracer is infused at a constant rate and Specific Activity (SA) or Tracer to Tracee (TTR) ratio is computed, the Rate of Appearance (RA) equals the Rate of Disappearance (RD) and equals the ratio between infusion rate and TTR or SA. In the post-prandial situation or during perturbation studies, however, estimation of RA and RD becomes more complex because they are not necessarily equal and, furthermore, may vary over time due to gastric emptying, glucose absorption, appearance of ingested or infused glucose, variations of EGP and glucose disappearance. Up to now, the most commonly used approach to compute RA, RD and EGP has been the single-pool model by Steele. Several authors, however, report pitfalls in the use of this method, such as "paradoxical" increase in EGP immediately after meal ingestion and "negative" rates of EGP. Different attempts have been made to reduce the impact of these errors, but the same problems are still encountered. In the present work a completely different approach is proposed, where cold and labeled [6, 6-2H2] glucose observations are simultaneously fitted and where both RD and EGP are represented by simple but reasonable functions. As an example, this approach is applied to an intra-venous experiment, where cold glucose is infused at variable rates to reproduce a desired glycaemic time-course. The goal of the present work is to show that appropriate, if simple, modelling of the whole infusion procedure together with the underlying physiological system allows robust estimation of EGP with single-tracer administration, without the artefacts produced by the Steele method.


Conflict of interest statement

The authors have declared that no competing interests exist.

Figures

Fig 1
Fig 1. Block diagram.
Schematic representation of both the one-compartment glucose model (panel A) and the whole experimental procedure (panel B). The schematic representation of the model summarizes the intravenous procedure performed on day 2.
Fig 2
Fig 2. Endogenous glucose production.
TTR data (Panel A), only interpolated (dashed red line) and smoothed (continuous green line); EGP computation from the equation of Steele in case TTR data are smoothed and in case they are only interpolated (Panel B). Four different trends of EGP were computed using not smoothed (dashed red line) or smoothed (blue and black dashed lines) TTR data with different glucose distribution volumes (145 ml/kg or 40 ml/kg, respectively), and derived by the model predictions (continuous black line).
Fig 3
Fig 3. Predictions for Subject 1.
Observed (asterisks) and predicted (line) variables over time (NGT subject). EGP: Endogenous Glucose Production; TTR: Tracer to Tracee ratio. Plasma glucose concentration (Panel A); Plasma [6, 6-2H2]glucose (Panel B); TTR (Panel C); EGP (Panel D), dashed line is the predicted EGP with the Steele model; Rate of disappearance (panel E); Plasma Insulin concentrations (Panel F). All the observed points refer to data measured on day 2. Plasma glucose concentrations (panel A) are derived from the glucose intra-venous infusion to match plasma glucose observations from the OGTTs of day 1. Black lines in panels A, B, C, D and E are model predictions from WLS estimation procedure; blue lines derive from the estimation approach which uses autocorrelated errors.
Fig 4
Fig 4. Predictions for Subject 2.
Observed (asterisks) and predicted (line) variables over time (NGT subject). EGP: Endogenous Glucose Production; TTR: Tracer to Tracee ratio. Plasma glucose concentration (Panel A); Plasma [6, 6-2H2]glucose (Panel B); TTR (Panel C); EGP (Panel D), dashed line is the predicted EGP with the Steele model; Rate of disappearance (panel E); Plasma Insulin concentrations (Panel F). All the observed points refer to data measured on day 2. Plasma glucose concentrations (panel A) are derived from the glucose intra-venous infusion to match plasma glucose observations from the OGTTs of day 1. Black lines in panels A, B, C, D and E are model predictions from WLS estimation procedure; blue lines derive from the estimation approach which uses autocorrelated errors.
Fig 5
Fig 5. Predictions for Subject 3.
Observed (asterisks) and predicted (line) variables over time (T2DM subject). EGP: Endogenous Glucose Production; TTR: Tracer to Tracee ratio. Plasma glucose concentration (Panel A); Plasma [6, 6-2H2]glucose (Panel B); TTR (Panel C); EGP (Panel D), dashed line is the predicted EGP with the Steele model; Rate of disappearance (panel E); Plasma Insulin concentrations (Panel F). All the observed points refer to data measured on day 2. Plasma glucose concentrations (panel A) are derived from the glucose intra-venous infusion to match plasma glucose observations from the OGTTs of day 1. Black lines in panels A, B, C, D and E are model predictions from WLS estimation procedure; blue lines derive from the estimation approach which uses autocorrelated errors
Fig 6
Fig 6. Predictions for Subject 4.
Observed (asterisks) and predicted (line) variables over time (IGT subject). EGP: Endogenous Glucose Production; TTR: Tracer to Tracee ratio. Plasma glucose concentration (Panel A); Plasma [6, 6-2H2]glucose (Panel B); TTR (Panel C); EGP (Panel D), dashed line is the predicted EGP with the Steele model; Rate of disappearance (panel E); Plasma Insulin concentrations (Panel F). All the observed points refer to data measured on day 2. Plasma glucose concentrations (panel A) are derived from the glucose intra-venous infusion to match plasma glucose observations from the OGTTs of day 1. Black lines in panels A, B, C, D and E are model predictions from WLS estimation procedure; blue lines derive from the estimation approach which uses autocorrelated errors.
Fig 7
Fig 7. Predictions for Subject 5.
Observed (asterisks) and predicted (line) variables over time (T2DM subject). EGP: Endogenous Glucose Production; TTR: Tracer to Tracee ratio. Plasma glucose concentration (Panel A); Plasma [6, 6-2H2]glucose (Panel B); TTR (Panel C); EGP (Panel D), dashed line is the predicted EGP with the Steele model; Rate of disappearance (panel E); Plasma Insulin concentrations (Panel F). All the observed points refer to data measured on day 2. Plasma glucose concentrations (panel A) are derived from the glucose intra-venous infusion to match plasma glucose observations from the OGTTs of day 1. Black lines in panels A, B, C, D and E are model predictions from WLS estimation procedure; blue lines derive from the estimation approach which uses autocorrelated errors.
Fig 8
Fig 8. Predictions for Subject 6.
Observed (asterisks) and predicted (line) variables over time (IGT subject). EGP: Endogenous Glucose Production; TTR: Tracer to Tracee ratio. Plasma glucose concentration (Panel A); Plasma [6, 6-2H2]glucose (Panel B); TTR (Panel C); EGP (Panel D), dashed line is the predicted EGP with the Steele model; Rate of disappearance (panel E); Plasma Insulin concentrations (Panel F). All the observed points refer to data measured on day 2. Plasma glucose concentrations (panel A) are derived from the glucose intra-venous infusion to match plasma glucose observations from the OGTTs of day 1. Black lines in panels A, B, C, D and E are model predictions from WLS estimation procedure; blue lines derive from the estimation approach which uses autocorrelated errors.
Fig 9
Fig 9. Model comparison for Subject 1.
Observed (asterisks) and predicted (line) variables over time with glucose two-compartment model (Panels A, C, E) and one-compartments-glucose model (Panels B, D, F). Dashed line is the predicted EGP with the Steele model. All the observed points refer to data measured on day 2. Plasma glucose concentrations (panel A) are derived from the glucose intra-venous infusion to match plasma glucose observations from the OGTTs of day 1.
Fig 10
Fig 10. Model comparison for Subject 2.
Observed (asterisks) and predicted (line) variables over time with glucose two-compartment model (Panels A, C, E) and one-compartments-glucose model (Panels B, D, F). Dashed line is the predicted EGP with the Steele model. All the observed points refer to data measured on day 2. Plasma glucose concentrations (panel A) are derived from the glucose intra-venous infusion to match plasma glucose observations from the OGTTs of day 1.
Fig 11
Fig 11. Model comparison for Subject 3.
Observed (asterisks) and predicted (line) variables over time with glucose two-compartment model (Panels A, C, E) and one-compartments-glucose model (Panels B, D, F). Dashed line is the predicted EGP with the Steele model. All the observed points refer to data measured on day 2. Plasma glucose concentrations (panel A) are derived from the glucose intra-venous infusion to match plasma glucose observations from the OGTTs of day 1.
Fig 12
Fig 12. Model comparison for Subject 4.
Observed (asterisks) and predicted (line) variables over time with glucose two-compartment model (Panels A, C, E) and one-compartments-glucose model (Panels B, D, F). Dashed line is the predicted EGP with the Steele model. All the observed points refer to data measured on day 2. Plasma glucose concentrations (panel A) are derived from the glucose intra-venous infusion to match plasma glucose observations from the OGTTs of day 1.
Fig 13
Fig 13. Model comparison for Subject 5.
Observed (asterisks) and predicted (line) variables over time with glucose two-compartment model (Panels A, C, E) and one-compartments-glucose model (Panels B, D, F). Dashed line is the predicted EGP with the Steele model. All the observed points refer to data measured on day 2. Plasma glucose concentrations (panel A) are derived from the glucose intra-venous infusion to match plasma glucose observations from the OGTTs of day 1.
Fig 14
Fig 14. Model comparison for Subject 6.
Observed (asterisks) and predicted (line) variables over time with glucose two-compartment model (Panels A, C, E) and one-compartments-glucose model (Panels B, D, F). Dashed line is the predicted EGP with the Steele model. All the observed points refer to data measured on day 2. Plasma glucose concentrations (panel A) are derived from the glucose intra-venous infusion to match plasma glucose observations from the OGTTs of day 1.
Fig 15
Fig 15. Weighted residuals.
Scatter plot of weighted residuals towards observations under the hypothesis of correlated errors.

References

    1. Baley C (2005) Treating insulin resistance in type 2 diabetes with metformin and thiazolidinediones. Diabetes Obes Metab 7: 675–691. doi: 10.1111/j.1463-1326.2005.00497.x - DOI - PubMed
    1. Mingrone G and Panunzi S and De Gaetano A and Guidone C and Iaconelli A and Leccesi L, et al.. (2012) Bariatric surgery versus conventional medical therapy for type 2 diabetes. N Engl J Med 366: 1577–1585. doi: 10.1056/NEJMoa1200111 - DOI - PubMed
    1. Schauer P, Kashyap S, Wolski K, Brethauer S, Kirwan J, et al.. (2012) Bariatric surgery versus intensive medical therapy in obese patients with diabetes. N Engl J Med 16: 1567–76. doi: 10.1056/NEJMoa1200225 - DOI - PMC - PubMed
    1. Mingrone G, Panunzi S, De Gaetano A, Guidone C, Iaconelli A, et al.. (2004) Bariatric-metabolic surgery versus conventional medical treatment in obese patients with type 2 diabetes: 5 year follow-up of an open-label, single-centre, randomised controlled trial. Lancet 386: 964–973. doi: 10.1016/S0140-6736(15)00075-6 - DOI - PubMed
    1. Schauer P, Bhatt D, Kirwan J, Wolski K, Aminian A, et al.. (2017) Bariatric surgery versus intensive medical therapy for diabetes—5-year outcomes. N Engl J Med 376: 641–651. doi: 10.1056/NEJMoa1600869 - DOI - PMC - PubMed