. 2022 Dec 21;8(51):eadc9236.
doi: 10.1126/sciadv.adc9236. Epub 2022 Dec 21.

GABA signaling triggered by TMC-1/Tmc delays neuronal aging by inhibiting the PKC pathway in C. elegans

Affiliations

GABA signaling triggered by TMC-1/Tmc delays neuronal aging by inhibiting the PKC pathway in C. elegans

Jieyu Wu et al. Sci Adv. .

Abstract

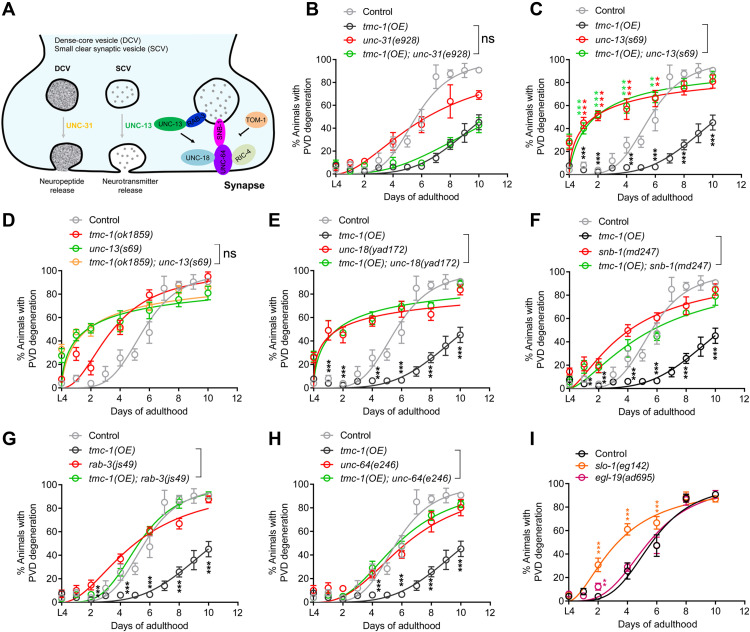
Aging causes functional decline and degeneration of neurons and is a major risk factor of neurodegenerative diseases. To investigate the molecular mechanisms underlying neuronal aging, we developed a new pipeline for neuronal proteomic profiling in young and aged animals. While the overall translational machinery is down-regulated, certain proteins increase expressions upon aging. Among these aging-up-regulated proteins, the conserved channel protein TMC-1/Tmc has an anti-aging function in all neurons tested, and the neuroprotective function of TMC-1 occurs by regulating GABA signaling. Moreover, our results show that metabotropic GABA receptors and G protein GOA-1/Goα are required for the anti-neuronal aging functions of TMC-1 and GABA, and the activation of GABA receptors prevents neuronal aging by inhibiting the PLCβ-PKC pathway. Last, we show that the TMC-1-GABA-PKC signaling axis suppresses neuronal functional decline caused by a pathogenic form of human Tau protein. Together, our findings reveal the neuroprotective function of the TMC-1-GABA-PKC signaling axis in aging and disease conditions.


Figures

Fig. 1.
Fig. 1.. Neuronal proteomic profiling reveals age-dependent change of protein levels.
(A) Free TurboID is evenly distributed in C. elegans neurons. yadIs83 [Prgef-1::3×HA::TurboID]: an integrated transgene expressing HA-tagged TurboID driven by a pan-neuronal promoter Prgef-1. (i) Image showing the distribution of HA-TurboID by immunostaining using anti-HA antibody; scale bar, 20 μm. (ii) Schematic diagram of the distribution of free TurboID. (iii) Summary of TurboID proximity labeling. (B) Scheme of TurboID-mediated proximity labeling at different ages. (C) Expression of free TurboID can specifically label neuronal proteins. The image shows the receiver operating characteristic (ROC) curve of each time point (days 1, 3, 6, 9, and 12). Wild-type N2 animals were used as negative controls for ROC analysis. Area under the curve (AUC) represents the degree of separability or specificity between experimental and control groups. (D and E) Data from correlation analysis (R2) of the three biological replicates show high similarities in both young (D) and aged (E) animals. (F) Spearman correlation analyses show that neuronal proteomes exhibit high specificity when compared with proteomes from negative control N2 (wild-type strain), hypodermal, and muscle cells. yadIs83[Prgef1::3×HA::TurboID], neuronal expression of TurboID; yadIs112[Pcol-19::3×HA::TurboID], hypodermal expression of TurboID; yadIs118[Pmyo-3::3×HA::TurboID], muscle expression of TurboID. (G) Gene ontology analyses show that the results from neuronal proteomics uncover proteins expressed in all neuronal cellular compartments. The numbers on the bar indicate the gene number clustered on the term. (H to K) Volcano plots of proteomes show proteins with significant changes in day 3, 6, 9, and 12 animals when compared with day 1 animals. Protein level with log2FC > 0.6 or log2FC < −0.6 (FC, fold change) with –log10(P value) > 1.3 is defined as significantly up-regulated (deep red) and down-regulated (deep blue), respectively. Twenty-three candidate genes selected for screening are labeled with yellow and green. The green dot indicates TMC-1.
Fig. 2.
Fig. 2.. Use of PVD, ALM, and PLM neurons as models to identify proteins involved in neuronal aging.
(A) PVD, ALM, and PLM neurons display aging-associated degeneration and morphological changes. The top panel shows the schematic diagram of PVD, ALM, and PLM neurons that were labeled with green, red, and blue colors, respectively. The bottom panel shows the representative images of neurons during aging. PVD neurons were examined using wdIs51[F49H12.4::GFP]. ALM and PLM were visualized using zdIs5[Pmec-4::GFP]. The red asterisks indicate the ALM cell body. The blue arrows indicate the PLM axon terminal. Scale bars, 20 μm. (B) Quantification of percentage of animals with aging phenotypes. For each experiment, the percentage was calculated by the number of animals having degeneration phenotypes divided by the total number of animals observed. (C) Workflow for examining candidate genes. Proteins of interest are those with higher expression in day 6, 9, and 12 adults when compared with day 1 animals. Phenotypes were examined in day 1, 4, and 6 adults. (D to F) Quantification of percentage of animals with aging-associated phenotypes in PVD (D), ALM (E), and PLM (F) neurons. Results are shown in heatmaps representing three biological replicates. The names of genes tested are listed on the right side, and their mammalian homologs are listed in fig. S5E. Genes were overexpressed in the nervous system driven by a pan-neuronal promoter Prgef-1. The black boxes highlight the control group. Student’s t test analysis, significant difference between control (day 6) and a specific gene overexpression group (day 6), *P < 0.05, **P < 0.01, and ***P < 0.001. Nonsignificant comparisons are not indicated in the figure. (G and H) Summary of genes that have pro-aging (G) and anti-aging (H) functions in PVD, ALM, and PLM neurons.
Fig. 3.
Fig. 3.. TMC-1 protects neurons from aging.
(A and B) tmc-1(ok1859, null allele, lf) and tmc-1 overexpression (OE, yadIs137) caused early- and late-onset aging-associated PVD neurodegeneration, respectively. (A) Representative confocal images of PVD neurons in young and aged animals. Scale bar, 20 μm. (B) Quantification of percentage of animals with aging phenotypes. Student’s t test, tmc-1(ok1859) versus control: ** (red) P < 0.01, *** (red) P < 0.001; tmc-1(OE) versus control: * (green) P < 0.05, *** (green) P < 0.001. Nonsignificant comparisons are not indicated in the figure. (C) Use of harsh touch response to analyze PVD functions. Student’s t test, tmc-1(ok1859) versus control: ** (red) P < 0.01, *** (red) P < 0.001; tmc-1(OE) versus control: * (green) P < 0.01, *** (green) P < 0.001. Nonsignificant comparisons are not indicated in the figure. (D) tmc-1 functions in neurons to regulate aging-associated PVD neurodegeneration. Neuronal-specific rescue was performed by the expression of tmc-1 cDNA using the pan-neuronal Prgef-1 promoter. Significant difference between tmc-1(ok1859) and tmc-1(ok1859) rescue groups, Student’s t test, **P < 0.01, ***P < 0.001. Nonsignificant comparisons are not indicated in the figure. (E) Expression of mouse Tmc1 can rescue tmc-1(lf) phenotypes. Significant difference between tmc-1(ok1859) and tmc-1(ok1859) rescue groups, Student’s t test, ***P < 0.001. Nonsignificant comparisons are not indicated in the figure.
Fig. 4.
Fig. 4.. TMC-1 regulates neuronal aging through control of synaptic vesicle release.
(A) Schematic of DCV and SCV release in neurons. (B) Quantification of percentage of animals with PVD neurodegeneration in control, tmc-1(OE,yadIs137), unc-31 (e928), and tmc-1(OE,yadIs137);unc-31(e928) strains. Student’s t test showed no differences between tmc-1(OE,yadIs137) and tmc-1(OE,yadIs137);unc-31(e928) at any time point. Nonsignificant comparisons are not indicated in the figure. (C) Quantification of percentage of animals with PVD neurodegeneration in control, tmc-1(OE,yadIs137), unc-13 (s69), and tmc-1(OE,yadIs137);unc-13(s69) strains. Significant difference between tmc-1(OE,yadIs137) and tmc-1(OE,yadIs137);unc-13(s69), Student’s t test analysis for each day, *** (black) P < 0.001. Significant difference between control, unc-13(s69), and tmc-1(OE,yadIs137);unc-13(s69), one way analysis of variance (ANOVA) analysis for each day, unc-13(s69) versus control: ** (red) P < 0.01, *** (red) P < 0.001; tmc-1(OE,yadIs137);unc-13(s69) versus control: ** (green) P < 0.01, *** (green) P < 0.001. Nonsignificant comparisons are not indicated in the figure. (D) Quantifications of percentage of animals with PVD neurodegeneration in control, tmc-1(ok1859), unc-13(s69), and tmc-1(ok1859);unc-13(s69) strains. Student’s t test showed no differences between tmc-1(ok1859);unc-13(s69) and unc-13(s69) at any time point (ns, no significant difference). (E to H) Quantification of percentage of animals with PVD neurodegeneration in mutants of vesicle release–associated genes, unc-18(yad172), snb-1(md247), rab-3(js49), and unc-64(e246), and these mutations in the tmc-1(OE,yadIs137) background. Significant difference between unc-18(yad172) and tmc-1(OE,yadIs137);unc-18(yad172) (E), snb-1(md247) and tmc-1(OE,yadIs137);snb-1(md247) (F), rab-3(js49) and tmc-1(OE,yadIs137); rab-3(js49) (G), and unc-64(e246) and tmc-1(OE,yadIs137);unc-64(e246) (H). Student’s t test analysis for each day, **P < 0.01, ***P < 0.001. Nonsignificant comparisons are not indicated in the figure. (I) Quantification of percentage of animals with PVD neurodegeneration in control, slo-1(eg142,lf), and egl-19(ad695, gf) animals. Significant difference between control and slo-1(eg142), Student’s t test analysis for each day, ***P < 0.001. Nonsignificant comparisons are not indicated in the figure.
Fig. 5.
Fig. 5.. GABA is required for the neuroprotective function of TMC-1.
(A) Schematic of neurotransmitters and their key biosynthetic enzymes in synapses. (B and C) Quantification of percentage of animals with PVD neurodegeneration in control, tmc-1(OE,yadIs137), and tmc-1(OE,yadIs137) in different mutant backgrounds. Significant difference between tmc-1(OE,yadIs137) and tmc-1(OE,yadIs137);unc-25, Student’s t test analysis for each day, **P < 0.01, ***P < 0.001. Nonsignificant comparisons are not indicated in the figure. (D) Quantification of percentage of animals with PVD neurodegeneration in control, tmc-1(OE,yadIs137), and tmc-1(OE,yadIs137);unc-30(ok613) animals. Significant difference between tmc-1(OE,yadIs137) and tmc-1(OE,yadIs137);unc-30(ok613), Student’s t test analysis for each day, ***P < 0.001. (E to G) tmc-1 functions in GABAergic neurons to regulate PVD neurodegeneration. GABAergic-specific rescue was performed by expression of tmc-1 cDNA driven by the GABAergic-specific promoter Punc-25, cholinergic-specific promoter Pacr-2, and serotonergic-specific promoter Ptph-1, respectively. Significant difference between tmc-1(ok1859) and tmc-1(ok1859) GABAergic rescue groups, Student’s t test analysis for each day, **P < 0.01, ***P < 0.001. Nonsignificant comparisons are not indicated in the figure. (H) Quantification of percentage of animals with PVD neurodegeneration in control, tmc-1 GABAergic (Punc-25), cholinergic (Pacr-2), and serotonergic (Ptph-1) overexpression transgenes. Significant difference between control and tmc-1 GABAergic overexpression groups, Student’s t test analysis for each day, ***P < 0.001. Nonsignificant comparisons are not indicated in the figure.
Fig. 6.
Fig. 6.. The neuroprotective function of TMC-1–GABA signals acts through the GABAB receptors.
(A) Schematic of antagonists and agonists of GABAA and GABAB receptors. (B) Quantification of the percentage of animals with PVD neurodegeneration in control(wdIs51) and tmc-1(OE,yadIs137);wdIs51 animals treated with different antagonists for GABAA or GABAB receptor. Student’s t test analysis, *P < 0.05, ***P < 0.001. (C) Quantification of percentage of animals with PVD neurodegeneration in control and tmc-1(OE,yadIs137) animals treated with or without GABAB receptor agonist. Significant difference between control animals treated with and without baclofen, Student’s t test analysis for each day, *P < 0.05, ***P < 0.001. Statistical analyses of tmc-1(OE, yadIs137) animals with and without baclofen show no differences. Nonsignificant comparisons are not indicated in the figure. (D) Quantification of percentage of animals with PVD neurodegeneration in control, tmc-1(OE,yadIs137), gbb-1 (yad225), tmc-1(OE,yadIs137);gbb-1(yad225), and PVD-specific rescue of gbb-1 in tmc-1(OE,yadIs137);gbb-1(yad225) background. Significant difference between tmc-1(OE,yadIs137) and tmc-1(OE,yadIs137);gbb-1(yad225), Student’s t test analysis for each day, ***P < 0.001. (E) Quantification of percentage of animals with PVD neurodegeneration in control, tmc-1(OE,yadIs137), gbb-2 (yad227), and tmc-1(OE,yadIs137);gbb-1(yad227) strains. Analyses between tmc-1(OE, yadIs137) and tmc-1(OE,yadIs137);gbb-2(yad227) show no significant differences, Student’s t test analysis for each day. Nonsignificant comparisons are not indicated in the figure.
Fig. 7.
Fig. 7.. The neuroprotective function of TMC-1–GABA signals acts by inhibiting the PLCβ.
(A) Schematic of signals regulated by Gi/o proteins. (B) Quantification of the percentage of animals with PVD neurodegeneration in control, tmc-1(OE,yadIs137), and PVD-specific expression of PTX in tmc-1(OE,yadIs137) background. Significant difference between the tmc-1(OE, yadIs137) and PVD-specific expression of PTX in tmc-1(OE,yadIs137) groups, Student’s t test analysis for each day, ***P < 0.001. (C) Quantification of percentage of animals with PVD neurodegeneration in control, tmc-1(OE,yadIs137), goa-1(sa734), and tmc-1(OE,yadIs137);goa-1(sa734) strains. Significant difference between tmc-1(OE, yadIs137) and tmc-1(OE,yadIs137);goa-1(sa734), Student’s t test analysis for each day, ***P < 0.001. (D to G) Identification of downstream signals of Gi/o that mediate TMC-1 and GABA neuron-protective functions. Pde-4(ok1290) and kin-2(ce179) are two mutants with increased PKA activity. Egl-4(ad450) is a gain-of-function mutant with increased PKG activity. Egl-8(n488) is a loss of function of mutant egl-8/PLCβ. Student’s t test for each day, pde-4(ok1290) versus tmc-1(OE); pde-4(ok1290): ***P < 0.001 (D); kin-2(ce179) versus tmc-1(OE); kin-2(ce179): ***P < 0.001 (E); egl-4(ad450) versus tmc-1(OE); egl-4(ad450): ***P < 0.001 (F); egl-8(n488) versus tmc-1(OE); egl-8(n488): no significant difference (F). Significant difference between control and egl-8(n488), Student’s t test analysis for each day, *P < 0.05, ***P < 0.001 (G). Nonsignificant comparisons are not indicated in the figure.
Fig. 8.
Fig. 8.. The PLCβ-DAG-PKC pathway functions at the downstream of TMC-1–GABA signals to protect neurons from aging.
(A) Schematic of the GOA-1–EGL-30–EGL-8 pathway. (B) Quantification of percentage of animals with PVD neurodegeneration in control, tmc-1(OE,yadIs137), egl-30(n686), and tmc-1(OE,yadIs137);egl-30(n686) strains. Significant difference between control and egl-30(n686), Student’s t test analysis for each day, **P < 0.01, ***P < 0.001. (C) A schematic diagram shows how the inositol 1,4,5-trisphosphate (IP3) signal is blocked by expressing IP3 super-sponge. IP3 diffuses to the endoplasmic reticulum (ER), where it activates the IP3 receptor (ITR-1), resulting in the release of Ca2+ into the cytoplasm. IP3 super-sponge is an N-terminal fragment (1 to 705 amino acids) of ITR-1 with a mutation (R511C) on the IP3 binding domain. Expression of IP3 super-sponge could competitively bind with IP3 to interfere with the IP3 receptor activation. (D) Quantification of percentage of animals with PVD neurodegeneration in control and PVD-specific expression of IP3 super-sponge transgenes. Significant difference between control and PVD IP3 super-sponge–expressing transgenic animals, Student’s t test analysis for each day, *P < 0.05, **P < 0.01, and ***P < 0.001. (E) Quantification of percentage of animals with PVD neurodegeneration in control, tmc-1(OE), dgk-1(sy428), and tmc-1(OE);dgk-1(sy428) strains. Significant difference between tmc-1(OE) and tmc-1(OE);dgk-1(sy428), Student’s t test analysis for each day, ***P < 0.001.(F) Quantification of percentage of animals with PVD neurodegeneration in control, tmc-1(OE), pkc-1(nj3), tmc-1(OE);pkc-1(nj3), and PVD-specific expression of pkc-1(gf) in control or tmc-1(OE) strains. pkc-1(nj3) is a null allele (W218stop). pkc-1(gf) is a constitutively active form of PKC-1 carrying an A160E mutation in the autoinhibitory pseudosubstrate motif (61). Student’s t test for each day, control versus pkc-1(nj3): *** (black) P < 0.001; tmc-1(OE) versus PVD-specific expression of pkc-1(gf) under the tmc-1(OE) background: *** (rose-red) P < 0.001. Significance analysis between pkc-1(nj3) and tmc-1(OE);pkc-1(nj3) showed no differences. Nonsignificant comparisons are not indicated in the figure.
Fig. 9.
Fig. 9.. The TMC-1–GABA–PKC signaling axis regulates aging-associated decline of locomotion and axon regeneration.
(A) Schematic of the C. elegans locomotive neural circuit. (B) Representative 30-s locomotion trajectories superimposed for 12 animals of each experiment group as indicated. The starting points for each trajectory are aligned for clarity. Scale bar, 1 mm. (C) Quantification of the average locomotion speed of animals. Data are presented as means ± SD of at least 15 animals. One-way ANOVA, *P < 0.05, **P < 0.01, ***P < 0.001. Significant difference between tmc-1(OE) and tmc-1(OE);rab-3(js49), or tmc-1(OE);gbb-1(yad225), respectively, one-way ANOVA, ##P < 0.01, ###P < 0.001. (D) Representative confocal images of PLM axons at 24 hours after axotomy. The red arrows indicate the cutting sites. Scale bar, 20 μm. (E) Quantification of PLM regrowth length at 24 hours after axotomy. n, number of animals used for quantification. Data are presented as means ± SD. One-way ANOVA, in day 1 group, **P < 0.01, ***P < 0.001; in day 5 group, ##P < 0.01, ###P < 0.001.
Fig. 10.
Fig. 10.. Activation of the TMC-1–GABA–PKC signaling axis protects neurons in a C. elegans Alzheimer’s disease model.
(A) Representative 30-s locomotion trajectories superimposed for 12 animals of each experiment group as indicated. The starting points for each trajectory are aligned for clarity. Scale bar, 1 mm. (B) Average locomotion speed of animals. Data are presented as means ± SD of at least 15 animals. Student’s t test for each time point, *P < 0.05, **P < 0.01, ***P < 0.001. (C) Model for the TMC-1–GABA–PKC signaling axis in neuronal aging and neurodegeneration.

References

    1. J. V. Pluvinage, T. Wyss-Coray, Systemic factors as mediators of brain homeostasis, ageing and neurodegeneration. Nat. Rev. Neurosci. 21, 93–102 (2020). - PubMed
    1. Y. Hou, X. Dan, M. Babbar, Y. Wei, S. G. Hasselbalch, D. L. Croteau, V. A. Bohr, Ageing as a risk factor for neurodegenerative disease. Nat. Rev. Neurol. 15, 565–581 (2019). - PubMed
    1. Ageing - United Nations report on world population ageing. World Today 58, 12–13 (2002).
    1. F. Sierra, E. Hadley, R. Suzman, R. Hodes, Prospects for life span extension. Annu. Rev. Med. 60, 457–469 (2009). - PubMed
    1. C. Peng, J. Q. Trojanowski, V. M. Lee, Protein transmission in neurodegenerative disease. Nat. Rev. Neurol. 16, 199–212 (2020). - PMC - PubMed