. 2023 Jan:171:107701.
doi: 10.1016/j.envint.2022.107701. Epub 2022 Dec 15.

Bottled water contaminant exposures and potential human effects

Affiliations

Bottled water contaminant exposures and potential human effects

Paul M Bradley et al. Environ Int. 2023 Jan.

Abstract

Background: Bottled water (BW) consumption in the United States and globally has increased amidst heightened concern about environmental contaminant exposures and health risks in drinking water supplies, despite a paucity of directly comparable, environmentally-relevant contaminant exposure data for BW. This study provides insight into exposures and cumulative risks to human health from inorganic/organic/microbial contaminants in BW.

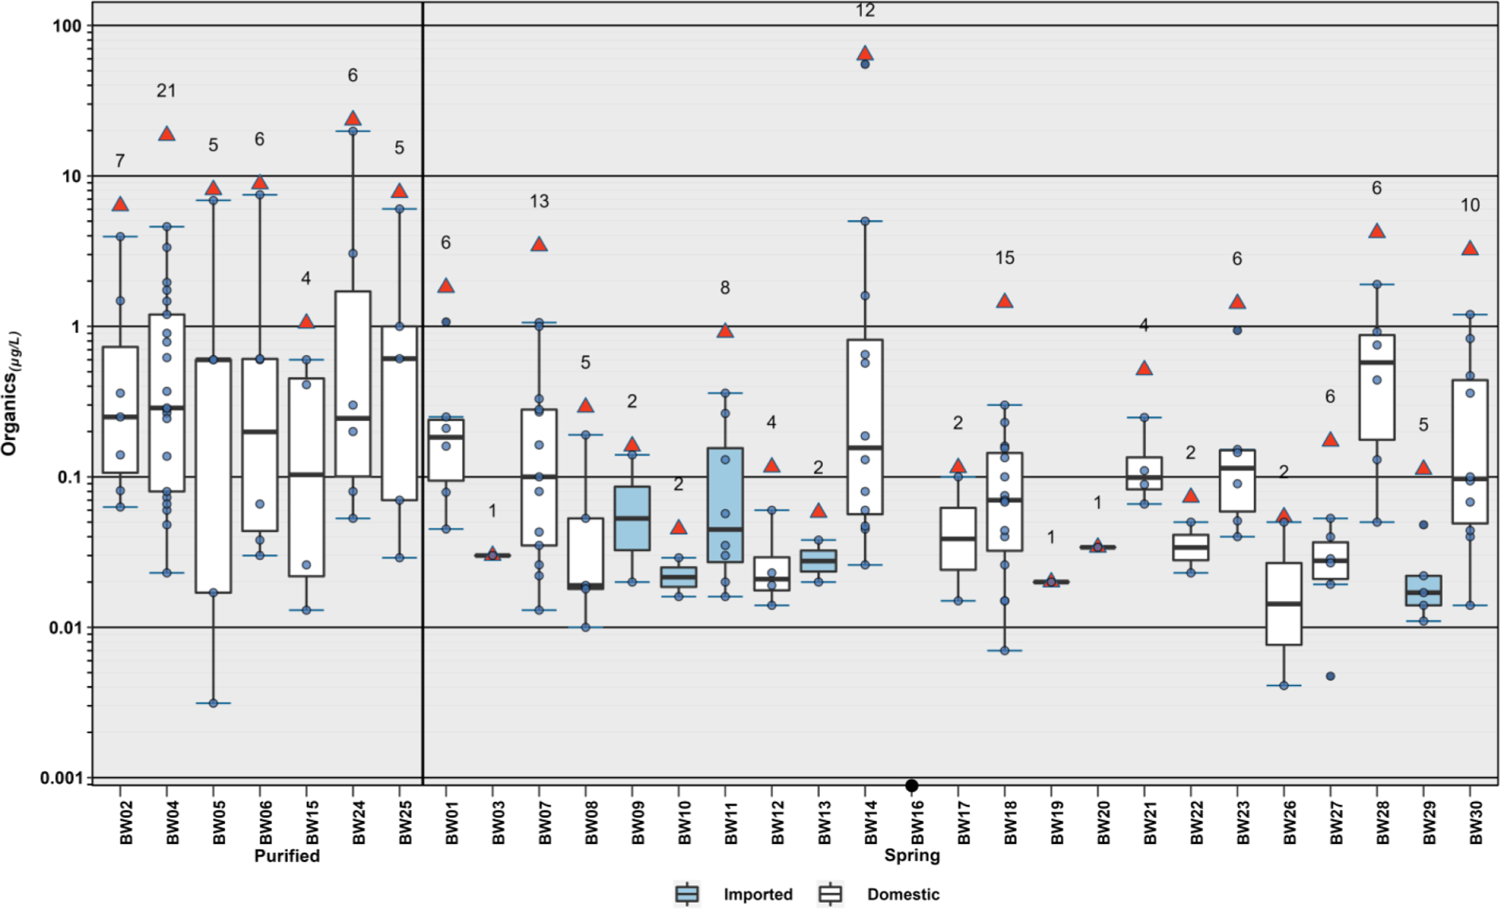
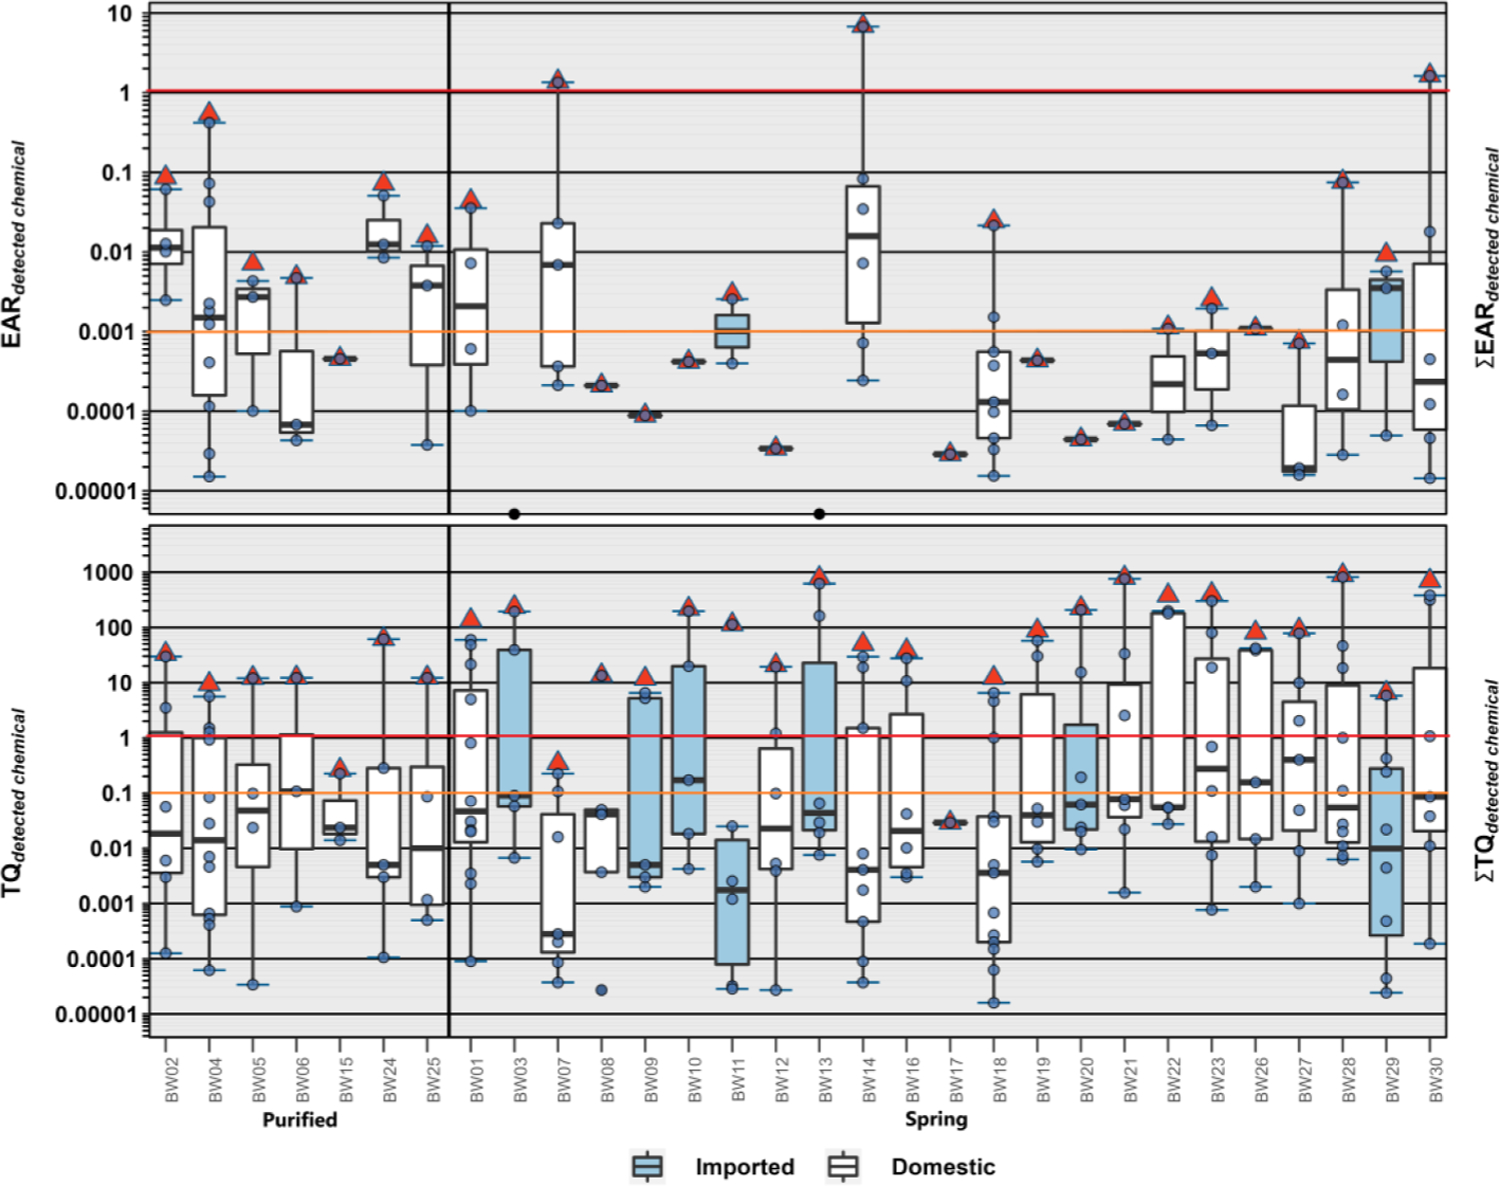
Methods: BW from 30 total domestic US (23) and imported (7) sources, including purified tapwater (7) and spring water (23), were analyzed for 3 field parameters, 53 inorganics, 465 organics, 14 microbial metrics, and in vitro estrogen receptor (ER) bioactivity. Health-benchmark-weighted cumulative hazard indices and ratios of organic-contaminant in vitro exposure-activity cutoffs were assessed for detected regulated and unregulated inorganic and organic contaminants.

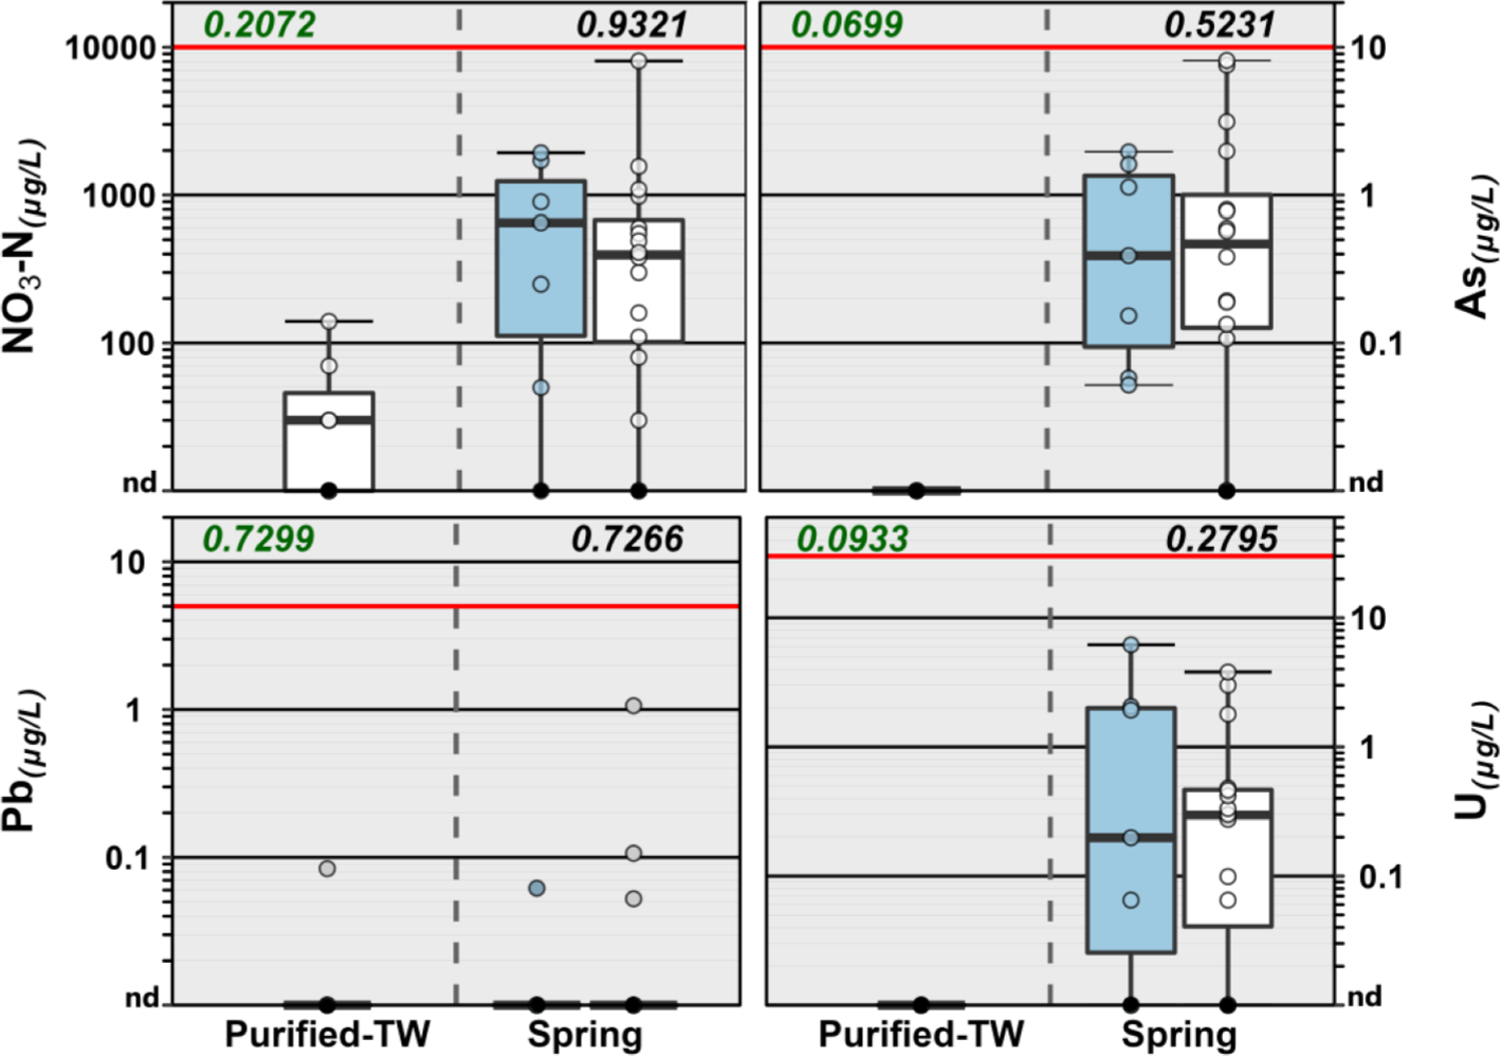
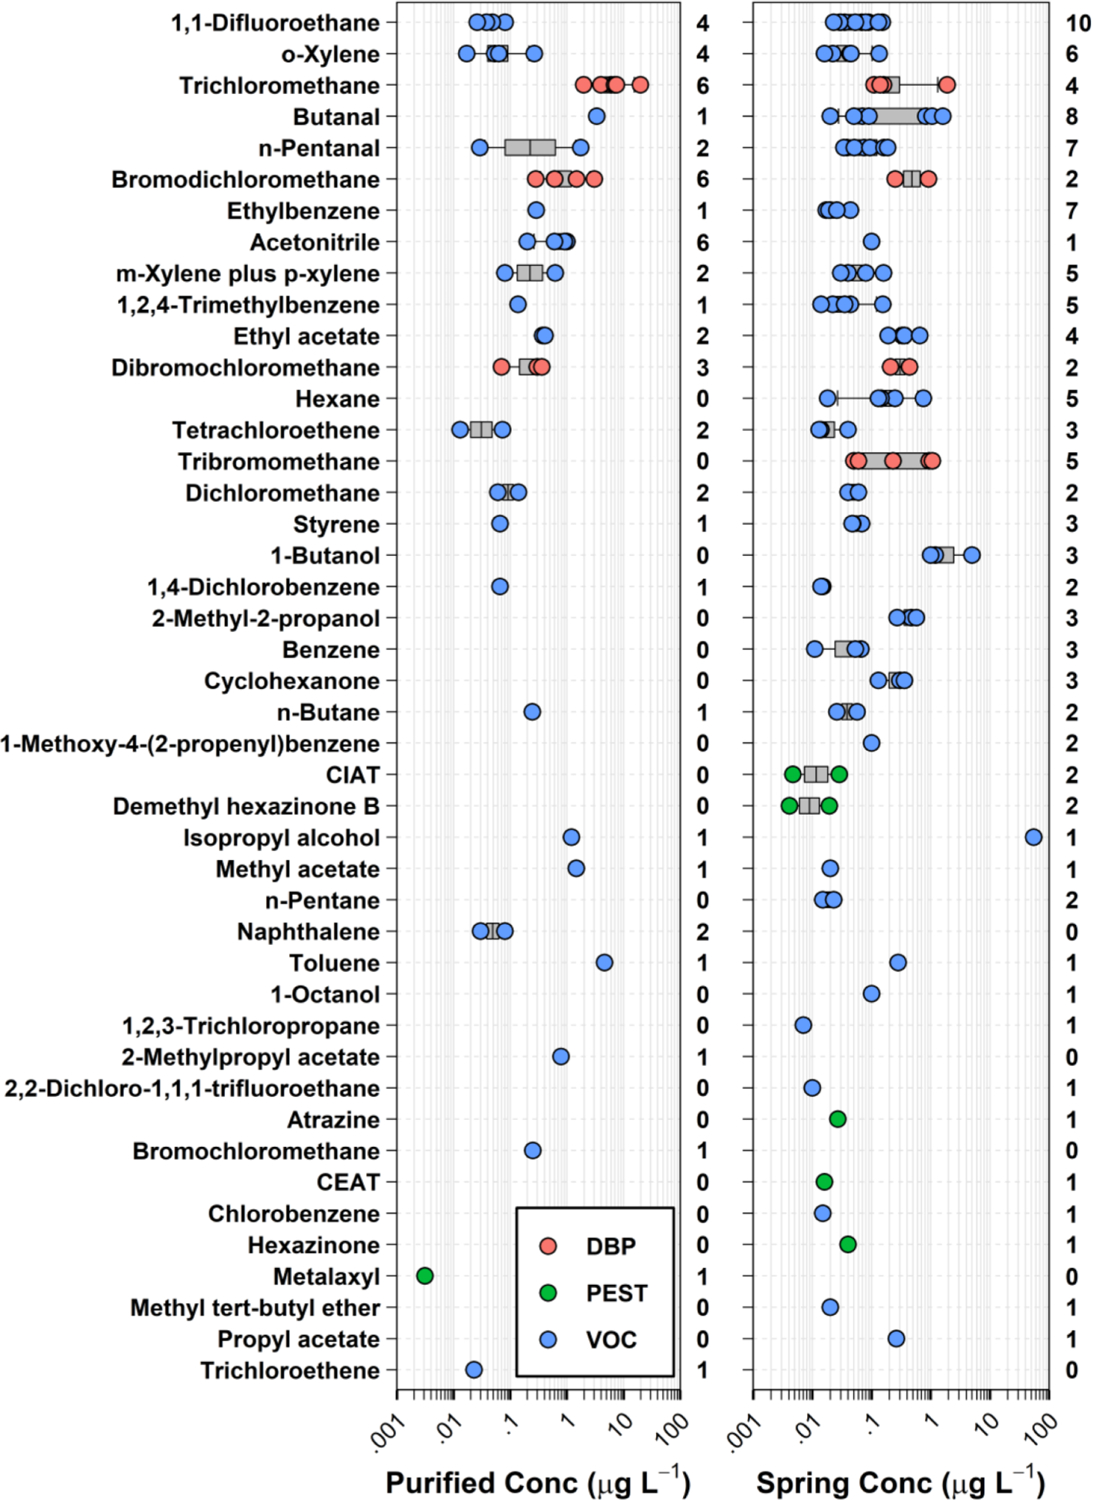
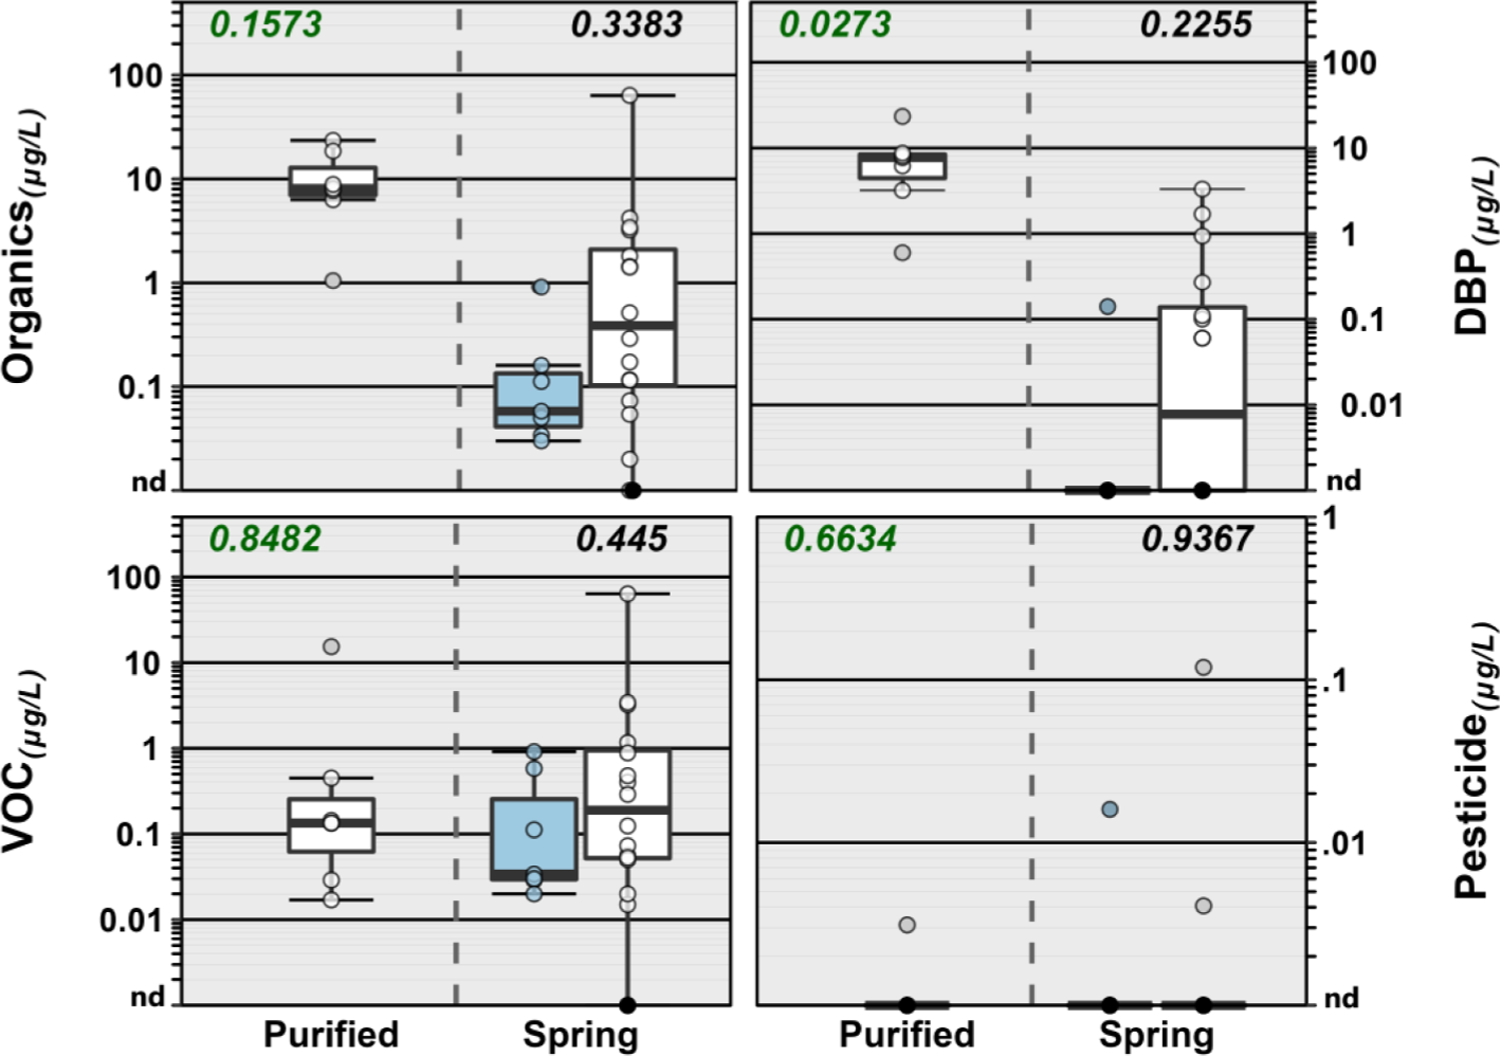
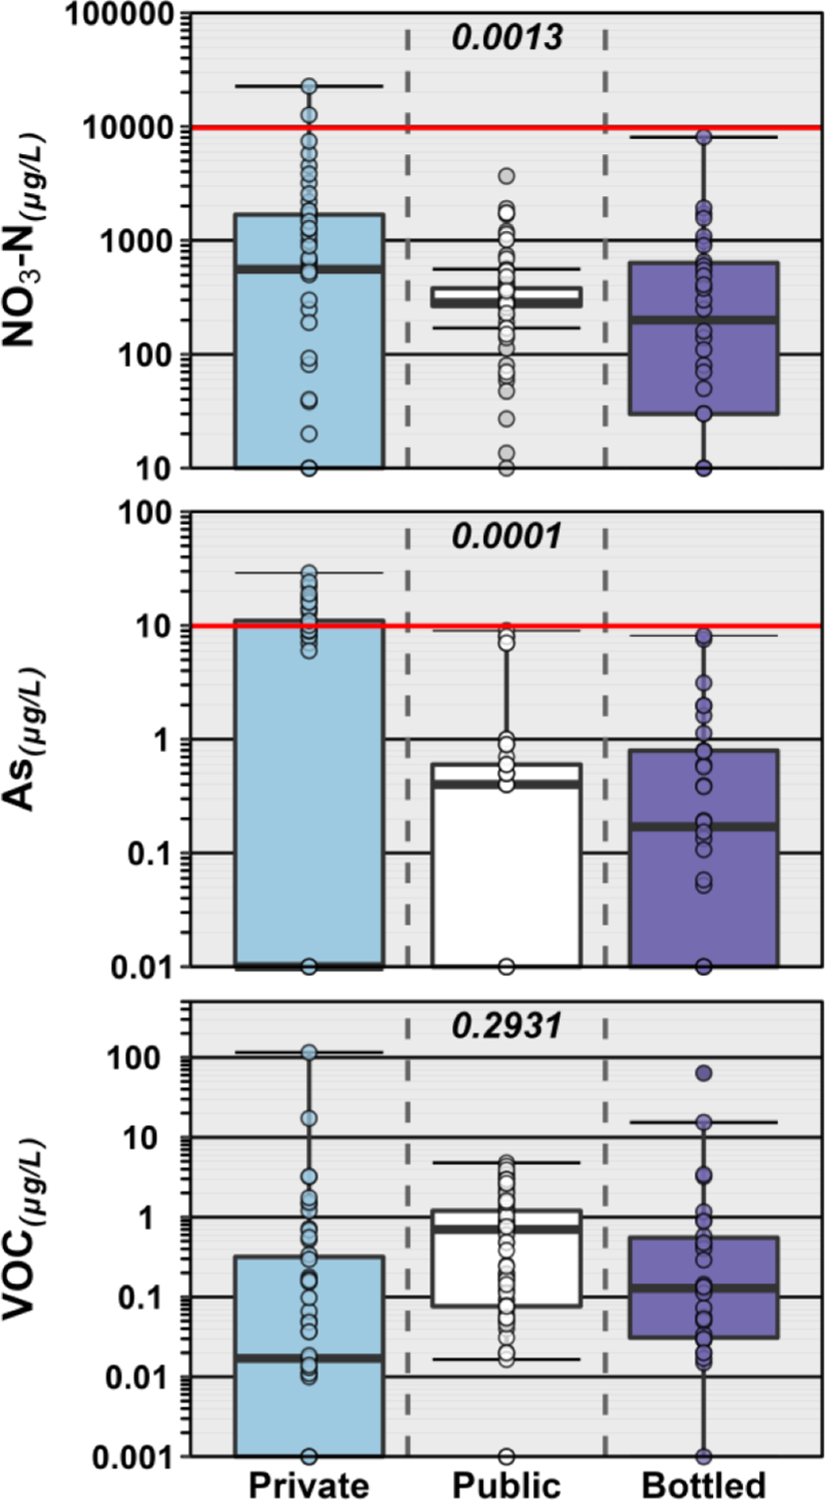
Results: 48 inorganics and 45 organics were detected in sampled BW. No enforceable chemical quality standards were exceeded, but several inorganic and organic contaminants with maximum contaminant level goal(s) (MCLG) of zero (no known safe level of exposure to vulnerable sub-populations) were detected. Among these, arsenic, lead, and uranium were detected in 67 %, 17 %, and 57 % of BW, respectively, almost exclusively in spring-sourced samples not treated by advanced filtration. Organic MCLG exceedances included frequent detections of disinfection byproducts (DBP) in tapwater-sourced BW and sporadic detections of DBP and volatile organic chemicals in BW sourced from tapwater and springs. Precautionary health-based screening levels were exceeded frequently and attributed primarily to DBP in tapwater-sourced BW and co-occurring inorganic and organic contaminants in spring-sourced BW.

Conclusion: The results indicate that simultaneous exposures to multiple drinking-water contaminants of potential human-health concern are common in BW. Improved understandings of human exposures based on more environmentally realistic and directly comparable point-of-use exposure characterizations, like this BW study, are essential to public health because drinking water is a biological necessity and, consequently, a high-vulnerability vector for human contaminant exposures.

Keywords: Bottled water; Contaminant mixtures; Human health; Inorganics; Microorganisms; Organics.


Conflict of interest statement

Declaration of Competing Interest The authors declare that they have no known competing financial interests or personal relationships that could have appeared to influence the work reported in this paper.

Figures

Fig. 1.
Fig. 1.
Group comparison of concentrations of select inorganics detected in purified-TW (domestic) and spring (domestic, white; imported, blue) sourced bottled water samples during 2020. Solid red lines indicate enforceable FDA SOQ levels. EPA MCLG for As, U, and Pb are zero. For NO3-N, SOQ and MCLG are the same. Boxes, centerlines, and whiskers indicate interquartile range, median, and 5th and 95th percentiles, respectively. Numbers in green font (top left of plots) indicate the permuted probability that the centroids and dispersions are the same (PERMANOVA; 9999 permutations) across all (purified-TW and spring sourced) BW groups; numbers above spring-sourced BW boxplot pairs (top right of plots) indicate the permuted probability that the centroids and dispersions are the same for spring-sourced BW groups. “nd” indicates not detected.
Fig. 2.
Fig. 2.
Detected concentrations (circles, μg L−1) and number of bottled water samples (right axes) for 45 organic analytes (left axis, in order of decreasing total detections) detected in purified-TW (left plot) and spring (right plot) sourced bottled water samples during 2020. Circles (●) are data for individual samples. Boxes, centerlines, and whiskers indicate interquartile range, median, and 5th and 95th percentiles, respectively. DBP, PEST, and VOC indicate disinfection byproducts, pesticides, and volatile organic chemicals, respectively. VOC generally associated with disinfection processes when present in drinking water are identified as DBP. CEAT and CIAT are deisopropylatrazine and deethylatrazine, respectively.
Fig. 3.
Fig. 3.
Individual (circles, ●) and cumulative (sum of all detected; red triangles, △) concentrations of 45 organic analytes detected in spring (domestic, white; imported, blue) and purified-TW (domestic, white) sourced bottled water samples during 2020. Boxes, centerlines, and whiskers indicate interquartile range, median, and 5th and 95th percentiles, respectively. Numbers above each boxplot indicate total detected organic analytes. Circle on x-axis (BW16) indicates no organic analytes detected.
Fig. 4.
Fig. 4.
Group comparisons of cumulative concentration of all organics (upper left plot) and select organic classes detected in spring (domestic, white; imported, blue) and purified-TW (domestic) sourced bottled water samples during 2020. Boxes, centerlines, and whiskers indicate interquartile range, median, and 5th and 95th percentiles, respectively. Numbers in green font (top left of plots) indicate the permuted probability that the centroids and dispersions are the same (PERMANOVA; 9999 permutations) across all (purified-TW and spring sourced) BW groups; numbers above spring-sourced BW boxplot pairs (top right of plots) indicate the permuted probability that the centroids and dispersions are the same for spring-sourced BW groups. “nd” indicates not detected.
Fig. 5.
Fig. 5.
Top. Individual EAR values (circles) and cumulative EAR (ΣEAR, sum of all detected; red triangles, △) across all assays for 24 organic analytes listed in ToxCast and detected in spring (domestic, white; imported, blue) and purified-TW (domestic) sourced bottled water samples during 2020. Solid and dashed red lines indicate concentrations shown to modulate effects in vitro and effects-screening-level thresholds (EAR = 0.001), respectively. Circles on x-axis (BW03 and BW13) indicate EAR < 0.00001. Bottom. Human health benchmark-based individual TQ values (circles) and cumulative TQ (ΣTQ, sum of all detected; red triangles, △) for inorganic and organic analytes listed in Table S7a and detected in spring (domestic, white; imported, blue) and purified-TW (domestic) sourced bottled water samples during 2020. Solid and dashed red lines indicate benchmark equivalent concentrations and effects-screening-level threshold of concern (TQ = 0.1), respectively. Boxes, centerlines, and whiskers indicate interquartile range, median, and 5th and 95th percentiles, respectively, for both plots.
Fig. 6.
Fig. 6.
Group comparison of concentrations of NO3-N (top), As (middle), and VOC (bottom) detected in private TW (blue) and public TW (white) in previously published studies and in BW (purple) herein. Solid red lines indicate enforceable FDA SOQ levels. For NO3-N, SOQ and MCLG are the same. MCLG for As is zero. Boxes, centerlines, and whiskers indicate interquartile range, median, and 5th and 95th percentiles, respectively. Numbers (top center of plots) indicate the permuted probability that the centroids and dispersions are the same (PERMANOVA; 9999 permutations) across all groups.

References

    1. Akhbarizadeh R, Dobaradaran S, Schmidt TC, Nabipour I, Spitz J, 2020. Worldwide bottled water occurrence of emerging contaminants: A review of the recent scientific literature. J. Hazard. Mater 392, 122271 10.1016/j.jhazmat.2020.122271. - DOI - PubMed
    1. Allaire M, Wu H, Lall U, 2018. National trends in drinking water quality violations. PNAS 115 (9), 2078–2083. 10.1073/pnas.1719805115. - DOI - PMC - PubMed
    1. Altenburger R, Scholze M, Busch W, Escher BI, Jakobs G, Krauss M, et al., 2018. Mixture effects in samples of multiple contaminants–An inter-laboratory study with manifold bioassays. Environ. Int 114, 95–106. 10.1016/j.envint.2018.02.013. - DOI - PubMed
    1. American Academy of Pediatrics: Committee on Nutrition. 1995. Fluoride supplementation for children: Interim policy recommendations. Pediatrics. 95 (5), 777–777. 10.1542/peds.95.5.777. - DOI - PubMed
    1. American Public Health Association 2018a. 9213 Recreational Waters (2017). In: Standard Methods For the Examination of Water and Wastewater, 8, https://www.standardmethods.org/doi/abs/10.2105/SMWW.2882.187. - DOI

Publication types