. 2022 Dec 20;3(12):100856.
doi: 10.1016/j.xcrm.2022.100856.

Spatial heterogeneity of infiltrating T cells in high-grade serous ovarian cancer revealed by multi-omics analysis

Affiliations

Spatial heterogeneity of infiltrating T cells in high-grade serous ovarian cancer revealed by multi-omics analysis

Bin Yang et al. Cell Rep Med. .

Abstract

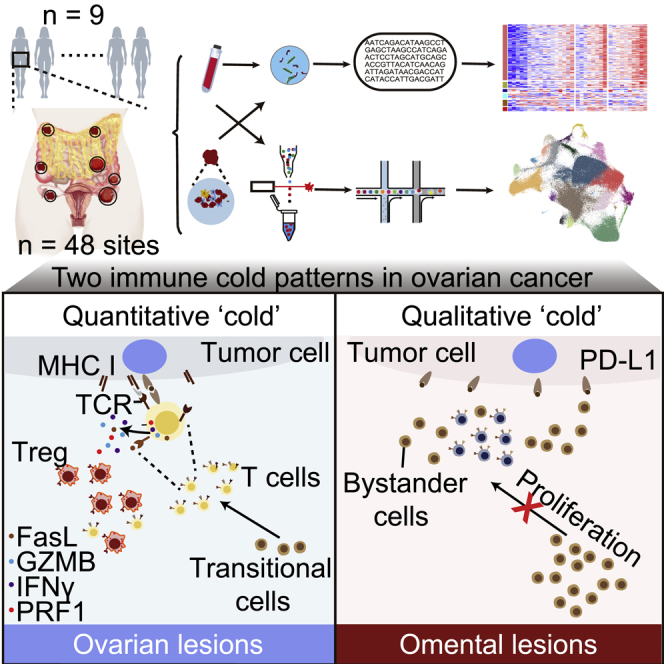
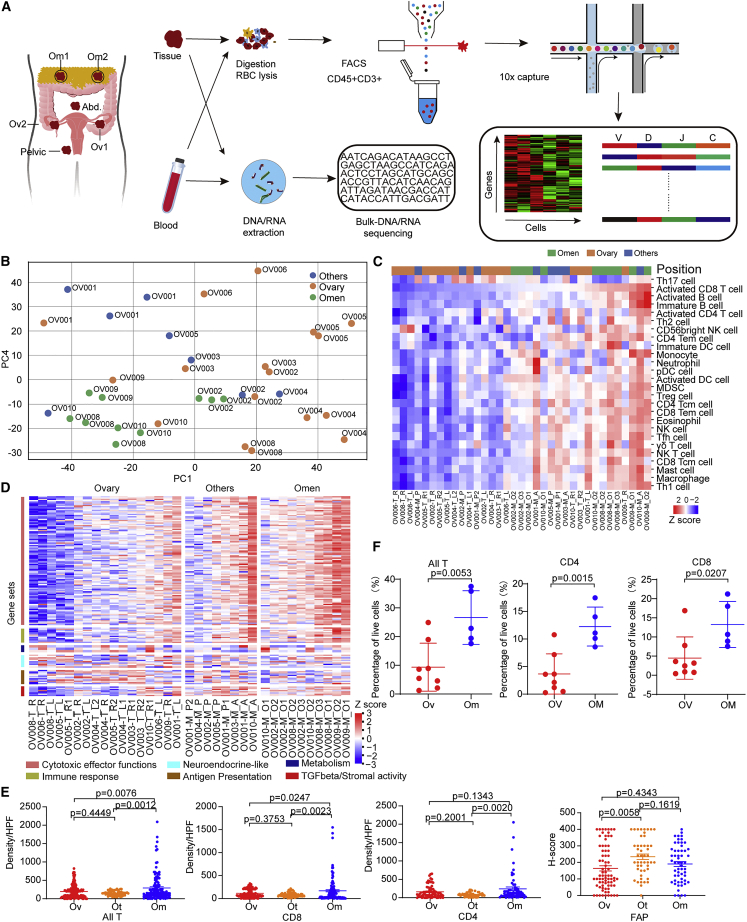
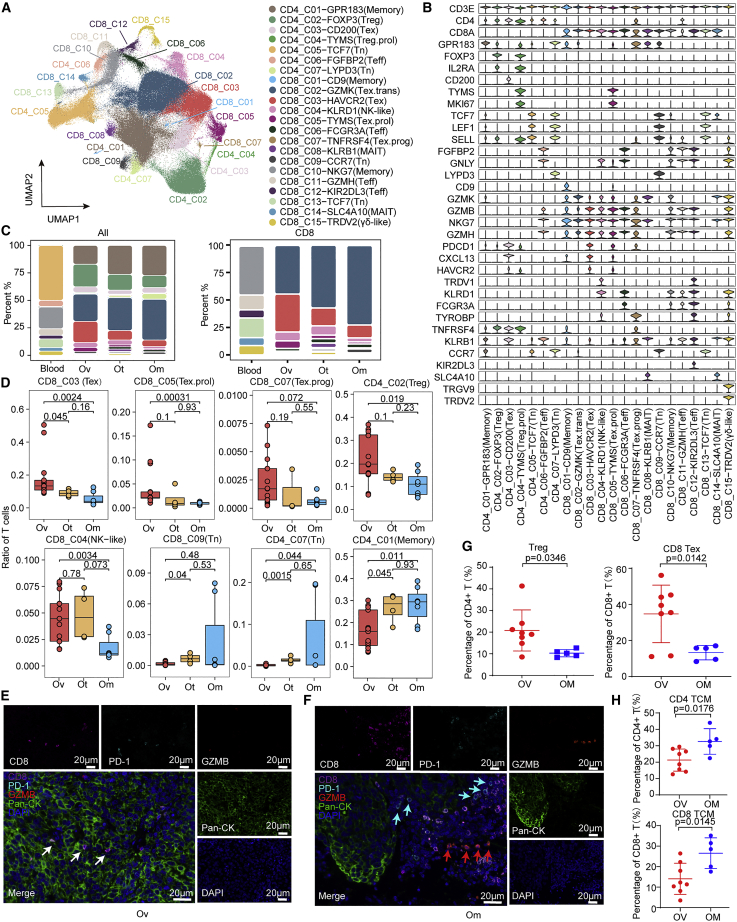
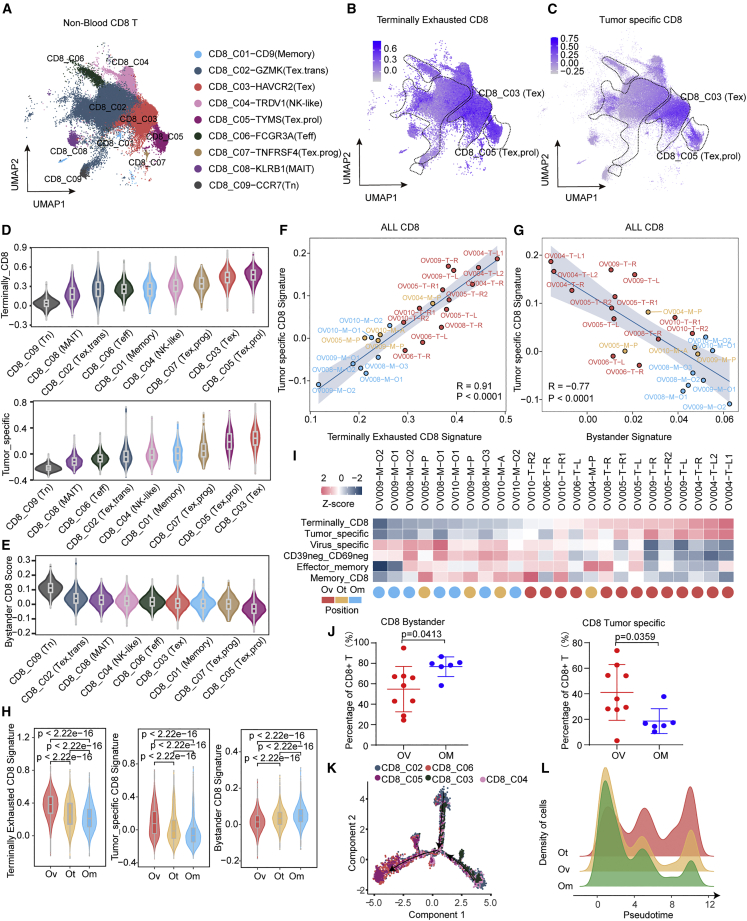
Tumor-infiltrating lymphocytes (TILs), especially CD8+ TILs, represent a favorable prognostic factor in high-grade serous ovarian cancer (HGSOC) and other tumor lineages. Here, we analyze the spatial heterogeneity of different TIL subtypes in HGSOC. We integrated RNA sequencing, whole-genome sequencing, bulk T cell receptor (TCR) sequencing, as well as single-cell RNA/TCR sequencing to investigate the characteristics and differential composition of TILs across different HGSOC sites. Two immune "cold" patterns in ovarian cancer are identified: (1) ovarian lesions with low infiltration of mainly dysfunctional T cells and immunosuppressive Treg cells and (2) omental lesions infiltrated with non-tumor-specific bystander cells. Exhausted CD8 T cells that are preferentially enriched in ovarian tumors exhibit evidence for expansion and cytotoxic activity. Inherent tumor immune microenvironment characteristics appear to be the main contributor to the spatial differences in TIL status. The landscape of spatial heterogeneity of TILs may inform potential strategies for therapeutic manipulation in HGSOC.

Keywords: TILs; high-grade serous ovarian cancer; multi-omics; multiple lesions; spatial heterogeneity.


Conflict of interest statement

Declaration of interests G.B.M. has licensed an HRD assay to Myriad Genetics and on Digital Spatial Profiling to Nanostring and is an SAB member/consultant with Amphista, AstraZeneca, Chrysallis Biotechnology, GSK, ImmunoMET, Ionis, Lilly, PDX Pharmaceuticals, Signalchem Lifesciences, Symphogen, Tarveda, Turbine, and Zentalis Pharmaceuticals.

Figures

None
Graphical abstract
Figure 1
Figure 1
Differential transcriptomic profiles across multiple sites in HGSOC (A) Overview of the study design. (B) The PCA plot of mRNA expression. (C) The abundance of 28 immune cell types (identified by ssGSEA) is shown according to distinct locations. (D) The gene expression of six immune-related pathways in tumors of different locations. (E) Quantification of densities of CD4+ and CD8+ cells, and FAP H scores across three sites. Data represent mean ± SEM. p values were determined by Tukey’s multiple comparisons test. (F) Quantification of all T (CD45+CD3+), CD4+ T (CD45+CD3+CD4+), and CD8+ (CD45+CD3+CD8+) T proportions in tumors from each sample, respectively. Ovarian samples = 8, omental samples = 5. Data represent mean ± SEM. p values were determined by Student’s t test.
Figure 2
Figure 2
Distinct characteristics and differential composition of TILs across different lesions in HGSOC by scRNA-seq (A) Uniform Manifold Approximation and Projection (UMAP) of 227,769 single CD3+ T cells from 6 HGSOC patients, showing the formation of 22 main clusters, including 15 for CD8+ cells (including 9 tumor-infiltrating T cell clusters and 6 T cell clusters from blood), 7 for CD4+ cells (including 5 tumor-infiltrating T cell clusters and 2 T cell clusters from blood). (B) Violin plots showing marker genes across 22 CD3+ T cell clusters. (C) Bar plot indicating relative proportions of each cell cluster detected in blood and solid tumor lesions, including ovarian (Ov), omental (Om), and other distant metastatic (Ot). (D) Boxplot of the relative proportions of each tumor-infiltrating T cell clusters detected in solid tumor lesions, including Ov, Om, and Ot. wilcox.test. (E) The co-expression of CD8 and PD-1 in the ovarian site was evaluated by opal multiplex IHC. AEC color signals were extracted from each digitized single-marker image by color deconvolution, followed by pseudo-coloring. A representative image is shown. Nuclei (blue), GZMB (red), CD8 (magenta), PD-1 (cyan), and pan-CK (green). Scale bars, 20 μm. White arrow indicates CD8+ PD-1+ T cells. (F) A representative image of CD8+ T cells in omentum samples is shown. Nuclei (blue), GZMB (red), CD8 (magenta), PD-1 (cyan), and pan-CK (green). Scale bars, 20 μm. Cyan arrows indicate PD-1+ cells and red arrows indicate GZMB+ cells. (G) Quantification of Treg (CD45+CD3+CD4+CD25+CD127) and CD8+ Tex (CD45+CD3+CD8+PD-1+/LAG3+) proportions in tumors from each sample, respectively. Ovarian samples = 8, omental samples = 5. Data represent mean ± SEM. p values were determined by Student’s t test. (H) Quantification of CD4+ central memory T (Tcm) (CD45+CD3+CD4+CD45RA-CCR7+), CD8+ Tcm CD45+CD3+CD8+CD45RA-CCR7+) proportions in tumors from each sample, respectively. Ovarian samples = 8, omental samples = 5. Data represent mean ± SEM. p values were determined by Student’s t test.
Figure 3
Figure 3
Characterization of CD8+ tumor-infiltrating T cells in HGSOC (A) UMAP of 94,424 single CD8+ tumor-infiltrating cells, showing the formation of 9 main clusters in tumor tissues. (B and C) UMAP of CD8+ tumor-infiltrating cells colored according to gene signature scores, (B) terminally exhausted CD8+ signature, and (C) tumor-specific CD8+ signature. (D) Violin plots showing the sorted gene signatures scores (up, terminally CD8+ signature score; down, tumor-specific signature score) across 9 CD8+ tumor-infiltrating cell clusters. (E) Violin plots showing the sorted bystander CD8+ signature score across 9 CD8+ tumor-infiltrating cell clusters. (F and G) Correlations between different gene signatures in all CD8+ tumor-infiltrating cells at the sample level, (F) terminally exhausted CD8+ signature score and tumor-specific CD8+ signature score, and (G) bystander signature score and tumor-specific CD8+ signature score, each color represents a different tumor site. (H) Violin plots showing the gene signatures scores (left, terminally exhausted CD8+ signature score, middle, tumor specific CD8+ signature score, right, bystander CD8+ signature score) in CD8+ tumor-infiltrating cells from different positions, including Ov, Om, and Ot. wilcox.test. (I) Heatmap showing multi gene signatures and sample positions information at the sample level, arranged from low to high by the terminally CD8+ signature score. (J) Quantification of CD8+ bystander T (CD45+CD3+CD8+CD39) and CD8+ tumor-specific T (CD45+CD3+CD8+CD39+) cells proportions in tumors from each sample, respectively. Ovarian samples = 8, omental samples = 5. Data represent mean ± SEM. p values were determined by Student’s t test. (K) Potential developmental trajectory of CD8+ tumor-infiltrating cells inferred by Monocle2 based on gene expressions, each color represents a different cluster. (L) Density plot showing the density patterns of cells from different tumor positions, including Ov, Om, and Ot along the pseudotime, each color represents a tumor site.
Figure 4
Figure 4
Exhausted CD8 T cells enriched in primary ovarian tumors are clonally expanded (A) UMAP showing the label transfer result from the CD8_C05 proliferation cluster, each color represents a different cluster, as in Figure 2A. (B) Heatmap depicting the mean cluster expression of a panel of T cell-related genes. (C) The co-expression of GZMB, CD8, and PD-1 was evaluated by opal multiplex IHC. AEC color signals were extracted from each digitized single-marker image by color deconvolution, followed by pseudo-coloring. A representative image is shown. Nuclei (blue), GZMB (red), CD8 (magenta), PD-1 (cyan), and pan-CK (green). Scale bars, 20 μm. The white arrows indicate single-marker cells and the yellow arrow indicates a triple-positive cell. (D) Correlation of exhaustion signature and effector signature in CD8_C03 (Tex) T cells with or without proliferation, each point represents a T cell, each color represents a different proliferation state, the point size represents the clonal size of the TCR. (E) Comparison of gene signatures between CD8_C03 (Tex) T cells with proliferation and those without proliferation with shared TCR clone type, each dot represents a TCR clone type, dot size represents the TCR clone size. (F) Clonal expansion levels of CD8+ T cell clusters quantified by STARTRAC-expa indices for each patient (n = 6). (G) Fraction of proliferating T cells in CD8_C03 dysfunctional T cells (including the original CD8_C03 cluster and the CD8_C03 cluster label transferred from the CD8_C05 cluster) stratifying cells by their dysfunctional score.
Figure 5
Figure 5
Exhausted CD8 T cells are a consequence of differentiation (A) Heatmap showing the transition of all CD8+ tumor-infiltrating cells quantified by pSTARTRAC-tran indices for each patient (n = 6). (B–D) Developmental transition of CD8_C03(Tex) cells (B), CD8_C02 (Tex,trans) (C), and CD8_C05 (Tex.prol) (D) clusters with other CD8+ cluster cells quantified by pSTARTRAC-tran indices for each patient (n = 6), Kruskal-Wallis test. (E) UMAP distribution of cells bearing a selected TCR of interest (shared among CD8_C02, CD8_C03, and CD8_C05). (F) Cluster distribution of top 30 shared TCRs and colored by the CD8+ tumor-infiltrating cell clusters. Left, shared among CD8_C02 (Tex,trans), CD8_C03 (Tex), and CD8_C05 (Tex.prol); right, shared only between CD8_C02, and CD8_C03. (G) Visualization of the silhouette coefficient score on the UMAP of the CD8+ tumor-infiltrating cells. Silhouette coefficient is calculated on the basis of the mean intracluster distance and the mean of the nearest cluster distance for each cell of each cluster. (H) UMAP showing the label transfer result from the CD8_C02-GZMK cluster, each color represents a different cluster as in Figure 2A. (I and J) Quantification of each cluster contribution to shared clones. Each dot corresponds to a shared clone between the three clusters: CD8_C02 (Tex,trans), CD8_C03 (Tex), and CD8_C04 (NK-like) in all sites (I), ovarian sites (J) (left), omental sites (J) (middle), and other metastasis sites (J) (right) of CD8+ tumor-infiltrating cells. Dots highlighted in red correspond to clones that are shared with the proliferation cluster (CD8_C05).
Figure 6
Figure 6
CD4 Treg cells are responsible for suppressing the immune microenvironment in primary ovarian tumor sites (A) UMAP of 81,385 single CD4+ T cells, showing the formation of 7 main clusters. (B and C) UMAP of CD4+ cells colored according to gene signatures scores: (B) tumor-specific CD8+ signature score, (C) CD39CD69 signature score. (D) Violin plots showing the gene signatures scores (left, terminally exhausted CD8+ signature score; right, tumor-specific CD8+ signature score) in CD4+ tumor-infiltrating cells from different sites, including Ov, Om, and Ot. wilcox.test. (E) Violin plots showing the bystander gene signatures scores in CD4+ tumor-infiltrating cells from different sites, including Ov, Om, and Ot. wilcox.test. (F) Heatmap depicting the expression of a panel of T cell-related genes in CD4_C03 and CD8_C03 clusters. (G) UMAP showing the label transfer result from CD4_C04 proliferation cluster, each color represents a different cluster as in Figure 2A; here, CD4_C04 was mainly label transferred to CD4_C02. (H) Developmental transition of CD4_C04 (Treg.prol) with other CD4+ cells quantified by pSTARTRAC-tran indices for each patient (n = 6), Kruskal-Wallis test. (I and J) Potential developmental trajectory of CD8+ tumor-infiltrating cells inferred by Monocle2 based on gene expressions, each color represents a different cluster (I) or lesions sites (J). (K) Fraction of proliferating T cells in the CD4_C02 cluster (including the original CD4_C02 cluster and the CD4_C02 cluster label transferred from the CD4_C04 cluster) stratifying cells by their Treg score.
Figure 7
Figure 7
Inherent TME characteristics contribute to spatial differences of TIL status (A) Developmental migration of CD8+ tumor-infiltrating cells between every two of the three tumor sites quantified by pSTARTRAC-migr indices for each patient (n = 6), Kruskal-Wallis test. (B) Top 10 shared clones of blood and tumor (bottom) being shared with tumor and blood, respectively, for each CD8 cluster. This analysis was performed in ovarian (Ov, left), and omental (Om, right) sites, respectively. (C) The number of nodes of the network diagrams were counted and compared among tumor sites. Tukey’s multiple comparisons test. (D) Enrichment plots from gene set enrichment analysis (GSEA) showing significantly differentially regulated pathways between ovarian and omental sites at the single-cell level in all CD3+ tumor-infiltrating T cell (left), CD8+ tumor-infiltrating cells (middle), or CD4+ tumor-infiltrating cells (right). NES, normalized enrichment score. (E) Quantification of MHC class I H scores across three sites. Data represent mean ± SEM. p values were determined by ANOVA. (F and G) Quantification of the ratio of densities of CD4+ (F) and CD8+ (G) cells in tumor and stromal area among tumor sites. Data represent mean ± SEM. p values were determined by Tukey’s multiple comparisons test.

References

    1. Ferlay J., Soerjomataram I., Dikshit R., Eser S., Mathers C., Rebelo M., Parkin D.M., Forman D., Bray F. Cancer incidence and mortality worldwide: sources, methods and major patterns in GLOBOCAN 2012. Int. J. Cancer. 2015;136:E359–E386. - PubMed
    1. Torre L.A., Trabert B., DeSantis C.E., Miller K.D., Samimi G., Runowicz C.D., Gaudet M.M., Jemal A., Siegel R.L. Ovarian cancer statistics, 2018. CA A Cancer J. Clin. 2018;68:284–296. - PMC - PubMed
    1. Sharma P., Allison J.P. The future of immune checkpoint therapy. Science. 2015;348:56–61. - PubMed
    1. González-Martín A., Sánchez-Lorenzo L. Immunotherapy with checkpoint inhibitors in patients with ovarian cancer: still promising? Cancer. 2019;125:4616–4622. - PubMed
    1. Jayson G.C., Kohn E.C., Kitchener H.C., Ledermann J.A. Ovarian cancer. Lancet. 2014;384:1376–1388. - PubMed

Publication types

Substances